Basis path based test suite minimization using genetic algorithm

Author: Anbunathan R., Anirban Basu
Journal: International Journal of Intelligent Systems and Applications @ijisa
Article in issue: 11 vol.10, 2018.
Free access
UML State Diagram is used to represent the behavior of the System Under Test (SUT) when an event occurs. The state of the system is determined by the event that occurs randomly. The system state changes when the transition relationship between the States is satisfied. Test cases are generated from State Chart Diagram to test the behavior of the system. When multiple decision nodes are present in the same path, path explosion occurs. A method is proposed to generate Basis Path (BP) test cases with node coverage using Genetic Algorithm (GA) to overcome this problem. Experiments are conducted upon various Android applications and the efficiency of the algorithm is evaluated through the code coverage and the mutation analysis. Using this approach, BP test cases, Robotium test scripts are generated for 10 Android applications and observed an average of 70% reduction in the test case number concerning all path test cases. The resulted average code coverage is 74%, and Defect Removal Efficiency (DRE) is 95%. The experimental results show that the proposed method is effective when compared to other methods.
Test automation, Genetic Algorithm, Executable Test generation
Short address: https://sciup.org/15016543
IDR: 15016543 | DOI: 10.5815/ijisa.2018.11.05
Text of the scientific article Basis path based test suite minimization using genetic algorithm
Published Online November 2018 in MECS
Software testing involves both black box testing and white box testing. Unit test cases are derived from source code in the case of white box testing. System and functional test cases are derived from requirements in the case of black box testing. Unified Modeling Language (UML) State Chart Diagram (SCD) is used to capture user scenarios, and test cases are generated from SCD. Although software testing is having substantial contributions towards test generation from State Chart Diagrams [3], [4], [7], [9], [18], [19], test generation for the SCD remains an open research problem. These methods missed discussing path explosion problem when multiple decisions are present in the same path. These paths increase exponentially by the multiplication factor equal to the number of branches present in the decisions.
As path explosion problem results in a large number of test cases, all path test cases generated from SCD are not practically usable. The objective of this paper is to create BP test cases using a Genetic Algorithm (GA) and reduce the number of test cases to solve path explosion problem. Although similar approaches are present in literature, the effectiveness of the approach is not quantitatively analyzed. In the proposed method, SCD is used as input, and the diagram components such as edges, labels, nodes are extracted from SCD, Basis Path test cases are generated by GA, and Robotium scripts are generated by identifying Application Programming Interfaces (APIs), and their arguments. A menu tree database is extracted from the target Android device, which helps to provide the exact menu item to be used in API’s argument, even though user input is not accurate.
The existing test generation methods [14-16] focus on only code coverage and mutation analysis to validate their approach. The performance improvement of the algorithms involved in their methods is not empirically evaluated. This work leads to the following research questions:
-
1. Any significant improvement is achieved in GA performance?
-
2. Any significant reduction in the number of generated test cases is achieved in the case of path explosion?
-
3. Are the generated Basis Path test cases effective?
In this paper, an empirical study is done to compare all path and BP test cases, to prove there is a significant reduction in the number of BP test cases compared to all path test cases. Statistical analysis is done with these two data, and the 2T test is performed to prove a significant reduction in number. Also, GA performance is improved by applying a smart mutation, and the effectiveness is empirically evaluated. The number of generations with and without the smart mutation is statistically analyzed, the 2T test is performed to prove there is a significant reduction in the number of generations in the case of smart mutation is applied. Finally, the approach is evaluated by executing the generated test cases on ten different Android applications. The code coverage is found using EMMA and JACOCO tools, and the mutation analysis is performed using Jester tool. EMMA is used for Eclipse based Android applications whereas JACOCO is used for Android Studio based applications. The study shows that the average code coverage is 74% and defect removal efficiency is 95% for Android applications, which is encouraging.
The primary contributions of this paper are
-
(1) This work presents a novel approach that generates Basis Path based optimized executable test cases using Genetic Algorithm with UML State Chart Diagram as input.
-
(2) This work proposes a chromosome representation of Basis Path, gene representation of edge, and smart mutation to speed up generations in Genetic Algorithm.
-
(3) The proposed approach empirically validates the effectiveness of the generated test cases by executing generated Robotium scripts on Android mobile device to find out code coverage and defect removal efficiency.
-
(4) The proposed approach empirically evaluates that there is a significant reduction in test case number using this approach.
-
(5) A new genetic operator called Genetic History (GH) is introduced to copy genetic information so far evolved to offspring.
-
(6) This work empirically evaluates that there is a significant performance improvement in GA after using GH.
This paper is organized as follows. Section 2 summarizes the related works. Section 3 introduces the path explosion problem and method for generating BP test cases. Section 4 illustrates the approach in detail, followed by Section 5 describing the experimental setup. Section 6 presents the results of the experiments conducted on many real subject systems. Section 7 compares this approach with other existing approaches. Finally, Section 8 concludes the paper and anticipates the future work.
-
II. Related Work
Different test generation methods are present in the literature [1]. Different algorithms are used for generating tests such as Depth First Search (DFS), Breadth First Search (BFS), Genetic Algorithm [2], recursive algorithm, Ant Colony Optimization (ACO), Cuckoo, etc. Different inputs are used for generating tests such as UML State diagram, Activity diagram, Sequence diagram, source code, etc. Different coverage criteria such as node coverage, edge coverage, path coverage, etc. are used for finding the effectiveness of algorithms.
-
A. Search Based Test Generation
In [3] and [4], Zhao et al. proposed search-based test generation techniques. In [3], a binary tree structure is used as input, GA is used to shape generation, and constraint solving technique is used to value generation. The effectiveness of generated test is evaluated by running tests on a C program. The study proves that the test generation cost is cubically increasing with the increase of the number of pointer constraints. In [4], GA is used to generate feasible paths from Finite State Machine (FSM) models. An empirical study is done to find key factors which affect the test generation. The study proves that the number of numerical equal operators present in condition influence the number of generations required to get a feasible path.
Srivastava et al. [6-9] proposed search-based techniques to generate the test sequence. In [6], a Control Flow Graph (CFG) from code is created, and different weights are assigned to edges based on criticality. A Genetic Algorithm traverses through this CFG, finds more critical paths and generates test cases for only those paths. In [7], a state-transition model of the system is used as input, and an optimal test sequence is selected after traversing through the directed graph using Ant Colony Optimization (ACO) technique. This method ensures both state and transition coverage. In [8], a firefly algorithm is used to generate optimal paths with the reduction in number while comparing with independent paths. A State Transition Diagram (STD) and CFG are used as inputs to the algorithm, and a guidance matrix is generated from adjacency matrix which guides the traversal. In [9], a set of critical paths is selected using Cuckoo search algorithm, taking State diagram as input and generates optimal test sequences as output. An empirical study is done to find the effectiveness of this approach and found that the state and transition coverages are outperformed. Similarly, other approaches [5], [1113], [17], [26] use search-based techniques to generate test sequences.
-
B. UML State Diagram Based Testing
In literature, many approaches [18-21] are available for generating tests from UML State diagram. In [18], Samuel et al. proposed a function minimization technique to create optimal test sequences from UML State diagram to achieve transition coverage. In [19], Ranjitha et al. suggested a function minimization technique to traverse through UML State diagram and generate optimal test sequence to achieve state, transition, transition pair, and full predicate coverage. In [20], Santhosh et al. proposed an approach to traverse through combined State and Activity diagrams called SAD to achieve state and activity path coverage. In [21], Shirole et al. proposed GA based technique to traverse through EFSM diagram and generate a set of feasible path test sequences to achieve data flow coverage. Similarly, other approaches [22], [25] generate test cases from UML diagrams.
-
C. Executable Test Generation
In literature, many approaches [14-16] are available for Android testing. In [14], Nguyen et al. proposed a method to combine both model-based testing and combinatorial testing techniques to generate test sequences. UML State diagram is used as input, the classification tree is used for designing tests, and Robotium or Selenium scripts are created. The effectiveness of the approach is evaluated by finding code coverage and mutation coverage. In [15], Mahmood et al. proposed a GA based approach called Evodroid to traverse through the code, find segments in the code, links the segments using Call Graph Model (CGM), and generates test sequence to achieve better code coverage. From the test sequences, Robotium scripts are generated, and Emma is used for finding code coverage. In [16], Aravind et al. proposed an approach called Dynodroid which employs Executor to produce Android events using Monkeyrunner tool, an Observer to find next possible events to be triggered using Hierarchy viewer and SDK, a Selector to select appropriate next event. The effectiveness of this approach is evaluated by obtaining code coverage. Similarly, other approaches [23], [24] generate executable tests from UML diagrams.
-
III. Test Generation using GA
In this section, the path explosion problem is explained in detail. The relevant keywords and their definitions are given. The method to generate executable test cases from SCD is described in detail.
-
A. Path explosion problem
The path explosion problem is explained from SCD as shown in Figure 2. There are three choices namely choice1, choice 2 and choice 3. The number of branches present in choices is two, three, and four respectively. Since all decisions are found in the same path, the number of test cases is the multiplication of the number of branches which is equal to 24. The Cyclomatic Complexity (CC) of this SCD is seven. The number of BP test cases generated from this SCD is 7 which is equal to CC. In this case, the number of test cases is reduced by 71%.
-
B. Definitions
The definitions for some relevant keywords used in this paper are given below
All path coverage
All path coverage is a white-box testing concept that considers the possible paths of the software under test.
Basis path
Basis path (sometimes called independent path) through the program is any path from starting node to terminal node that introduces at least one new set of processing statements or a new condition.
Test coverage
Test coverage is defined as a technique which determines whether the test cases are covering the application code and how much code is exercised when we run those test cases.
Code coverage
Code coverage is a measure used to describe the degree to which the source code of a program is executed when a particular test suite runs.
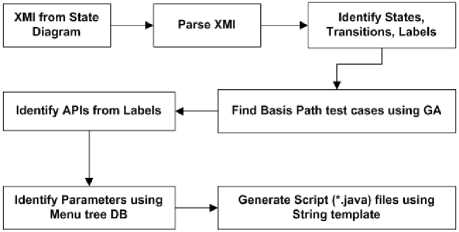
Fig.1. Key steps of the proposed approach for generating executable test scripts.
-
C. Proposed method
The proposed framework is based on UML State Chart Diagram (SCD) based testing. The major steps involved in this approach are illustrated in a block diagram as shown in Figure 1. In this approach, SCD is created to capture input scenarios. The XML Metadata Interchange (XMI) file obtained from this SCD is parsed to extract model information such as States, Transitions, and their labels. GA is used to obtain Basis Path (BP) test cases from States and Transitions. From label names, the Robotium APIs are identified. The parameters for these APIs are determined from Transitions and menu tree database. Finally, test scripts are generated using String template tool.
Algorithm 1. Genetic Algorithm for Finding Bais Paths
Genetic Algorithm
GA is used to generate BP test cases from Stales and Transitions. Chromosome
An edge is defined as a gene.
A chromosome is defined as a set of genes.
The length of chromosome is equal to the number of edges in a graph. Selection
The roulette wheel selection is used to select chromosomes.
Crossover
Multiple crossover is used with probability of 50%,
Fitness function
Fitness is calculated as follows:
-
(I) . Force first gene = eo (Initial State)
-
(ii) . If consequent edges are adjacent, then
Fitness = Fitness + Total adjacent' Position of current edge
Total adjacent *+
Else Fitness = Fitness/2 (Penally)
-
(iii) . If (edge = ek (Final State and out-degree=0) &&
Alladj acentedges = true) then
Objective function = 0
Else Objective function = constant 01
-
(iv) . If (Objective function = 0 && Independent path = True) Then
Add chromosome with highest Fitness value to Basis Path set
Else ignore the chromosome
Smart Mutation
Mutation value is selected as 0.01.
-
(I) . Replace non adjacent edge in a chromosome with adjacent edge.
-
(ii) . Check any edge is missing.
If so, change edge in its order and position
Genetic History
Get Basis path
Find next missing edge
Find previous edge for this missing edge
Search this previous edge in existing Basis paths
If found, take history sequence of genes from start edge to this missing edge
Initialize all chromosomes in the pool, with this history sequence of genes GA Exit Criteria
If (number of basis paths = Cydomatic complexity) ||
If (number of generation = maximum generation) ||
Terminate generation
Algorithm 2. Genetic Algorithm for Identifying APIs
Genetic Algorithm
GA is used to select target API from a set of matching candidate APIs. Chromosome
A chromosome is represented by a character sequence.
A gene is represented by a single character from the set [A-Za-z]. Selection
The roulette wheel selection is used to select chromosomes.
Crossover
Multiple crossover is used
Fitness function
Fitness is calculated as follows:
-
(i) . Evaluate_LCSubstring
lolalFitness += (matching substring length of Se and Chromosome * 500):
totalFitness = totalFitness/Levenshteindistance(Se, Chromosome);
lolalFitness += (matching substring length of Se and bastcandidate' 1000);
totalFitness = totalFitness/Levenshleindistance(Se,bastcandidate);
-
(ii) . Evaluate_LC5ubsequence
lolalFitness += (matching subsequence length of Se and Chromosome*100);
totalFitness = totalFitness/Levenshteindistance(Se,Chromo$orne);
totalFitness += (matching subsequence length of Se and baslcandidate * 200); lolalFitness = totalFitness/Levenshteindistance(Se,bastcandidate);
-
(iii) . Evaluate final fitness
final fitness= evaluate_LCSubstring + evaluate_LCSubsequence
Mutation
Mutation value is selected as 0.01.
Smart mutation is used to replace the genes of selected chromosome with the genes of the best candidate. This helps to arrive at the solution faster,
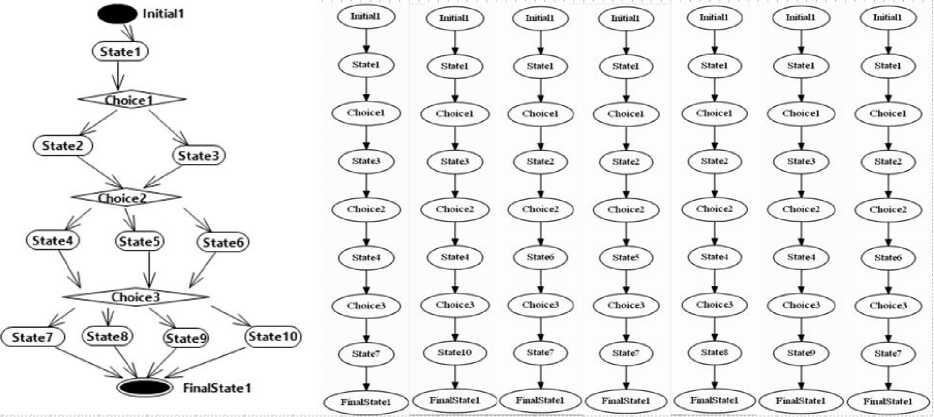
Fig.2. Sample State Chart Diagram and corresponding Basis Path test cases.
GA generates BP test cases from States, Transitions, and Labels. A chromosome is defined as a set of genes. An edge is encoded as a gene. The length of the chromosome is equal to the number of edges in an SCD. A population is generated with several random chromosomes using the roulette wheel selection method. The population evolves by applying genetic operators such as multiple cross-over and smart mutation with a configured value of the crossover probability and mutation probability respectively. A smart mutation is defined to change a gene to the adjacent edge. Also, mutation changes a gene if any edge is missing in the generated BP. A fitness function is defined to evaluate the fitness value of a chromosome. The fitness value increases if the genes are adjacent edges to form a BP and decreases with a penalty if the genes are not adjacent. A new genetic operator called Genetic History (GH) is introduced to copy the best genes to offspring while
-
1) XMI Parser
A UML State Chart Diagram as shown in Figure 2 is created using Papyrus tool. This SCD is represented in the form of XMI notation and saves as *.uml file. This XMI file is parsed using SAX parser and then different SCD components such as States, Transitions and Labels are extracted.
-
2) Basis Path Test Case Generation
When multiple decisions of an SCD present in the same path, path explosion occurs as shown in Figure 2. There are 24 different paths are possible to derive from this SCD. A Genetic algorithm is developed to reduce the number of paths to less than or equal to Cyclomatic complexity computed from the SCD. The coverage criteria to stop generating the paths is all States, and all Transitions are covered. This method ensures a reduced number of test cases are generated, even though path explosion occurs. In the case of sample SCD, seven BP test cases are created as shown in Figure 2. Algorithm1 shows GA which is used to generate BP test cases.
initializing next generation chromosomes. GH acts as a catalyst to speed up the BP test case creation. GA exits if all edges, all nodes are included in the created BP test cases.
-
3) Identify APIs
The Robotium APIs are identified by parsing Transition in an SCD. A Transition consists of multiple words separated by an underscore ( _ ), for example, click_onbutton_open. The last word is considered as the parameter. The rest of the words constitute the String Under Evaluation (Se). A set of string matching algorithms such as Longest Common Substring, Longest Common Subsequence and Levenshtein Distance algorithm is used to process Se and identify the candidate APIs from API database of the target language. In our approach, Robotium is the target language. Genetic Algorithm is used to identify the right target API from the candidate APIs.
Robotium APIs are determined from the transition labels. For example, from the label click_onEditText_ID0, Robotium API driver.clickOnEditText(0) is identified. For this purpose, Genetic Algorithm is used to compare strings and identify matching strings intuitively. GA employs the above string matching algorithms to identify Robotium API. Table 1 show SCD labels and their corresponding Robotium APIs, which are identified using GA. Algorithm 2 shows the GA which is used to identify Robotium APIs [24].
Table 1. SCD Labels and Their Corresponding Robotium APIs
|
Transition Label |
Robotium API |
Argument from Menu tree |
Value from Transition Label |
|
click_Inlist_Note 1 |
clicklnList |
Motel |
- |
|
go_Back |
goBack |
- |
- |
|
click_onmenu_save |
c lickOnMenuI t em |
Save |
- |
|
chck_longont ext _No t e 1 |
c hekL ongOn T ex t |
Motel |
- |
|
click_ontext_open |
clickOnText |
Open |
- |
|
click_oncheckbox_IDO |
clickOnC heckBox |
- |
0 |
|
ent ertext_IDO_B ob |
en terText |
- |
Bob |
|
press_spinneritem_IDO_O |
press Spinner I tem |
- |
0,0 |
|
click_onbut t on_Save |
clickOnBut t on |
Save |
- |
|
clear_Edit text_IDO |
clearEditText |
- |
0 |
|
click onEditText IDO |
clickOnEditText |
- |
0 |
|
click_onimage_IDO |
clickOnlmage |
- |
0 |
|
set_progressbar_IDO_l 5 |
setProgressBar |
- |
0, 15 |
The SCD label consists of two parts such as API name and parameter. API name is user-friendly, readable string connected with the underscore, whereas parameter often consists of keyword ‘ID’ and a number indicating index value as shown in Table 1. For example, in the case of click_oncheckbox_ID0 , “ click_oncheckbox ” represents API name and ID0 represents index value 0 to be passed as an argument to the API. In the case of set_progressbar_ID0_15 , a second parameter for setting progress bar value is given as ‘15’. In the case of click_onbutton_open , the button name to be clicked is given as “open”. Even though user entered an inaccurate menu name “open”, an incorrect menu name “Open” is obtained from Menu Tree (MT) database. In the case of go_back , there is no argument involved.
-
4) Identify Parameter
The parameter in SCD label represents menu item to be handled by the phone. For example, in the case of click_onmenu_save , the menu item to be clicked is given as “ save ”. But actually, it is displayed as “ Save ” on the phone. In this case capital letter “S” is missing on the label. The parameter is compared with strings present in Menu tree database, and the correct string is obtained to handle this situation.
The Menu tree algorithm as shown in Algorithm 3, identifies layouts such as linear layout, relative layout, frame layout, etc. From these layouts, it extracts User Interface (UI) objects such as text, buttons, etc. When it clicks one text item, it checks whether new page or popup is opened. If it is a new page, it recursively calls itself to do the learning of the new UI objects. If the UI object is a popup or a button, it is handled differently. In this way, all UI objects are learned, and then each item is clicked based on the type of widget. The type of widget can be text, radio button, button with text, button with description, system event such as back key press, and home key press.
Algorithm 3. Menu tree Generation
ALGORITHM :: Menu TreeGeneration (){
-
I. Extract widgets in current screen and add in stack
-
II. Take one widget from stack
-
III. Check stack is empty
-
IV. IF empty, RETURN
-
V. IF widget type = text, click and wait for new window
-
VI. Store widget name, widget type, path from root into Sqlite DB
-
VII. IF new window = new page, CALL ‘MenuTreeGeneration’
-
VIII. ELSE IF new window = popup, handle popup
-
IX. GOTO II
}
Menu tree algorithm stores all UI menu items along with its path from root and type of widget in an SQLite database, as shown in Figure 3. The type of menu item is stored under column ‘widtype’ which can be TextView, CheckedText, Button, CheckBox, etc. The menu item is stored in ‘widname’ column. The path traced by the Menu tree algorithm is stored under ‘rootpath’ column for each menu item. The menu item that is extracted from the SCD label is compared with each string under ‘widname’ column, and closest match is retrieved. In this way, even though user provides an incorrect menu value in SCD label, an accurate menu value is obtained from MT database.
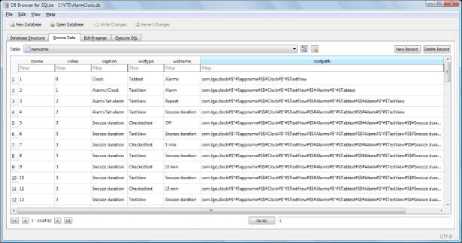
Fig.3. Menu tree database.
-
5) Generate Robotium Scripts
String Template tool is used to generate Java source code after identifying Robotium APIs from Basis Path test cases. These Java files are executed from Eclipse environment with Android JUnit plug-in on the target which is either Emulator or Android mobile device. The result of the test case is displayed as Pass if every API in the test case is executed successfully.
-
IV. Illustration
The proposed method is illustrated with the SCD of Body Mass Index (BMI) calculator application as shown in Figure 4. BMI SCD is created using Papyrus tool. It consists of 13 nodes, 14 edges and its CC is 3. The test scenario is captured in this SCD. The transition label is carrying API name and its argument.
From the SCD, BP test cases are generated by GA, and then Robotium scripts are generated. Figure 4 shows the generated Robotium scripts. There are two choices in BMI SCD with each having two branches. So, it is possible to derive four test cases from this SCD. But only three BP test cases are generated by GA and number of test cases reduced by 25%. The code coverage achieved by these test cases is 89%, and the defect removal efficiency is 100%. This result shows this approach is effective and satisfactory.
-
V. Experimental Setup
The experimental approach is simple and straightforward. Papyrus tool is used to make the SCD. A tool called Virtual Test Engineer (VTE) is developed to parse the XMI file from the SCD and extract nodes, edges, and labels. There are 10 Android applications taken for evaluation. The number of all paths from the SCDs is varying from 4 to 2048 for the Applications Under Evaluation (AUE). These paths are optimized by the GA which generates the BP test cases. The Robotium scripts that are generated from the BP test cases are executed on the corresponding AUE. Finally, code coverage analysis and mutation analysis are performed to find out the effectiveness of this approach.
-
A. Subjects for experiments
There are ten different Android applications are downloaded from F-Droid application portal with varying size from 243 to 11442 Lines Of Codes (LOC) as shown in Table 3. These applications are built with either Eclipse or Android Studio platform. The corresponding SCDs are constructed using Papyrus tool with varying nodes from 13 to 73 and edges from 14 to 88. The CC of these SCDs is ranging from 3 to 20 as shown in Table 3. The all path test cases from these SCDs are varying from 4 to 2048.
Table 2. Time Taken for the Generation With/Without Genetic History
|
With out Genetic History |
With Genetic History |
||
|
Number of generations |
Time in seconds |
Number of generations |
Time in milli seconds |
|
16703 |
16 |
72 |
409 |
|
23245 |
21 |
77 |
432 |
|
10959 |
9 |
80 |
455 |
|
30596 |
30 |
79 |
443 |
|
40975 |
37 |
72 |
410 |
|
14373 |
12 |
78 |
443 |
|
14532 |
14 |
78 |
439 |
|
14455 |
14 |
80 |
468 |
|
26500 |
23 |
74 |
413 |
|
7222 |
6 |
81 |
462 |
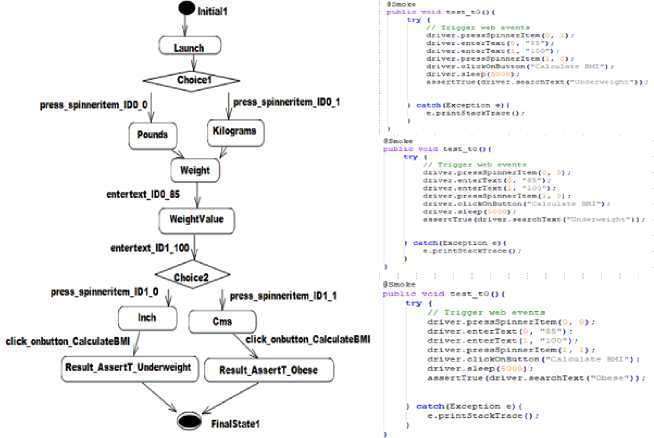
Fig.4. BMI SCD and Robotium scripts.
-
B. Test generation
A Genetic Algorithm is developed to generate BP test cases from SCD as shown in Algorithm 1. Initially, the smart mutation was not applied, and GA took more time to find BP test case. Sometimes, it was not converging to locate the solution till it reaches maximum generations. The maximum generation is defined as 100000 generations with multiple crossovers. An edge is defined as a gene, a chromosome is a set of genes, and the length of the chromosome is equal to the number of edges. The encoding of an edge is done with the number equal to the order it appears in the XMI file. The fitness function is defined as shown in Algorithm 1. Whenever adjacent edges are found on a chromosome, the fitness value increases. When there is no adjacent edge found, a penalty is given. When the adjacent edge has the final node as the target node, the objective function score is made 0. This is considered to be a successful generation of a BP test case. A smart mutation is applied to speed up the generation, to replace a nonadjacent edge with an adjacent edge. Also, smart mutation periodically checks any edge is missing, if so, replaces that edge in its order and position. After applying smart mutation, GA converges and finds the solution quickly as the time taken for the generation is reduced as shown in Table 2. To
further optimize GA performance, a new genetic operator known as Genetic History (GH) is applied. The following steps are followed to apply GH:
-
1. Get Basis path
-
2. Find next missing edge
-
3. Find the previous edge for this missing edge
-
4. Search this previous edge in existing Basis paths
-
5. If found, take history sequence of genes from start edge to this missing edge
-
6. Initialize all chromosomes in the pool, with this history sequence of genes
-
7. Now GA evolves and solves with reduced number of generations and time
GA ensures the node coverage, and the number of generated BP test cases is less than or equal to CC. The following configurations are used for GA:
Population size = 200
Maximum generations = 100000
Cross over probability = 0.5
Mutation probability = 0.15
Tournament selection size = 10
Basic metrics
Table 3. Basic Metrics
|
Notepad |
17 |
25 |
10 |
10 |
14 |
1852 |
37 |
3 |
25 |
3 |
|
Calculator |
73 |
SS |
17 |
17 |
60 |
3252 |
43 |
0 |
17 |
2 |
|
TippyTipperActivitie |
43 |
45 |
4 |
4 |
6 |
574 |
190 |
3 |
13 |
0 |
|
DynanucnightLight |
25 |
37 |
14 |
14 |
43 |
1252 |
30 |
1 |
3 |
0 |
|
MultipleSMS |
37 |
41 |
6 |
6 |
26 |
806 |
14 |
3 |
17 |
2 |
|
FreeOTP |
27 |
35 |
10 |
9 |
192 |
4065 |
26 |
4 |
13 |
0 |
|
BMICalcuhtor |
13 |
14 |
3 |
3 |
4 |
243 |
IS |
0 |
6 |
0 |
|
CIDRcalculator |
35 |
53 |
20 |
16 |
2048 |
4798 |
59 |
9 |
42 |
1 |
|
Token |
33 |
43 |
12 |
11 |
324 |
11442 |
72 |
3 |
33 |
3 |
|
Counter |
51 |
61 |
12 |
10 |
1536 |
2147 |
73 |
22 |
0 |
The basic metrics are as shown in Table 3. The definition of key metrics are given below:
Number of Nodes (NON) : The number of nodes that are present in the SCD
Number of Edges (NOE) : The number of edges that are present in the SCD
Cyclomatic Complexity (CC) : It is calculated as
CC=NOE-NON+2
Number of BP test cases (NOBP) : The number of BP test cases that are generated by GA
Number of All Path test cases (NOAP) : the number of all path cases resulted from the path explosion
Percentage reduction in number (PRIN) : It is calculated as the ratio of NOBP and NOAP
Executable Lines Of Codes (ELOC) : The executable lines of code that are present in an application
Percentage code coverage (PCC) : It is calculated as the ratio of LOC covered and ELOC
Number of Menu Items Found (NOMIF) : The total menu items including the missed menu items
Number of Menu Items Missed (NOMIM) : The menu items that are missed to capture by MT algorithm
Efficiency of MT Algorithm (EOMTA) : The ratio of MT captured (NOMIF-NOMIM) and NOMIF
Number of Mutations (NOM) : The number of mutants that are generated by the Jester tool
Number of Not Killed Mutations (NONKM) : The number of mutants that are not killed by the Jester tool
Defect Removal Efficiency (DRE) : The ratio of mutants killed (NOM-NONKM) and NOM
Similarly, GA metrics are shown in Table 2 and defined as follows:
Time Taken With Genetic History (TTWGH) : The time taken by the GA to generate the BP test cases with Genetic History
Time Taken WithOut Genetic History (TTWOGH) : The time taken by the GA to generate the BP test cases without Genetic History
Generations With Genetic History (GWGH) : The number of GA generations required to generate the BP test cases with Genetic History
Generations WithOut Genetic History (GWOGH) : The number of GA generations required to generate the BP test cases without Genetic History
C. Data collection
Time taken by GA to generate BP test cases for the SCD is captured with and without mutation as TTWM and TTWOM. For every application, the corresponding test scenarios are captured in the SCD. An MT database is generated from this application using the MT tool. NOMIF, NOMIM are captured, and then EOMTA is calculated. The XMI file from SCD and MT database are given as inputs to VTE. VTE generates BP test cases and Robotium scripts. NOBP and NOAP are captured, and then PRIN is calculated. These scripts are executed on corresponding Android application to find code coverage. EMMA and JACOCO tools are used to capture code coverage. These tools provide ELOC and LOC covered information. PCC is calculated from this information. The Jester tool is used to generate the mutants and execute the mutant programs; as a result, NOM and NONKM are captured. Finally, DRE is calculated from NOM and NONKM.
-
VI. Experimental Results
In this section, the performance of GA is examined through statistical analysis and effectiveness of this approach is validated through the code coverage and the DRE metrics. TTWM and TTWOM are analyzed statistically to find out that the time taken by the GA to generate the BP test cases is reduced significantly. Chi-squared test, Box plot, 2T test and Lavene test are performed to conclude. Similarly, NOBP and NOAP are statistically analyzed to find out that the number of test cases is reduced significantly.
-
A. Analysis and Discussion
Research Question 1 (Performance) : Any significant improvement is achieved in GA performance?
-
1) Analysis of Time Taken by GA
The values of TTWGH and TTWOGH and the corresponding mean values are plotted in Figure 5. The values of TTWOGH are fluctuating, whereas values of TTWGH are almost stable. The mean values show there is a substantial reduction in time taken for generation of Basis Paths.
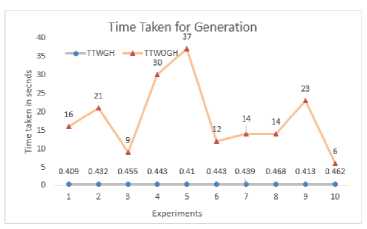
Fig.5. TTWGH Vs. TTWOGH Mean Values
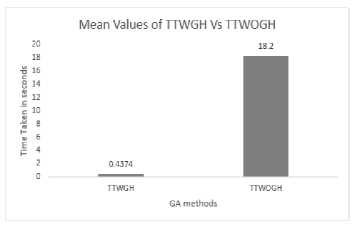
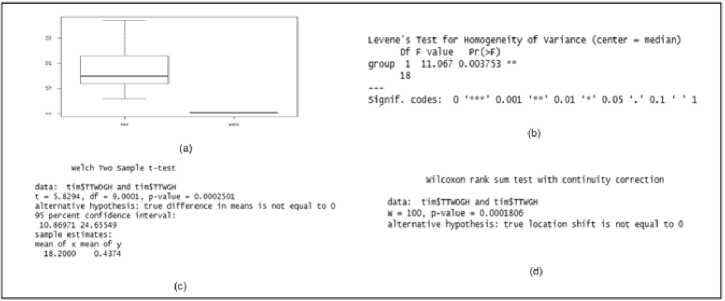
Fig.6. GA time taken analysis (a). Box plot (b). Levene’s test (c). 2T test (d). Wilcox test.
TTWGH and TTWOGH are analyzed using R Studio as shown in Figure 6. Box plot and Levene’s test are performed to check whether the variants of TTWGH and TTWOGH are equal. The 2T test is carried out to check TTWGH and TTWOGH are from two independent groups.
The statistical results are analyzed, and the following conclusions are drawn:
-
1. Box plot shows the variances of TTWGH and TTWOGH are not equal
-
2. Levene’s test shows p-value is lesser than 0.05. So, the null hypothesis is rejected. It is concluded that two variances are not equal
-
3. 2T test shows the mean values of TTWGH and TTWOGH are 0.43 and 18.2 respectively. It is concluded that TTWGH and TTWOGH are two different groups
-
4. Wilcox test shows that p-value is lesser than 0.05. So null hypothesis is rejected, and it is concluded that TTWGH and TTWOGH are independent
groups.
The conclusion is TTWGH and TTWOGH are having two different mean values like 0.43 and 18.2 respectively. There is a significant reduction in time taken for the generation.
-
2) Analysis of Number of Generations
The values of GWGH and GWOGH and the corresponding mean values are plotted in Figure 7. The values of GWOGH are fluctuating, whereas values of GWGH are almost stable. The mean values show there is a substantial reduction in the number of GA generations to derive the Basis Paths.
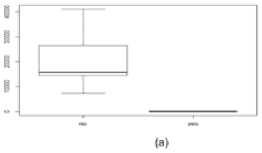
GWGH and GWOGH are analyzed using R Studio as shown in Figure 8. Box plot and Levene’s test are performed to check whether the variants of GWGH and GWOGH are equal. The 2T test is carried out to check GWGH and GWOGH are from two independent groups.
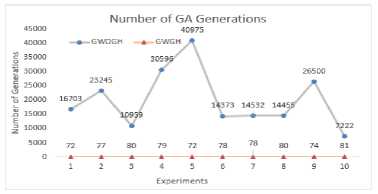
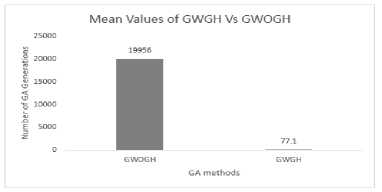
Fig.7. GWGH Vs GWOGH Mean Values.
Levene’s Test for Homogeneity of variance (center ■ median) Of F value Rr(>F)
group 1 9.4526 0.006533 ••
Si^nif. codes: 0 '***’ 0.001 ***’ 0.01 '*’ 0.0$ V 0.1 4 1 1
(bJ welch two swpie t-test wilcoxon rank sue test with continuity correction data: gentowOGb and genSoeGH t • 6.1084. df • 9. Rvalue • 0.0001774 data: gentoOGH and деп$Сабн alternative hypothesis: true difference in weans is not equal to 0 w • 100, p-value ■ 0.0001*96 1"“пя,: alternative hypothesis: true location shift is not equal to 0
sa^le estimates:
■ean of x wean of у
199S6.0 77.1
Fig.8. Number of GA generations analysis (a). Box plot (b). Levene’s test (c). 2T test (d). Wilcox test.
The statistical results are analyzed, and the following conclusions are drawn:
So, the null hypothesis is rejected, and it is concluded that GWGH and GWOGH are two distinct groups.
The conclusion is GWGH and GWOGH are having two different mean values as 77.1 and 19956 respectively. There is a significant reduction in time taken for the generation.
-
3) Analysis of Number of BP Test cases
Research Question 2 (Efficiency) : Any significant reduction in the number of generated test cases is obtained in the case of path explosion?
The values of NOAP and NOBP and their corresponding mean values are plotted as shown in Figure 9. Path explosion is visible in NOAP whereas NOBP is stable. It is evident from mean values that a substantial reduction results in the case NOBP.
NOBP and NOAP are analyzed statistically using R
Studio as shown in Figure 10. Box plot and Levene’s test are performed to check whether the variants of NOBP and NOAP are equal. Wilcox test and Chi-squared test are carried out to check NOBP and NOAP are from two independent groups.
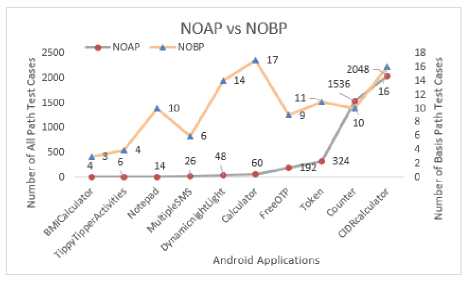
Fig.9. NOAP Vs. NOBP Mean Values.
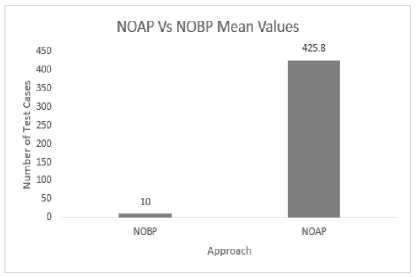
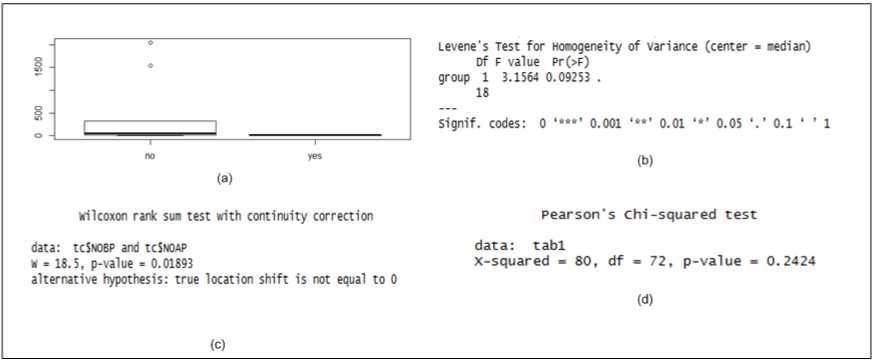
Fig.10. Test case reduction analysis (a). Box plot (b). Levene’s test (c). Wilcox test (d). Chi-squared test.
The statistical results are analyzed and following conclusions are drawn:
-
1. Box plot shows the variants of NOBP and NOAP are equal if two outbound values are removed
-
2. Levene’s test shows p-value is greater than 0.05. So, the null hypothesis is not rejected. It is concluded that two variants are equal if outbound values are removed
-
3. Wilcox test shows that the mean values of NOAP and NOBP are 425.8 and 10.0 respectively. The P-value is less than 0.5. The conclusion is NOBP and NOAP are two different groups.
-
4. The chi-squared test shows that p-value is greater than 0.05. So, the null hypothesis is not rejected, and it is concluded that NOBP and NOAP are independent groups.
The conclusion is NOBP and NOAP are having two different mean values as 10 and 425.8 respectively. There is a significant reduction in the number of test cases.
-
4) Effectiveness of BP Test cases
Research Question 3 (Effectiveness) : Are the generated Basis Path test cases effective?
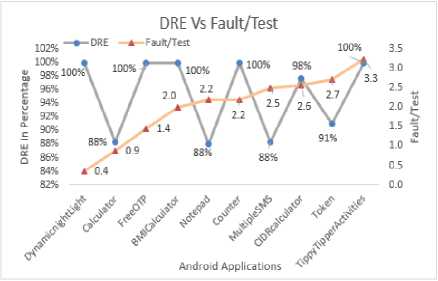
Figure 11 shows code coverage achieved by generated BP test cases varies from 64% to 89% and the average is 74%. The ELOC is ranging from 243 to 11442. The DRE is ranging from 88% to 100%, and the average is 95%. The Fault/Test varies from 0.4 to 3.3. The efficiency of generated tests is measured by Fault/Test. For example, in the case of Fault/Test is 3.3, it means that 3.3 mutants are killed by 1 test case.
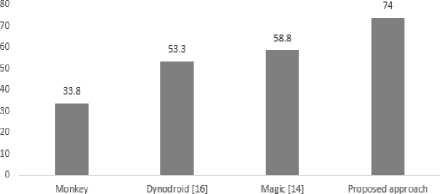
The code coverage achieved by the proposed approach is benchmarked with the other methods available in the literature as shown in Figure 12 (a). It is greater than that of Android monkey, Dynodroid [16] and Magic [14]. The values of Monkey, Dynodroid, and Magic are 33.8%, 53.3%, and 58.8% respectively. The code coverage achieved by Monkey is low because it generates random events to simulate user actions such as touch events. Dynodroid also uses Monkey tool to generate random events and selects appropriate events required for SUT.
Both the tools are not generating effective test cases. Magic is generating test cases systematically. In [14], the constraints are added manually. In the proposed approach, decisions are used in State diagram to add constraints. This approach helps to improve the code coverage.
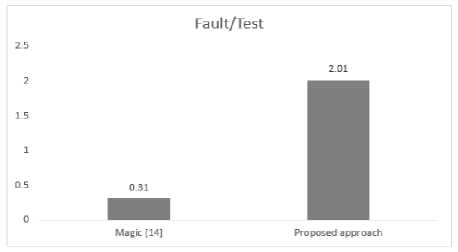
Figure 12 (b) benchmarks Fault/Test factor of the proposed approach with that of Magic [14]. It is found that the proposed approach is capable of finding more defects per test case. Fault/Test factor of the proposed approach is 2.01 whereas that of Magic is 0.31. From these results, it is concluded that the proposed method is effective and the results are satisfactory.
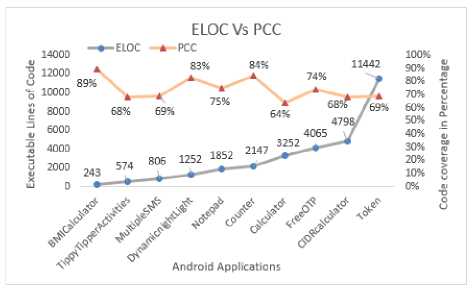
Fig.11. Code coverage and DRE.
Code coverage in percentage
(a)
(b)
Fig.12. (a). Code coverage bench marked (b).Fault/Test bench marked.
-
B. Threats to validity
The different subject program may lead to different experimental results. The proposed approach is expected to work with any native, non-native applications and application with 3rd party libraries. Sometimes menu items are not captured by the MT algorithm. In this case, manually menu item needs to be added to MT database for adding the right argument to the API. The subject may crash in a particular scenario. The generated test case may not handle this situation and may lead to stopping the execution. In this case, it may not allow performing both the code coverage analysis and the mutation analysis. The Jester tool is running only if all the test cases are passing. If subject under evaluation has inherent hang or crash, it may affect the validation of this approach. The next biggest threat is Papyrus tool. It frequently crashes while saving the SCD. This leads to unwanted transitions added in XMI file. Because of this, the test case generation logic may not work properly. It is better to remove these unwanted transitions to have better and faster generations. Another issue is the Jester configuration. The mutant operators are selected based on the Intent payload, Intent target, on click events, button widget, edit text widget, etc. If the mutant operator is not properly selected, the mutant may not be killed which may affect the DRE.
-
VII. Comparison with Other Methods
The proposed approach is compared with other methods. Table 4 shows the comparison of the proposed approach with other methods concerning different parameters. The input UML diagram, test case generation, test script generation, code coverage, mutation analysis, test case optimization, menu tree usage, Evolutionary algorithm usage are the parameters that are compared.
In [14], the State diagram is used for test generation and script generation. The test cases are optimized using the combinatorial technique, both the code coverage and the mutation analysis are performed to evaluate the effectiveness of the generated test cases. The proposed approach exhibits better results compared with [14]. The main drawback of [14] is menu tree is not used for the menu item identification. Also, API identification needs a manually created XML mapping file.
In [15], the source code is directly used to generate test sequences. Test cases are generated by GA, and Robotium scripts are generated. Code coverage is excellent, but mutation analysis is not done. The main drawback of this method is that it is not generating test cases for Android applications that are having native code and libraries.
In [16], a method called “observe-select-execute” is used to find test sequences. But there is no concrete test case or test script. The code coverage is not good, and mutation analysis is not performed.
Table 4. Comparison with Other Methods
|
Related works |
Magic |
EvoDroid |
Dynodroid |
Seach Based Test |
ACO based test |
GA based test |
VTE |
|
Parameters |
[14] |
[15] |
[16] |
[4] |
[7] |
[21] |
Current work |
|
UML diagram |
State |
X |
X |
State |
State |
State |
State |
|
Test case generation |
X |
\ |
\ |
||||
|
Test script generation |
Robotium Java |
Robotium Java |
X |
X |
X |
V |
Robotium-Java |
|
Adopted me±od |
Combinatorial |
Segmented |
Observe-Select- |
GA based test |
ACO based test |
GA based test |
Evolutionary |
|
testing method |
Testing |
Execute Event |
generation |
sequence generation |
generation |
Method |
|
|
Tvpe of testing |
Black box |
white box |
Blackbox |
Blackbox |
Blackbox |
Blackbox |
Blackbox |
|
EA Usage |
V |
\' |
X |
V |
^ |
V |
\' |
|
GA Optimization |
X |
X |
X |
V |
X |
V |
\' |
|
Menu tree Usage |
X |
X |
X |
X |
X |
X |
V |
|
Code Coverage Technique |
V |
EMMA |
EMMA |
X |
X |
X |
EMMA/JACOCO |
|
Average Code Coverage |
58% |
80% |
55% |
X |
X |
X |
74% |
|
Mutation Analysis |
V |
X |
X |
X |
X |
X |
V |
|
FaultTest |
V |
X |
X |
X |
X |
X |
|
|
Test case Optimization |
V |
X |
X |
X |
V |
X |
V |
Android monkey randomly generates events and try to do monkey test. It may not traverse through all menu trees. The number of events required to traverse a path is not predictable. Test coverage is not guaranteed and the code coverage is very low.
In [4], GA is used to find test sequence, but scripts are not generated. Statistical analysis is performed to prove that number of numerical equal operators in conditions plays a very important role in test generation efficiency. The code coverage and the mutation analysis are not carried out to find the effectiveness of the generated test cases.
In [7], Ant Colony Optimization is used to generate test sequences. An optimal test sequence is generated with transition coverage. But test scripts are not generated. Test coverage is not ensured.
In [21], the State diagram is used as input to generate test cases using a GA. JUnit based test scripts are generated from these test sequences. Only feasible path test cases are generated by eliminating infeasible paths. But the code coverage and the mutation analysis are not performed to find the effectiveness of the generated test cases.
The previous works [23] and [24] are not considering any algorithm performance improvement and the test case optimization. A Sequence diagram is used as input in [23], and Activity diagram is used in [24]. In [23], XML based test cases are generated and wrapped in Android APK. The proposed approach and [23] are using library functions, but [24] is not using the library function. In [24], a recursive algorithm is used to generate test cases whereas in proposed approach GA is used to generate test cases.
-
VIII. Conclusions
In this paper, the path explosion problem that occurs when multiple decisions are present in the same path of the SCD and the proposed solution are discussed. When path explosion happens, the number of all path test cases is large, and it is not practical to use these test cases. In this paper, a method is discussed generating Basis Path (BP) test cases from SCD which are reduced in number, still retaining the test coverage. An SCD is created to represent test scenarios, and the XMI file from this SCD is parsed to extract edges, nodes, and labels. Using this information, BP test cases are generated using a Genetic Algorithm (GA) with node coverage as the coverage criteria which is the main contribution of this work. Another contribution is finding a smart mutation to improve the efficiency of the GA to reduce the time taken for each generation. From these BP test cases, corresponding Robotium scripts are generated by identifying the right API names from the user inputs provided in SCD. A Menu Tree (MT) database is generated from target Android device which helps to identify the right menu items from the user inputs, even though the user inputs are not accurate concerning menu items. These menu items are used as arguments to the APIs.
After introducing the smart mutation, the time taken by each generation of GA is reduced to an average of 430 milliseconds with the Genetic History (GH) compared to an average of 18 seconds without GH. The generated scripts are evaluated by executing the scripts on the target Android mobile phone. There are 10 Android applications identified for experimentation with varying number of Lines Of Code (LOC) from 243 to 11442. The corresponding all path test cases for these applications vary from 4 to 2048 whereas the reduced BP test cases vary from 3 to 17. There is a significant reduction in the test case number by an average of 70%. The GA performance is measured which is varying from 6 to 37 seconds to find a BP test case. The MT efficiency is varying from 64% to 100% with an average of 91%. The experimental results show that the average code coverage is 74% and the average Defect Removal Efficiency (DRE) is 95%. This result shows the proposed approach is effective and satisfactory.
In future, this work will be extended to explore more Artificial Intelligence (AI) methods to generate test data. This approach will ensure more test coverage with improved DRE in a cost-effective manner.
References Basis path based test suite minimization using genetic algorithm
- Anirban Basu, Software Quality Assurance, Testing and Metrics, PHI Learning, 2015.
- Goldberg, D.E, Genetic Algorithms: in search, optimization and machine learning, Addison Wesley, M.A, 1989.
- Ruilian Zhao, Zheng Li, and Qian Wang. “Test Generation for Programs with Binary Tree Structure as Input”, International Journal of Software Engineering and Knowledge Engineering, vol. 25, no. 07, pp. 1129-1151, 2015.
- Ruilian Zhao, Mark Harman and Zheng Li. Empirical Study on the Efficiency of Search Based Test Generation for EFSM Models, in the proceedings of Third International Conference on Software Testing, Verification and Validation, 2010.
- Zheng Li, Mark Harman, and Robert M. Hierons. Search Algorithms for Regression Test Case Prioritization, IEEE Transactions On Software Engineering, vol. 33, no. 4, April 2007.
- P.R., Srivastava and Tai-hoon Kim, “Application of genetic algorithm in software testing” International Journal of Software Engineering and its Applications, vol. 3, no. 4, pp.87-96, 2009.
- P.R., Srivastava and Baby, “Automatic test sequence generation for state transition testing via ant colony optimization”, in: M. Chis, (Ed.), Evolutionary Computation and Optimization Algorithms in Software Engineering: Applications and Techniques, pp. 161–183, 2010.
- P.R., Srivastava, B. Mallikarjun, Xin-She Yang. “Optimal test sequence generation using firefly algorithm”, Elsevier, Swarm and Evolutionary Computation vol.8, pp44–53, 2013.
- P.R., Srivastava, Ashish Kumar Singh, Hemraj Kumhar, Mohit Jain. “Optimal Test Sequence Generation in State Based Testing Using Cuckoo Search”, International Journal of Applied Evolutionary Computation, 3(3), 17-32, July-September 2012.
- Pei Gong, Ruilian Zhao, Zheng Li. “Faster Mutation-based Fault Localization With A Novel Mutation Execution Strategy”, in the proceedings of IEEE Eighth International Conference on Software Testing, Verification and Validation Workshops (ICSTW), pp 1-10, 2015.
- R. Lefticaru and F. Ipate. “Automatic State-Based Test Generation Using Genetic Algorithm”, in Ninth International Symposium on Symbolic and Numeric Algorithm for Scientific Computing, pp 188–195, 2008.
- Ernesto C. B. de Matos, Anamaria M. Moreira and João B. de Souza Neto, “An empirical study of test generation with BETA”, in Springer Journal of the Brazilian Computer Society, vol. 22, no. 8, 2016.
- Premal B. Nirpal and K. V. Kale. Using Genetic Algorithm for Automated Efficient Software Test Case Generation for Path Testing, in International Journal of Advanced Networking and Applications Vol. 02, No. 06, pp. 911-915, 2011.
- C. D. Nguyen, A. Marchetto, and P. Tonella. "Combining model-based and combinatorial testing for effective test case generation", in Proceedings of the 2012 International Symposium on Software Testing and Analysis (ISSTA), pp. 100-110, 2012.
- R. Mahmood, N. Mirzaei, and S. Malek. "EvoDroid: segmented evolutionary testing of Android apps", In Proceedings of the 22nd ACM SIGSOFT International Symposium on Foundations of Software Engineering (FSE), pp. 599-609, 2014.
- A. Machiry, R. Tahiliani, and M. Naik. Dynodroid: An input generation system for android apps. In Proceedings of the 2013 9th Joint Meeting on Foundations of Software Engineering, ESEC/FSE 2013, pages 224–234, 2013.
- Dan Liu, Xuejun Wang, Jianmin Wang, Automatic Test Case Generation Based On Genetic Algorithm, Journal of Theoretical and Applied Information Technology, Vol. 48 No.1 , 2013.
- P. Samuel R. Mall A.K. Bothra, "Automatic test case generation using unified modeling language (UML) state diagrams", The Institution of Engineering and Technology, 2008.
- Ranjita Swain, Vikas Panthi and Durga Prasad Mohapatra, "Automatic Test case Generation From UML State Chart Diagram", International Journal of Computer Applications, vol. 42, no. 7, March 2012.
- Santosh Kumar Swain, Durga Prasad Mohapatra, Rajib Mall, “Test Case Generation Based on State and Activity Models”, In Journal of Object Technology, vol. 9, no. 5, pp. 1-27, 2010.
- M. Shirole, A. Suthar, and R. Kumar, "Generation of Improved Test Cases from UML State Diagram Using Genetic Algorithm," in Proceedings of the 4th India Software Engineering Conference, pp. 125-134, 2011.
- Anbunathan R and Anirban Basu. "Auto Test Generation from UML Use Case State Chart Diagrams", International Journal of Advanced Research in Computer Science and Software Engineering, Vol. 6, No.1, pp. 169-190, January 2016.
- Anbunathan R and Anirban Basu. "Automatic Test Generation from UML Sequence Diagrams for Android Mobiles", International Journal of Applied Engineering Research, Vol. 11, No.7, pp. 4961-4979, 2016.
- Anbunathan R and Anirban Basu. "Executable Test Generation from UML Activity Diagram Using Genetic Algorithm", International Journal of Computer Science and Information Technology & Security, Vol.7, No.3, May-June 2017.
- Anbunathan R and Anirban Basu. "Dataflow test case generation from UML Class Diagrams", IEEE International Conference on Computational Intelligence and Computing Research (ICCIC), pp 134-142, 2013.
- Rajesh Ku. Sahoo, Santosh Kumar Nanda, Durga Prasad Mohapatra, Manas Ranjan Patra,"Model Driven Test Case Optimization of UML Combinational Diagrams Using Hybrid Bee Colony Algorithm", International Journal of Intelligent Systems and Applications(IJISA), Vol.9, No.6, pp.43-54, 2017.
