Big Data Analytics Maturity Model for SMEs

Author: Matthew Willetts, Anthony S. Atkins
Journal: International Journal of Information Technology and Computer Science @ijitcs
Article in issue: 2 Vol. 16, 2024.
Free access
Small and medium-sized enterprises (SMEs) are the backbone of the global economy, constituting 90% of all businesses. Despite being widely adopted by large businesses who have reported numerous benefits including increased profitability and increased efficiency and a survey in 2017 of 50 Fortune 1000 and leading firms’ executives indicated that 48.4% of respondents confirmed they are achieving measurable results from their Big Data investments, with 80.7% confirming that they have generated business. Big Data Analytics is adopted by only 10% of SMEs. The paper outlines a review of Big Data Maturity Models and discusses their positive features and limitations. Previous research has analysed the barriers to adoption of Big Data Analytics in SMEs and a scoring tool has been developed to help SMEs adopt Big Data Analytics. The paper demonstrates that the scoring tool could be translated and compared to a Maturity Model to provide a visual representation of Big Data Analytics maturity and help SMEs to understand where they are on the journey. The paper outlines a case study to show a comparison to provide intuitive visual model to assist top management to improve their competitive advantage.
Big Data Analytics, Maturity Model, SMEs, Scoring Tool
Short address: https://sciup.org/15019382
IDR: 15019382 | DOI: 10.5815/ijitcs.2024.02.01
Text of the scientific article Big Data Analytics Maturity Model for SMEs
NewVantage Partners [1] reported in their 2017 survey of 50 Fortune 1000 and leading firms executives, 48.4% of respondents confirmed they are achieving measurable results from their Big Data investments, with 80.7% confirming that they have generated business benefits. This confirms that as Big Data technology has matured and companies have gained knowledge and skills, the benefits are now being realised. The 2019 NewVantage Partners [2] survey confirmed that 91.6% of leading companies are increasing the pace of their Big Data and AI investments declaring a number of reasons with 75% stating that their motivation is the fear of disruption from data-driven digital competitors and 91.7% believing the investment is required to transform into agile and competitive businesses.
SMEs are the backbone of the global economy, consisting 90% of all businesses worldwide [3], however Big Data Analytics adoption by small and medium-sized enterprises (SMEs) is much lower than large companies with only 10% of SMEs having adopted the technology [4, 5] despite the benefits which can be achieved by SMEs such as the reduction in the product development lifecycle by over 7 months and reduced cost of product development by 90% [6]. Benefits reported by large companies include customer demand forecasting, supplier defect tracking, improved, product/data quality, dynamic pricing, fraud detection, improved stock control, predictive maintenance, improved vehicle routing, increased efficiency, increased customer satisfaction and improved profitability. Previous researched has identified numerous barriers to SMEs adoption of Big Data Analytics including financial barriers, lack of top management support, lack of business cases and cultural barriers [7, 8]. To assist SMEs in adopting Big Data Analytics, a framework has been developed and a scoring tool to help SMEs identify their current level of Big Data Analytics maturity. The paper is structured into sections commencing with section 2 which defines Big Data, Big Data Analytics, and its limited adoption by SMEs. In section 3 Big Data Maturity Models are explained and includes a review of existing Big Data and Big Data Analytics Maturity Models. The section further outlines the positive features and limitations of the existing Maturity Models to produce the proposed Big Data Analytics Maturity Model for SMEs. In section 4 the Maturity Model is applied to a case study to show how a new Big Data Analytics Maturity Model for
SMEs (BDAMM-SMEs) can be compared to previous positioning study using a scoring tool developed to support top management, in adoption of Big Data Analytics. Section 5 provides a discussion of maturity models to provide a visual output and complimenting the scoring tool analysis of maturity. This can then be quantified using a Balanced Scorecard or Benchmark approach [4]. A conclusion is outlined and recommends areas for future work are incorporated into the final section.
2. Background 2.1. Big Data and Big Data Analytics
Big Data is defined as ‘an umbrella term used to describe a wide range of technologies that capture, store, transform and analyse complex data sets which can be of a high volume, generated at a high velocity in a variety of formats’ [4]. Volume, velocity and variety are known as the three Vs of Big Data, which have been extended with additional Vs including Value and Veracity, with the number of Vs utilised by different publications currently reaches 51 [4]. Prominent drivers of Big Data are IoT (Internet of Things) and smart devices which include smartphones which are comprised of numerous digital sensors such as camera, audio recorders and GPS locators which all produce Big Data [5, 9]. Three categories of Big Data are: machine-generated data produced by sources such as computer networks, satellites, sensors and streaming data; human-generated data which includes identification data and social media content; and business-generated data in the form of transactional, corporate and government agencies’ data [10]. Big Data consists of data stored in structured, unstructured and semi-structured formats [11].
Big Data Analytics is the process of extracting insights from Big Data utilising a variety of software tools and techniques which is not achievable using Business Intelligence (BI) software because it cannot analyse unstructured data or the large volumes of Big Data. A widely utilised definition of Big Data Analytics is: ‘a new generation of technologies and architectures, designed to economically extract value from very large volumes of a wide variety of data, by enabling high velocity capture, discovery and/or analysis’ [12]. Big Data Analytics is viewed as an important asset to businesses who have adopted the technology as it providers decision makers with timely insights which help them to increase their revenue [13]. Sivarajah et al. [14] describe five categories of Big Data Analytics: descriptive analytics, inquisitive analytics, predictive analytics, prescriptive analytics and pre-emptive analytics. Other categories of Big Data Analytics include text analytics, sentiment analysis, audio analytics, video analytics and social media analytics [11]. Large companies have reported numerous benefits of adopting Big Data Analytics including customer demand forecasting, supplier defect tracking, digital decision analysis model [15], faster and cheaper development of products [6], dynamic pricing, fraud detection and improved stock control [16]. However, only one in 10 SMEs have adopted this technology [4, 5].
-
2.2. SMEs
A small and medium-sized enterprise (SME) is typically classified as a business with less than 250 employees [17]. SMEs comprise 99% of all businesses (6 million) and employ 61% of the country’s workforce, generating over half of the turnover of the UK’s private sector (£2.1 trillion) [18]. SMEs consist of 90% of all businesses worldwide [3]. It is reported that SMEs represent 99% of businesses in the USA [19] and the EU [20]. The number of SMEs in the UK peaked at almost 6 million at the start of 2020 prior to the Covid-19 pandemic and fell in the two subsequent years to 5.4 million [21]. However, the number of SMEs in the UK increased to 5.5 million in 2023, suggesting that the economic outlook is improving due to the generation of more businesses.
-
2.3. Maturity Models
Maturity Models have been proposed for information-driven SMEs’ [22] and SMEs’ readiness for implementing Industry 4.0 [23]. There are several existing Maturity Models for Big Data adoption including Radcliffe’s Big Data Maturity Model [24] Halper and Krishnan's [25] TDWI Big Data Maturity Model and Comuzzi and Patel's [26] Big Data Maturity Model but these are not specifically for SMEs. To the best of the researcher’s knowledge, no existing Big Data Analytics adoption Maturity Models have been developed for SMEs. Therefore, the development of a Big Data Analytics Maturity Model for UK SMEs would be a new contribution to knowledge. As most Maturity Models have one to five levels and the scoring tool developed produces a score between one and five, the Maturity Model approach could compliment the scoring tool.
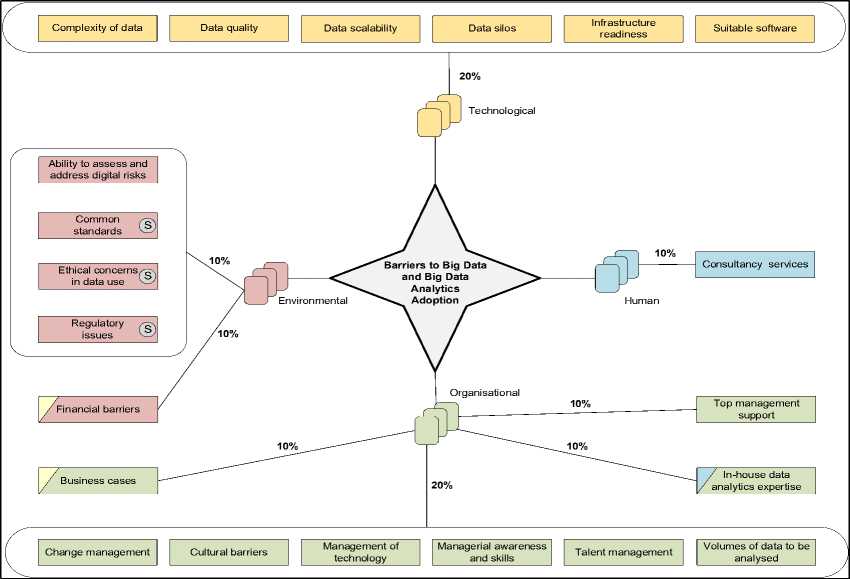
Previous research undertaken identified 69 barriers to SMEs adoption to Big Data Analytics from an extensive literature review which were then rationalised to a refined list of 21 barriers [4] utilising Braun and Clark’s thematic analysis [27]. The barriers identified include shortage of consultancy services, financial barriers, talent management, lack of top management support, regulatory issues, change management, cultural barriers, insufficient volumes of data to be analysed and lack of in-house data analytics expertise [5, 7, 8, 28–34]. The 21 barriers identified were utilised to develop the Holistic Big Data Analytics Framework for UK SMEs (HBDAF-UKSMEs) to help SMEs in the adoption of Big Data Analytics by identifying their current limitations to allow them to overcome these issues. The first version of the framework was based on the thematic analysis of the literature and the 21 barriers were themed into five pillars based on theoretical frameworks: Business, Environmental, Human, Organisational and Technological. The barriers were validated quantitatively through the statistical analysis of an online questionnaire which was completed by 102
SMEs using Cronbach’s alpha and Associations and qualitatively through focus group interviews with 8 SME practitioners which allowed richer feedback to be acquired. The final version of the framework which was developed and updated based on the three iterations of a literature review, quantitative and qualitative analysis which resulted in the barriers associated with the Business pillar being reallocated to the other pillars (Environmental, Human, Organisational and Technological). This resulted in 4 pillars with 21 barriers which have been discussed in detail in previous work [4]. A scoring tool was developed based on the final version of the framework to allow business to calculate their data analytics maturity, presenting the user with a score between 1 and 5 [4]. The scoring tool has been applied to two UK SMEs and both companies were able to demonstrate measurable benefits of adopting Big Data Analytics including increasing their customer base, improving the profitability of their operations and reducing their operating costs, in addition to identify where further improvements could be made [4]. It was proposed that the output of the tool could be translated to quantifiable performance measures including the balanced scorecard and benchmarking [4]. It was proposed that the output from the scoring tool could translate into a Maturity Model. Fig. 1 shows the HBDAF-UKSMEs framework with the weightings at the top of the figure and a screenshot of the scoring tool is shown at the bottom. Each of the 21 barriers were translated into factors for the purposes of developing a scoring tool. The scoring tool provides an explanation of each factor for which the user enters a score between 1 and 5. The scores are multiplied by the appropriate weighting from the framework and totalled to provide an overall score between 1 and 5.
One of the SME representatives who were interviewed to qualitatively evaluate the HBDAF-UKSMEs suggested ‘it would be useful for thresholds to be set for different levels of analytics maturity’ . It was suggested that the score produced by the scoring tool could relate to a stage on a Maturity Model. Maturity Models allow an organisation to evaluate the effectiveness of their current processes in a particular discipline by performing an assessment using the criteria outlined in the model [35]. In a Maturity Model, the score for each criterion used in the assessment will result in the organisation being matched to a maturity level or stage for the purpose of identifying their current capability for benchmarking purposes, determine which maturity stage they want to get to and understand what they need to do to reach the stage, using the guidance or description provided in the model.
The scoring tool below calculates the Big Data Analytics readiness score by asking the user to provide a score between 1 and 5 for each of the 21 questions. The weightings from framework are multiplied against the score, then the weights scored as totalled to give an overall Big Data Analytics readiness score between 1 and 5.
|
Factor |
Question |
Weighting |
Response |
|
Ability to assess and address diqital nsks |
My business can identify and appropriately address security threats which may arise through utilising Big Data Analytics, for example hacking to acquire data stored including individual's personal information, malware and denial-of-service-attacks |
250% |
|
|
Common standards |
The lack of standardised interfaces and data integration standards does not affect my business when transferring data or integrating data sources into the Big Data Analytics solution |
2.50% |
|
|
Ethical concerns in data use |
My business is prepared to handle the ethical challenges associated with utilising Big Data Analytics to make decisions, for example using predictive or prescriptive analytics to automate decision making |
2.50% |
|
|
Regulatory issues |
My business has the capability to resolve the legal, security and pnvacy concerns of storing and processing data which includes legislation such as the General Data Protection Regulation (GDPR). |
250% |
|
|
Financial barriers |
My business is prepared to investment to maximise the benefits of Big Data Analytics including software and hardware including SaaS and cloud solutions training for staff and hiring new staff when required |
10.00% |
|
|
Consultancy services |
My organisation utilises consultants to fill technological knowledge gaps where appropriate, for example when adopting new software or hardware |
10.00% |
|
|
Change management |
My business has the ability to adapt to change quickly and without resistance when adopting new technology |
3.33% |
|
|
Cultural barriers |
The culture of my business supports the utilisation of technologies and data driven decision making |
333% |
|
|
Management of technology |
My business has the capability to manage the technology required to implement Big Data Analytics including software and hardware |
333% |
|
|
Managerial awareness and skills |
My business' management understand what Big Data Analytics is and how it can benefit the business. |
3.33% |
|
|
Talent management |
My business has the ability to manage the technical staff required to manage and maintain the Big Data Analytics solution |
333% |
|
|
Volumes of data to be analysed |
My business captures enough data to analyse utilising Big Data Analytics |
333% |
|
|
Business cases |
My business knows where to find case studies of businesses in our sector adopting Big Data Analytics |
10.00% |
|
|
In-house data analytics expertise |
My business has the required technical personnel to implement Big Data Analytics and utilise the technology for example interroqatmq data and manipulating data to display in meaningful formats for decision makers |
10.00% |
|
|
Top management support |
My business' top management support the adoption of Big Data Analytics and are prepared to provide the necessary resources including finance, time and personnel to ensure that it is successful in achieving the expected benefits |
10.00% |
|
|
Complexity of data |
My business has the capability to manage complex datasets comprised of structured and unstructured data |
3 33% |
|
|
Data quality |
The integrity of the data captured processed and analysed by the business is good for example it is up-to-date, in the appropnate format and there is no duplication |
333% |
|
|
Data scalability |
My business has the capability to manage large volumes of data which can rapidly grow in size. |
3.33% |
|
|
Data silos |
My business has the capability to manage and integrate isolated datasets, for example the databases of systems utilised by one department of the business |
3.33% |
|
|
Infrastructure readiness |
My business' IT infrastructure (cloud or on-premise) is capable of supporting the Big Data Analytics solution |
333% |
|
|
Suitable software |
The Big Data Analytics software solutions available meet the requirements of my business |
3.33% |
Score
Fig.1. Holistic big data analytics framework for uk SMEs and scoring tool
3. Big Data Maturity Models 3.1. Maturity Models
Maturity models allow an organisation to evaluate the effectiveness of their current processes in a particular discipline by performing an assessment using the criteria outlined in the model [35]. In a Maturity Model, the score for each criterion used in the assessment will result in the organisation being matched to a maturity level or stage for the purpose of identifying their current capability for benchmarking purposes. This would allow the determination of the maturity stage they want to get to and to be able to understand what they need to do to reach the stage, using the guidance or description provided in the model. Maturity in this context is defined as: ‘an expression of the extent to which an organization consistently implements processes within a defined scope that contributes to the achievement of its business goals (current or projected)’ [36].
Typically, the models outline a set of maturity levels; the higher the maturity level, the more efficiently the organisation will be operating [37]. The initial level will represent an organisation which has the least capabilities in the identified discipline, whereas the final level demonstrates complete maturity. The levels above can be used as a target to aim towards but to reach these, the organisation will need to use the assessment criteria to make improvements in the required areas. Klimko [38] states that: ‘Maturity Models describe the development of an entity over time. This can be anything of interest: a human being, an organisational functional etc’. The concept of a Maturity Model is flexible as Maturity Models can be tailored to many domains, one reason why this approach is widely used. Wendler [39] illustrated the popularity of Maturity Models in subsequent years as they have been developed for over twenty domains, including IT, project management, risk management and healthcare, with the majority of the literature in the software development domain.
Caralli and Montgomery [40] state four advantages of using Maturity Models:
-
• Benchmark internal performance – using a standard measurement approach allows an organisation to identify their current status on their path to improvement and set goals for future investments or further enhancing performance.
-
• Catalyse performance improvement – the model can be used as a basis for continuous performance improvement.
-
• Catalyse improvements in community performance – performance can be compared between organisations and determine a “community” performance profile.
-
• Create and evolve a common language – a common language allows domains of knowledge to produce repeatable, consistent, and predictable performance.
Despite the advantages identified, Maturity Models are linear, and it is assumed that the user will want to reach the highest maturity level. This may not be true for some organisations in some contexts. Maturity models can be very expensive and require dedicated resources to implement, particularly for the adoption of a technology, and therefore unfeasible for smaller organisations.
Maturity Models are usually split into three categories [37, 41, 42]:
-
• Descriptive – describes the current capabilities based on a specific set of criteria. This category of Maturity Model is used as a diagnostic tool for an organisation to determine their current level.
-
• Prescriptive – identifies desirable levels of maturity and provides guidance of how the organisation can improve to reach the higher maturity levels.
-
• Comparative – allows an organisation to identify its current maturity level for the purposes of internal and external benchmarking.
Although Maturity Models have been in use for many decades in a diverse range of disciplines, there appears to be no agreed seminal model in the literature. Several of the following models or theories identified are not labelled as Maturity Models by their authors, however by comparing them to established Maturity Models such as the Capability Maturity Model [43], it appears that methodology was developed much earlier than for software development in the 1990s. Many of these models are widely cited today, so therefore they must be useful, therefore these were researched to determine why they are successful. Klimko [38] suggests that Maslow's [44] Hierarchy of Needs is the seminal example of the Maturity Model approach. This is a motivational theory whereby Maslow states that there is a hierarchy of five human needs, beginning with psychological needs and ending with self-actualization. Like a Maturity Model, the theory outlines that there is no motivation for higher needs unless the needs on the levels below have been fulfilled. Needs cannot be skipped; they must be met in sequential order. Whilst this is not a traditional Maturity Model, the sequential approach is very similar.
Crosby's [45] Quality Management Maturity Grid (QMMG) appears to be the seminal Maturity Model. The tool allows an organisation to benchmark the maturity of their internal processes and is presented in a five by six grid. Five maturity levels are described: Uncertainty, Awakening, Enlightenment, Wisdom, and Certainty, which are split into six measurement categories. This is a self-assessment tool as a number of statements are provided and the user must match themselves to the statements which best-fit their organisation’s current operations. The advantages of using the QMMG are that it is quick and simple to use, allowing an organisation to quickly evaluate their current maturity level and identify where they need to improve to reach the higher maturity levels. It is suggested that no training is required as the model is self-explanatory [45].
Arguably one of the most prominent of the early Maturity Models is the Capability Maturity Model (CMM) [43] which allows a software developer to evaluate their existing practices and use the guidance outlined in the model to advance to higher maturity levels. The Capability Maturity Model was heavily influenced by the QMMG and it is also a five-stage model. Although this can be considered a descriptive model, it is simple yet comprehensive enough to establish where the organisation currently is and what they need to do to move to the next level. The success of this model led to this approach being adapted for other industries. The Capability Maturity Model is shown in Fig. 2.
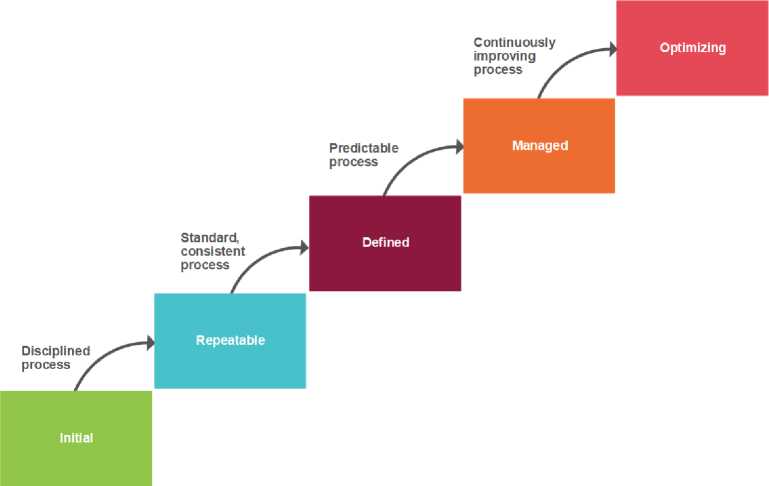
Fig.2. Capability maturity model (CMM) modified by author [43]
The CMM was retired in 1997, despite version 2 being in development [46]. This does not prevent the model from being utilised as the literature is still present, but it will not be updated for future technological advancements or improvements which illustrates one of the issues with Maturity Model approaches as if the model is abandoned by its developer, they can quickly become outdated and therefore no longer useful. This indicates that Maturity Models may need to be futureproofed or be developed to allow another researcher to update it when required. Several related Maturity Models were developed after the CMM and therefore the Software Engineering Institute decided to merge these into one framework. The Capability Maturity Model Integration (CMMI) combined three models: EIA/IS-731 (Systems Engineering Capability Model), Software CMM v2C and the Integrated Product Development CMM v0.98 [47-48]. The integration assisted organisations in simplifying their process improvement by reducing the number of models they needed to use to increase efficiency [40]. The current version of CMMI is version 2.0 and is actively supported [48].
Luftman [49] developed the Strategic Alignment Model which adapts the Capability Maturity Model for IT-Business alignment. The model’s purpose is to increase the relationship between the IT department and the rest of the business, which will lead to improved productivity and efficiency. There are five maturity levels: Initial Process, Committed Process, Established Process, Improved Process and Optimised Process. The model consists of six alignment areas: Communication, Competency/Value Measurements, Governance, Partnership, Scope and Architecture and Skills. Each alignment area has multiple attributes and its own maturity level. The six maturity levels are used to calculate the overall maturity level. The Strategic Alignment Model incorporates a wide variety of factors. Although it does not provide prescriptive guidance, the descriptions provided in the literature are useful in guiding an organisation in the direction of achieving a higher maturity level. The complexity of the factors that are comprised within the Strategic Alignment Model demonstrates that this approach could be utilised for the adoption of Business Intelligence and Big Data technologies because there are numerous factors involved including infrastructure, governance, skills and change management which are all included in the Strategic Alignment Model.
As new technologies have emerged, Maturity Models have been developed for their adoption, including Business Intelligence [50] and Data Warehousing [51]. Several Big Data Maturity Models have been developed since 2013. However, as Big Data technologies have evolved, the models have also evolved, reflecting the changes in technology. For example, the seminal Big Data Maturity Model, The Data Warehouse Institute’s (TDWI) Big Data Maturity Model [25], does not discuss the concept of Data Lakes, whereas a later model which is very similar in presentation, Hortonworks Big Data Maturity Model [52], recommends implementing a Data Lake. This demonstrates that Maturity Models have remained a relevant methodology for providing organisations with a tool for measuring their capability and providing them with a map, regardless of the discipline, in particular technology. It also shows that Maturity Models need to evolve and cannot be tied to a particular technology, otherwise they will not remain relevant.
-
3.2. Comparison of Existing Maturity Models
To determine whether any of the existing Maturity Models were suitable to apply the output of the scoring tool, a comparison of existing Big Data Maturity Models was undertaken. Existing Big Data Maturity Model models which are freely available have been included in this research, as it may be possible for SMEs to adopt an existing model. Business Intelligence and Data warehousing are related technologies, which were conceived prior to Big Data. Several Maturity Models exist for these technologies. Whilst searching for Big Data Maturity Models, it was discovered that prior to The Data Warehouse Institute’s Big Data Maturity Model [25], TDWI had developed Maturity Models for data warehouses [51] and BI [53]. Therefore, these models have been included to support an examination of the issues presented by the evolution of Maturity Models in response to technological advancements. Table 1 shows the Maturity Models identified. Data warehousing models are highlighted in ‘ green ’, Business Intelligence in ‘ yellow ’ and Big Data in ‘ blue ’.
The Business Intelligence and Date Warehouse Maturity Models do not appear to be suitable for implementing Big Data and Big Data Analytics because they are technology dependent models, specifically for Business Intelligence or Data Warehouse technology respectively. One of the aims of the investigation was to determine whether, given that Big Data is an analytics technology like Business Intelligence and Data Warehousing, an existing framework for a similar technology would support the use of Big Data Analytics. However, the scope of Big Data is far greater than the scope of Data Warehousing. Data Warehousing may be part of the Big Data solution and Business Intelligence primarily supports the organisation’s decision making, whereas Big Data may have a wider impact on the organisation’s operations [26]. Additionally, both non-Big Data models originate from TDWI, who also developed the TDWI Big Data Maturity Model. For this reason, it was decided to investigate the evolution of their models.
The Data Warehouse Maturity Model shows a logical path moving from a business relying on spreadsheets and desktop databases to moving to Data Warehouses with advanced reporting. Although the model is outdated due to the changing technology landscape, it demonstrates that a Maturity Model can fit analytics technology adoption. The model provides simple guidance which allows an individual to assess their organisations’ maturity level and identify which technology they should adopt and how. Big Data Analytics is a much more complex data management technology, therefore there are more elements which need to be considered and hence more guidance is required. The CPBDMM, whilst being a comparative model, encompasses a wider variety of factors including strategic alignment, governance, IT management and infrastructure, data analytics, data management, organisational culture, strategy, and processes. The Data Warehouse Maturity Model in comparison characterises stages by a smaller number of characteristics such as scope, analytic structure, funding, technology platform, change management and administration.
Table 1. Comparison of maturity models
|
Model |
Abbreviation |
Type |
Domain |
Origin |
Assessment Type |
Maturity Levels |
Guidance |
Model Presentation |
|
Data Warehouse Maturity Model [51] |
DWMM |
Descriptive |
Data Warehouse and Business Intelligence |
Consultancy Services |
Self |
Six |
No |
Diagram with descriptions |
|
TDWI BI Maturity Model [53] |
TWDI BIMM |
Comparative |
Business Intelligence |
Consultancy Services |
Self – online questionnaire |
Six |
Yes |
Diagram with descriptions |
|
TDWI Big Data Maturity Model [25] |
TDWI BDMM |
Comparative |
Big Data |
Consultancy Services |
Self – online questionnaire |
Five |
Yes |
Diagram with descriptions |
|
Big Data Business Model Maturity Index [54] |
BDBMMI |
Prescriptive |
Big Data |
Consultancy Services |
Self |
Five |
No |
Diagram with descriptions |
|
Big Data & Analytics Maturity Model [55] |
BDAMM |
Descriptive |
Big Data |
Technology vendor |
Self |
Five |
No |
Grid |
|
Strategy& (formerly Booz&) Big Data Maturity Model [56] |
SBDMM |
Prescriptive |
Big Data |
Consultancy Services |
Self |
Four |
No |
Diagram with descriptions |
|
Radcliffe Big Data Maturity Model [24] |
RBDMM |
Prescriptive |
Big Data |
Consultancy Services |
Self |
Six |
No |
Diagram with descriptions |
|
Zakat Big Data Maturity Model [57] |
ZBDMM |
Prescriptive |
Big Data |
Academia |
Self |
Five |
No |
Diagram with descriptions |
|
Big Data Maturity Model [26] |
CPBDMM |
Descriptive |
Big Data |
Academia |
Self |
Six |
No |
Grid |
|
Hortonworks Big Data Maturity Model [52] |
HBDMM |
Comparative |
Big Data |
Technology vendor |
Self – online questionnaire |
Four |
Yes |
Diagram with descriptions |
|
Temporal Big Data Maturity Model [58] |
TBDMM |
Descriptive |
Big Data |
Academia |
Self |
Five |
No |
Grid |
|
Global Big Data Maturity Model [59] |
GBDMM |
Comparative |
Big Data |
Academia |
Self – online questionnaire |
Four |
No |
Diagram and a graphical output |
TDWI’s Data Warehouse Maturity Model’s successor, the TDWI Business Intelligence Maturity Model is very similar as it comprises of the same number of stages and suggests similar technologies. The assessment questionnaire and other supporting literature referenced in other work [60] are no longer available on the web as the model is no longer supported by the TDWI. Therefore the Wayback Machine [61] was used to retrieve an article written by its author [53] describing the model. The first two stages are condensed into one section of the article, “The Early Stages of BI”; therefore, it is not possible to differentiate between the Prenatal and Infant stages. Technologies including spreadmarts, spreadsheets and desktop databases are mentioned as being utilised in the early stages, but it is not clear when they are introduced or decommissioned in favour of more sophisticated technology, in addition to how they are used. Similarly, the Child and Teenager stages are grouped together in a two-paragraph section titled “BI Adolescence”, which include technologies such as ad hoc reporting and OLAP tools but does not state what differentiates these stages. This suggests that maturity stages need to be clearly defined otherwise it may not be possible to use the Maturity Model.
DWMM introduced and TDWIBIMM refined the concepts of the “The Gulf” and “The Chasm” which separate certain maturity stages. They represent the difficult periods between key maturity stages as they will require significant resources and expenditure to achieve in addition to political challenges and other change management issues and organisation may encounter when implementing a disruptive technology. The Gulf is located between the Infant and Child stages and represents the challenges encountered during the early stages of BI adoption projects. These include overambitious project scope, poor data quality, underwhelming reception of the initial BI solution and unclear or changing reporting requirements. The Chasm is situated between the Teenager and Adult stages, and represents the challenges of moving from decentralised, typically departmentalised data warehouses to a centralised data warehouse. The challenges include the political issues of agreeing on the standardisation of data and change management complications. The Gulf and Chasm are useful concepts and could be utilised for a Big Data Analytics framework specifically for SMEs. Since these are difficult periods for a business to overcome, they may be the points where a company stop advancing their Big Data Analytics capability adoption and resume later when their analytical requirements change, or they have the resources available to continue to advance their analytical capabilities.
The Chasm is retained in TDWI’s Big Data Maturity Model which is similar to the previous model but the questionnaire and supporting material are currently still available. More information is provided in the descriptions for each stage but there is inconsistency in the details provided at each stage. The TDWI models show how a model can be reused and amended as technologies evolve but it could be argued that it would have been more appropriate to devise a new model specifically for Big Data and Big Data Analytics instead of adapting a previous model which was designed for a different technology. The original Data Warehouse Maturity Model is easier to follow and gives semi-prescriptive guidance, providing the user with a clear path how to implement Data Warehousing, in comparison to its successors which are more difficult to interpret due to the presentation of the supporting literature.
The Maturity Models have been evaluated based on the following criteria based on Drus and Hassan’s [62] evaluation criteria: assessment, presentation, origin, model type, model purposes, categories, number of stages.
-
A. Assessment
Three of the Maturity Models identified are presented in a grid format similar to the QMMG and the remaining eight are presented as diagrams with accompanying descriptions for each maturity stage. A critical issue with list-based models provided is the lack of useful descriptions for each stage of a maturity level and guidance for progressing to higher maturity levels. For example, TDWI BDMM breaks down each stage into five categories, however for some maturity stages information is not provided for each category. The second stage of the TDWI BDMM, Pre-adoption, is described under five categories: organization, infrastructure, data management, analytics, and governance. In comparison, the final stage, Mature/Visionary, is described under three categories: organisation, infrastructure, and data management (now combined), and analytics. Therefore, it would be more useful if each maturity stage had descriptions for each category as the difference between the previous and the next maturity stage could be clearer.
In the grid-based models, there are a set number of maturity stages and categories. Using BDAMM as an example, it consists of five maturity levels and six categories, resulting in thirty populated spaces on the grid. Each category has an entry for each maturity stage, therefore there is consistency. This suggests that for all models, information needs to be provided consistently throughout. For example, the TDWI BDMM would be more helpful if each maturity stage described the five categories outlined by the model. Similarly, the grid-based models do not have supporting guidance for usage and moving between maturity levels.
Three of the models, TWDI BIMM, TWDI BDMM and HBDMM, utilise an online questionnaire for the assessment process, simplifying a potentially complicated scoring process. The scores are automatically calculated, removing the possibility of a calculation error. Therefore, it is recommended that new models should develop a questionnaire for the assessment process.
-
B. Presentation
The presentation of the models and the associated literature is also a major issue for the commercially developed models as the articles can be very difficult to interpret, especially for readers with minimal knowledge of Big Data and related technologies. Several studies have identified that the majority of SMEs do not currently understand what big data is or how to use it [8, 63] and very few SMEs are using it [64]. The models suggest using specific technologies including Data Lakes (SBDMM and HBDMM), Hadoop and NoSQL (TWDI BDMM) but it is not explained what they are. Therefore, the reader will unlikely know where to start their Big Data journey.
The presentation of the Maturity Models is a major issue. For example, the SBDMM is very difficult to read as there is no structure to the model, aside from the diagram showing the stages and other influences. It would be easier to follow if each stage was described so it is clear to the reader what is required at each stage in terms of infrastructure, change management, analytics, and other factors so the reader can determine what the advantages of reaching the stage.
-
C. Origin
The Maturity Models originating outside of academia do not appear to have been validated by a domain expert. The validation of a model is important because it ensures that the model is theoretically sound [42], gaps are identified and the author can address them or explain why they believe the suggested corrections are not needed, as demonstrated in the development of Comuzzi and Patel's [26] Big Data Maturity Model. De Bruin et al. [42] expand on the importance of validation and state that there are two types of validation: face and content validation. Face validation refers to whether a model can be considered complete and accurate in relation to the scope of the model. Face validation is performed using methods such as focus groups and interviews to verify this. Content validation is used to determine the extent to which a domain has been represented. This is achieved by undertaking an initial literature review and undertaking a test pilot to confirm that the model is theoretically sound. While it is recognised that all the non-academic Big Data Maturity Models have been developed by experts with years of experience in the data analytics field, these models lack both face validation with other experts and content validation based on a literature review and demonstration that the model is theoretically sound.
It is also unclear how the industry models have been developed, only the models developed from academia documented the development process. This is important because it is useful to know which factors or elements have been considered or not so that the scope of the model is clear. If a model is stated as being holistic, it is necessary to provide a supporting definition to show what is understood by holistic in this context. For example, the CPBDMM development involved interviewing domain specialists to identify as many categories as possible, with one participant being a Maturity Model expert, therefore the credibility of this model is higher than those where the development process is unknown.
-
D. Model Type
Due to the potentially complex nature of the implementation of Big Data and Big Data Analytics, a prescriptive model may be more useful than a descriptive model as the user is presented with a predefined action plan that they can use to mature their analytics capabilities. Naskali et al. [65] state that: ‘A prescriptive Maturity Model is useful when it leads to actionable development plans’. They developed a prescriptive Maturity Model for mapping business transformation in SMEs which was tested by 13 business with each test resulting in actionable information being produced which they could use to improve. Each of the tests resulted in useful outcome which indicates a prescriptive model could be a useful approach for SMEs as by using the Maturity Model provides them with the direction how to improve.
Big Data Analytics can require both hardware and software to be acquired and there are many organisational issues which need to be addressed as depending on how it is implemented and the current state of the organisation, the introduction of Big Data Analytics could be a major organisational transformation activity. Many SMEs are unaware of Big Data Analytics; therefore, it may be difficult for them to understand without guidance. For example, BDAMM is a grid-based model which provides no guidance on how to use it, it is unlikely that an SME would understand how to use it without an understanding of Big Data.
Where guidance is provided by the Maturity Models (BDBMMlI, SBDMM, RBDMM and ZBDMM), the guidance lacks consistency or does not provide a sufficient level of guidance for an SME audience. For example, ZBDMM summarises the first two levels in a paragraph each and the subsequent levels in more detail. The RBDMM is presently similarly to ZBDMM whereas the BDBMMI explains each level in more detail but not in enough detail for someone without Big Data knowledge. This can be explained by the fact that the model is aimed at large organisations. The SBDMM presents advice on how to implement Big Data but is not structured like the other prescriptive models, whereby each level is discussed under its own heading. The SBDMM gives examples of companies implementing Big Data but does not separate stages in its discussion or clearly instruct the user how to progress from one maturity level to the next. The descriptive Maturity Models can assist in helping an organisation where they are and can see a description of future maturity levels, but guidance is not provided on how to reach these. The comparative Maturity Models are accompanied with supporting literature which provide advice such as the HBDMM, but the level of detail is not consistent.
Based on the models reviewed, it is concluded that to provide effective support to SMEs, any Big Data Maturity Model must be accompanied by guidance for both undertaking and understanding the assessment but also how to move from one maturity level to the next.
-
E. Model Purposes
The Maturity Models identified can be categorised into three categories:
-
• Adoption
-
• Improvement
-
• Adoption and Improvement
The adoption models entirely focus on implementing Big Data within an organisation. Only one adoption model, ZBDMM, finishes with Big Data being fully implemented within an organisation. The optimisation of the Big Data solution is not mentioned. Whereas other Maturity Models have additional stages following the implementation of Big Data which discuss optimisation such as the RBDMM. Improvement focused models are more suitable for a business which is already using Big Data as they can use the improvement models to refine their Big Data usage. The adoption and improvement models support both the adoption of Big Data as a new technology for an organisation that does not utilise it but also helps with organisations which are using Big Data. However, an SME is likely to need a specific model which focuses on adoption as they are unlikely to be using Big Data.
-
F. Categories
There is also a lack of consistency in the topics covered by each of the Big Data Maturity Models. Comuzzi and Patel [26] identified seven Big Data Maturity models and none of them included all of the topics contained in their Big Data Maturity Model, which they aimed to be the first holistic model. Although security is mentioned within the Data Management subcategory, they acknowledged that future research will be required. Security is an important consideration as failure to keep data secure may result in the company being fined in line with legislation such as GDPR.
Big Data literature frequently mention security as being a requirement [66], a risk [67] or challenge [8].
-
G. Number of Stages
Another consistency issue with the Big Data Maturity Models is the number of stages and the advances made at each stage. The majority of Maturity Models have either five or six maturity levels. It appears that the CMM template of five maturity stages (starting with Initial and ending at Optimising) is adopted by almost all these models, the additional stage added to four of the models is at the beginning. These represent the state before beginning of the Big Data journey, for example the RBDM Model calls this stage “In the Dark” and it describes an organisation having no Big Data awareness. This initial, pre-Big Data stage is useful because it a business can relate to having no big data analytical capabilities and therefore the starting point before, they begin to adopt Big Data Analytics. However, if an SME does not utilise analytics, it may be more appropriate for them to adopt Business Intelligence first.
Not all the models introduce Big Data at the same stage. For example, in five of the Big Data Maturity Models (TDWI BDMM, BDBMMI, RBDMM, CPBDMM, TBDMM), Big Data Analytics is introduced at the third level whereas in ZBDMM it is installed at the final level and the other models are unclear at which stage Big Data Analytics is adopted. This suggests that there is a lack of clarity as to how to implement Big Data as it would be expected that all the Big Data Maturity Models would follow a similar process as they are generic in their scope (apart from ZBDMM). Similarly, some of the Maturity Models such as TBDMM Model and BDBMMI mention technologies such as DWs and BI systems in the early stages whereas other models focus entirely on Big Data Analytics (CPDMM).
BDBMMI goes beyond the scope of the other Maturity Models by demonstrating how a business can use Big Data to change their business model, diversifying into markets such as app platforms. Therefore, this surpasses the “Optimising” stage that the CMM Model would end with. This suggests that an additional stage may be required.
-
H. Limitations
-
3.3. Proposed Maturity Model
All the Maturity Models appear to imply that all organisations should progress to the final maturity stages. Organisations are likely to have different requirements or information needs. An SME for example could be a small company consisting of 10 people to an organisation of over 200 employees, their requirements for analytics are likely to be very different but they both businesses could benefit from using Big Data Analytics in some capacity. The Maturity Models should indicate that it is acceptable for a business to stop or pause at a particular level, therefore each maturity level needs to demonstrate measurable improvements, otherwise there will not be a reason for a business to want to progress to the next level. For example, if a Big Data Analytics Maturity Model has five levels, a company comprised of 10 people may only need to reach the second maturity level to satisfy their analytical requirements whereas a larger SME may want to progress to the fourth stage. Each maturity level of a Big Data Maturity Model should show an advancement in Big Data Analytics capabilities from the previous level. The concepts of “the Gulf” and “the Chasm” explained previously represent the challenging periods between key maturity stages. It may be suitable to stop or pause the Big Data journey, as these are overcoming “the Gulf” or “the Chasm” may require significant investment including time, finances, and human resources. It has been identified that none of the existing Big Data Maturity Models consider that the user may want to stop at a particular maturity stage, therefore the new Big Data Analytics Maturity Model will be developed to facilitate the different analytical requirements of SMEs.
One of the barriers to adopting Big Data Analytics encountered by SMES identified by are the limited financial resources available to them, including constraints on their borrowing. Therefore, they may not be able afford to progress to the last maturity stage until funds become available. This further suggests that a Big Data Analytics Maturity Model aimed at SMEs needs to be able to allow them to pause.
Apart from ZBDMM, all the models discussed are generic and are not aimed at a particular industry or type of organisation. However, all the models appear to be more suited for larger companies with more resources and the technologies recommended may not be feasible for all organisations. For example, the BDBMMI suggests using Big Data to move into new industries, embedding analytics into products and gives examples of building app platforms. HBDMM and the BDBMMI guidance literature [68] recommend implementing a Data Lake, which may not be suitable or feasible for all businesses. These recommendations do not seem realistic for SMEs who may be satisfied with using new sources of information such as Google Analytics since, as Mattera [64] demonstrates, this may be a good starting point for SMEs as many of them are not aware of the free or low cost Big Data tools. Similarly, Big Data Analytics asa-Service (BDAaaS) could be a suitable option for SMEs [69] until it is feasible to procure their own Big Data infrastructure. This suggests that a Big Data Analytics Maturity Model aimed at SMEs should not be over prescriptive as to specific technologies and should recognise that technology will advance or change over time, therefor by focusing on one particular technology may result in the model becoming redundant within a few years. However, a flexible model which allows technologies to be substituted to meet a requirement, may be a more appropriate approach. For example, data storage could be facilitated through a few options such a Data warehouse, a Data Lake, cloud storage, Infrastructure-as-a-Platform (IaaP) or other solutions which may vary depending on the needs of an organisation. Therefore, it may be more appropriate for a business to select which solution would satisfy their requirement whilst being financially viable. The RBDMM and SBDMM do not appear to be supported as the literature is no longer available online. This suggests that over time, the organisations that produce Maturity Models may abandon them as their businesses close or develop other models (TDWI BIMM and TDWI BDMM). Ideally Big Data Maturity Models need to be futureproof or revised overtime to remain relevant. This will be one of the challenges of developing a new
Big Data Analytics Maturity Model, as it cannot be overly prescriptive of specific technologies.
As none of the Maturity Models identified appear to be suitable to be adopted by SMEs or to translate the output of the scoring tool developed to, a new Maturity Model is proposed shown in Fig. 3 named Big Data Analytics Maturity Model for SMEs (BDAMM-SMEs) and five levels of Big Data Analytics maturity are proposed:
• Stage 1 - Ad-Hod Analytics: the business utilises tools with little to no analytics. Spreadsheets may be used to report and interrogate data but there is no Business Intelligence.
• Stage 2 - Initial Adoption of Business Intelligence: the business is utilising Business Intelligence tools such as Microsoft Power BI to analyse its datasets.
• Stage 3 - Established Analytics: the business is applying Business Intelligence to Big Datasets such as social media and sensor data.
• Stage 4 - Maturing Analytics: the business is utilising Big Data Analytics techniques such as sentiment analysis or datamining which would not be possible utilising traditional Business Intelligence software.
• Stage 5 - Optimised Analytics: the business has optimised its use of Big Data Analytics, and it is continually reviewing how it can further improve and monitor advancements in analytics technology.
4. Application
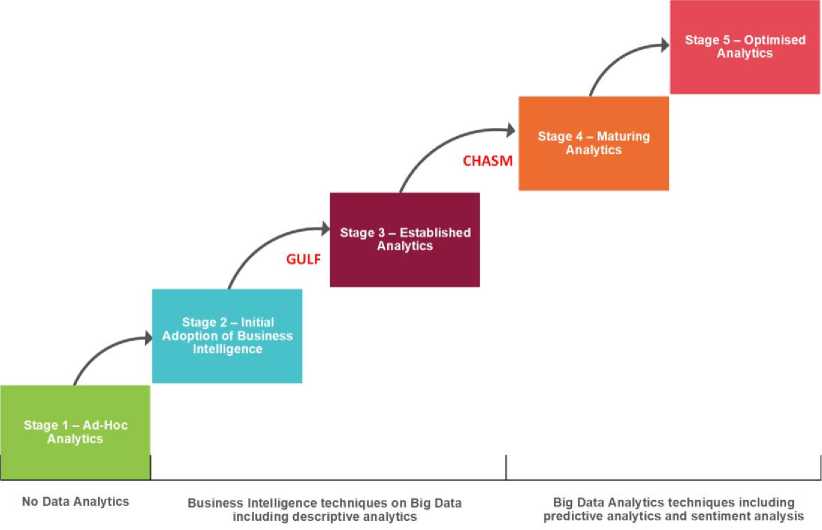
Fig.3. Big data analytics maturity model for SMEs
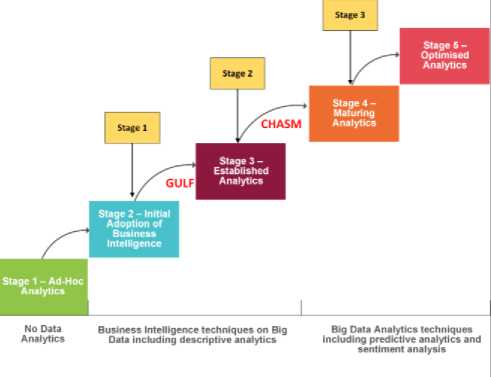
To show how Big Data Analytics Maturity Model for SMEs (BDAMM-SMEs) can be applied using the scoring tool developed, a positioning study was utilised. The positioning study has been previously documented in detail [4], however it is summarised here. The positioning study was developed with a team of academics and SME practitioners in a Community of Practice (CoP) environment. It is based on a real-life small UK software company with less than 50 employees which sells software to businesses within the UK. The business has slowly matured its analytics capability and three stages have been outlined:
-
• The first stage is titled Pre-Data Analytics, and this is where the business had an ‘traditional’ business culture and utilised Microsoft Excel for ad hoc reporting such as sales reports. The business did not have any dedicated Business Intelligence software.
-
• The second stage is called Business Intelligence as the business adopted the social media analytics software Hootsuite and were therefore analysing large volumes of social media Big Data. However, the techniques used were primarily descriptive analytics.
-
• The third stage is title Big Data Analytics where the business was utilising more advanced techniques including sentiment analysis to identify positive and negative sentiment of social media posts.
5. Discussion
The scoring tool was used to input the scores for each of the 21 factors at each stage of the scenario by the individuals who comprised the CoP. Fig. 4 shows the scores assigned for each of the 21 questions in the scoring tool for each of the three stages outlined in the scenario on the left-hand side of the diagram and the right-hand side shows each stage placed on BDAMM-SMEs. Fig. 4 shows that the BDAMM-SMEs compliments the scoring tool by providing a visualisation to the user at which stage of the analytics maturity their business is at in a clear format.
|
Stage 1 |
Stage 2 |
Stage 3 |
|
|
Ability to assess and address digital risks |
4 |
4 |
4 |
|
Common standards |
4 |
4 |
4 |
|
Ethical concerns in data use |
4 |
4 |
4 |
|
Regulatory issues |
4 |
4 |
4 |
|
Financial barriers |
1 |
3 |
4 |
|
Consultancy services |
3 |
3 |
4 |
|
Change management |
1 |
3 |
4 |
|
Cultural barriers |
1 |
3 |
4 |
|
Management of technology |
4 |
4 |
4 |
|
Managerial awareness and skills |
2 |
3 |
4 |
|
Talent management |
4 |
3 |
4 |
|
Volumes of data to be analysed |
2 |
4 |
5 |
|
Business cases |
1 |
3 |
4 |
|
In-house data analytics expertise |
3 |
3 |
5 |
|
Top management support |
1 |
3 |
5 |
|
Complexity of data |
3 |
4 |
4 |
|
Data quality |
3 |
3 |
3 |
|
Data scalability |
3 |
4 |
4 |
|
Data silos |
3 |
4 |
4 |
|
Infrastructure readiness |
3 |
5 |
5 |
|
Suitable software |
1 |
4 |
5 |
|
2.3 |
3.4 |
4.3 |
Fig.4. Scores of the scoring tool and application of the scenario to BDAMM-SMEs
The review of existing Maturity Models revealed several findings. The models identified originate from either academia, industry or consultancy firms and they all utilise four to six maturity stages. The models utilise either selfassessment or online questionnaire to identify the users’ maturity level, some of which provide guidance for how to use them. Most of the models are presented as diagrams with descriptions however some are presented in a grid format with multiple criteria. Some of the Maturity Models appear to be no longer supported or have been replaced by newer versions as was the case with Business Intelligence and Data Warehousing models. As none of the existing Maturity Models appear to be suitable for applying the output from the scoring tool developed from HBDAF-UKSMEs, Big Data Analytics Maturity Model for SMEs (BDAMM-SMEs) has been developed. Its purpose is to help primarily UK SMEs in their adoption of Big Data Analytics by graphically showing the output of the tool to provide a visual representation of the current level of analytics maturity.
The benefits of a Maturity Model are that it shows a business’ current level of maturity in a graphical format giving visualisation approach to assist understanding by the management team. It shows where they are on their journey, in this case in their analytics maturity with the goal of adopting Big Data Analytics and fully optimising it to their business. The user can see the next levels of maturity, so they know how much work is required to reach their chosen destination. Although it would be assumed that every business will want to reach the final stage of maturity, for BDAMM-SMEs, a business may be happy with achieving stage 3 or 4. Therefore, it is recommended that the business maintains their current level if that is sufficient for their needs. However, it is also important that users understand that the scoring tool assessment is undertaken at a point in time and therefore the score may increase or decrease when it is repeated.
One of the limitations of Maturity Models observed is that without clear guidance how to apply it, a subjective assessment may be required whereby the business has to decide themselves using the criteria outlined. Not all the existing Maturity Models identified provided guidance. However, Maturity Models which provide a questionnaire such as the HBDAF-UKSMEs scoring tool which uses weightings to calculate scores will be easier utilise as the user does not need to do any manual calculation or subjective assessment. HBDAF-UKSME was developed based on an extensive literature review, quantitative analysis, and qualitative analysis, providing triangulation between primary and secondary research methodologies. Therefore, this provides a more scientific approach and has been articulated to a Maturity Model shown in Fig. 3 to give a visual output and complimenting the analysis of maturity. This can then be quantified using a Balanced Scorecard or Benchmark approach to give a measure of financial benefits, indirect benefits and ‘hidden’ benefits [4]. The Maturity Model developed is purely complimentary to HBDAF-UKSMEs and it would be suggested that it should not be used in isolation.
6. Conclusions
Big Data Analytics is widely adopted by large business who have reported measurable benefits, yet only 10% of SMEs have adopted the technology despite comprising 99% of all businesses in the UK. A comprehensive review of existing Big Data and related Maturity Models has been undertaken, with a number of findings identified which include: most maturity models consist of 4 to 6 stages; some of the models provide no guidance; some models utilise a questionnaire to produce a score; some of the models have gone through iterations and replaced with new maturity models, as shown with the data warehousing and Business Intelligence Maturity Models; and some of the models are unsupported. The paper has provided a literature review of Big Data and Maturity Models and discusses how these models can be adopted by businesses to help them identify their current level of maturity in a visual format which can be easily interpreted by top management. The paper outlines the positive features and limitations of the existing Maturity Models. A case study using a positioning tool for Big Data Analytics adoption for SMEs is used for comparison purposes to a Maturity Model approach. As none of the reviewed Maturity Models appear to be suitable for translating the score produced from HBDAF-UKSMEs, consequently a new Maturity Model BDAMM-SMEs has been outlined and discussed in the paper. The BDAMM-SMEs is compared to the scoring tool to provide visualisation and to support top management in the adoption of Big Data Analytics to SMEs. The Maturity Model may be seen by top management as being more intuitive because of the visualization concept of the model and compliments the scoring tool which is based on qualitative and quantitative analysis. This can be further substantiated by using a Balanced Scorecard or Benchmark approach to give a measure of financial benefits, indirect benefits, and ‘hidden’ benefits of Big Data Analytics adoption to SMEs. Future work will apply BDAMM-SMEs to further case studies for the purposes of refining the Maturity Model.
References Big Data Analytics Maturity Model for SMEs
- NewVantage Partners, “Big Data Executive Survey 2017: Executive Summary of Findings,” 2017. Accessed: Jun. 22, 2019. [Online]. Available: www.newvantage.com.
- NewVantage Partners, “Big Data and AI Executive Survey 2019: Executive Summary of Findings,” 2019. Accessed: Nov. 27, 2019. [Online]. Available: www.newvantage.com.
- The World Bank, “Small and Medium Enterprises (SMEs) Finance,” 2022. https://www.worldbank.org/en/topic/smefinance (accessed Sep. 21, 2022).
- M. Willetts and A. S. Atkins, “Performance measurement to evaluate the implementation of big data analytics to SMEs using benchmarking and the balanced scorecard approach,” J. Data, Inf. Manag. 2023, pp. 1–15, Apr. 2023, doi: 10.1007/S42488-023-00088-8.
- M. Bianchini and V. Michalkova, “OECD SME and Entrepreneurship Papers No. 15 Data Analytics in SMEs: Trends and Policies,” Slovakia, 2019. doi: 10.1787/1de6c6a7-en.
- K. H. Tan and Y. Zhan, “Improving new product development using big data: a case study of an electronics company.,” R&D Manag., vol. 47, no. 4, pp. 570–582, Sep. 2017, [Online]. Available: http://10.0.4.87/radm.12242.
- M. Iqbal, S. H. A. Kazmi, A. Manzoor, A. R. Soomrani, S. H. Butt, and K. A. Shaikh, “A study of big data for business growth in SMEs: Opportunities & challenges,” in 2018 International Conference on Computing, Mathematics and Engineering Technologies: Invent, Innovate and Integrate for Socioeconomic Development, iCoMET 2018 - Proceedings, Mar. 2018, vol. 2018-Janua, pp. 1–7, doi: 10.1109/ICOMET.2018.8346368.
- S. Coleman, R. Göb, G. Manco, A. Pievatolo, X. Tort-Martorell, and M. S. Reis, “How Can SMEs Benefit from Big Data? Challenges and a Path Forward,” Qual. Reliab. Eng. Int., vol. 32, no. 6, pp. 2151–2164, Oct. 2016, doi: 10.1002/qre.2008.
- A. De Mauro, M. Greco, and M. Grimaldi, “A formal definition of Big Data based on its essential features,” Libr. Rev., vol. 65, no. 3, pp. 122–135, Apr. 2016, doi: 10.1108/LR-06-2015-0061.
- M. K. Saggi and S. Jain, “A survey towards an integration of big data analytics to big insights for value-creation,” Inf. Process. Manag., vol. 54, no. 5, pp. 758–790, Sep. 2018, doi: 10.1016/j.ipm.2018.01.010.
- A. Gandomi and M. Haider, “Beyond the hype: Big data concepts, methods, and analytics,” Int. J. Inf. Manage., vol. 35, no. 2, pp. 137–144, Apr. 2015, doi: 10.1016/j.ijinfomgt.2014.10.007.
- P. Mikalef, M. Boura, G. Lekakos, and J. Krogstie, “Big data analytics and firm performance: Findings from a mixed-method approach,” J. Bus. Res., vol. 98, pp. 261–276, 2019, doi: https://doi.org/10.1016/j.jbusres.2019.01.044.
- A. Lutfi et al., “Factors Influencing the Adoption of Big Data Analytics in the Digital Transformation Era: Case Study of Jordanian SMEs,” Sustain. 2022, Vol. 14, Page 1802, vol. 14, no. 3, p. 1802, Feb. 2022, doi: 10.3390/SU14031802.
- U. Sivarajah, M. M. Kamal, Z. Irani, and V. Weerakkody, “Critical analysis of Big Data challenges and analytical methods,” J. Bus. Res., vol. 70, pp. 263–286, Jan. 2017, doi: 10.1016/J.JBUSRES.2016.08.001.
- J. Song et al., “The Source of SMEs’ Competitive Performance in COVID-19: Matching Big Data Analytics Capability to Business Models,” Inf. Syst. Front., vol. 1, p. 3, 2022, doi: 10.1007/s10796-022-10287-0.
- C. Danziger, “How Amazon Used Big Data to Rule E-Commerce - insideBIGDATA,” insideBigData, 2019. https://insidebigdata.com/2019/11/30/how-amazon-used-big-data-to-rule-e-commerce/ (accessed Dec. 05, 2019).
- M. Ward and C. Rhodes, “Small businesses and the UK economy,” London, United Kingdom, 2014. doi: SN/EP/6078.
- G. Hutton and M. Ward, “Business statistics,” Dec. 2022. Accessed: Jan. 04, 2023. [Online]. Available: https://commonslibrary.parliament.uk/research-briefings/sn06152/.
- Organisation for Economic Cooperation and Development, “Financing SMEs and Entrepreneurs 2022 : An OECD Scoreboard,” 2022. https://www.oecd-ilibrary.org/sites/8ae4e97d-en/index.html?itemId=/content/component/8ae4e97d-en (accessed Sep. 21, 2022).
- European Commission, “Entrepreneurship and Small and medium-sized enterprises (SMEs) | Internal Market, Industry, Entrepreneurship and SMEs,” 2021. https://ec.europa.eu/growth/smes_en (accessed May 16, 2021).
- Department for Business & Trade, “Business population estimates for the UK and regions 2023: statistical release - GOV.UK,” Oct. 05, 2023. https://www.gov.uk/government/statistics/business-population-estimates-2023/business-population-estimates-for-the-uk-and-regions-2023-statistical-release (accessed Dec. 01, 2023).
- X. Parra, X. Tort-Martorell, C. Ruiz-Viñals, and F. Álvarez-Gómez, “A maturity model for the information-driven SME,” J. Ind. Eng. Manag., vol. 12, no. 1, pp. 154–175, 2019, doi: 10.3926/JIEM.2780.
- N. Chonsawat and A. Sopadang, “Smart SMEs 4.0 Maturity Model to Evaluate the Readiness of SMEs Implementing Industry 4.0,” Chiang Mai Univ. J. Nat. Sci., vol. 20, no. 2, pp. 1–13, Apr. 2021, doi: 10.12982/CMUJNS.2021.027.
- J. Radcliffe, “Leverage a Big Data Maturity Model to Build Your Big Data Roadmap,” 2014. [Online]. Available: https://web.archive.org/web/20150221132359/http://radcliffeadvisory.com/research/research.html.
- F. Halper and K. Krishnan, “TDWI Big Data Maturity Model Guide | Transforming Data with Intelligence,” 2013. Accessed: Dec. 19, 2018. [Online]. Available: https://tdwi.org/whitepapers/2013/10/tdwi-big-data-maturity-model-guide.aspx?tc=page0.
- M. Comuzzi and A. Patel, “How organisations leverage Big Data: a maturity model,” Ind. Manag. Data Syst., vol. 116, no. 8, pp. 1468–1492, Sep. 2016, doi: 10.1108/IMDS-12-2015-0495.
- V. Clarke and V. Braun, “Teaching thematic analysis: Over-coming challenges and developing strategies for effective learning.,” Psychologist, 2013, doi: 10.1191/1478088706qp063oa.
- Z. Polkowski and M. Nycz, “Big Data Applications in SMEs,” Sci. Bull. - Econ. Sci., vol. 15, no. 3, pp. 13–24, 2016, Accessed: May 07, 2019. [Online]. Available: http://economic.upit.ro/repec/pdf/2016_3_2.pdf.
- A. Olufemi, “Considerations for the Adoption of Cloud-based Big Data Analytics in Small Business Enterprises,” Electron. J. Inf. Syst. Eval., vol. 21, no. 2, pp. 63–79, May 2018, [Online]. Available: www.ejise.com.
- W. Noonpakdee, A. Phothichai, and T. Khunkornsiri, “Big data implementation for small and medium enterprises,” in 2018 27th Wireless and Optical Communication Conference, WOCC 2018, Apr. 2018, pp. 1–5, doi: 10.1109/WOCC.2018.8372725.
- I. Lee, “Big data: Dimensions, evolution, impacts, and challenges,” Bus. Horiz., vol. 60, no. 3, pp. 293–303, May 2017, doi: 10.1016/j.bushor.2017.01.004.
- S. Zhou, Z. Qiao, Q. Du, G. A. Wang, W. Fan, and X. Yan, “Measuring Customer Agility from Online Reviews Using Big Data Text Analytics,” J. Manag. Inf. Syst., vol. 35, no. 2, pp. 510–539, Apr. 2018, doi: 10.1080/07421222.2018.1451956.
- C. O’Connor and S. Kelly, “Facilitating knowledge management through filtered big data: SME competitiveness in an agri-food sector,” J. Knowl. Manag., vol. 21, no. 1, pp. 156–179, Feb. 2017, doi: 10.1108/JKM-08-2016-0357.
- D. Arunachalam, N. Kumar, and J. P. Kawalek, “Understanding big data analytics capabilities in supply chain management: Unravelling the issues, challenges and implications for practice,” Transp. Res. Part E Logist. Transp. Rev., 2018, doi: 10.1016/j.tre.2017.04.001.
- A. Myrodia, T. Randrup, and L. Hvam, “Configuration lifecycle management maturity model,” Comput. Ind., vol. 106, pp. 30–47, Apr. 2019, doi: 10.1016/j.compind.2018.12.006.
- International Organization for Standardization (ISO), “ISO/IEC TR 15504-7:2008 - Information technology -- Process assessment -- Part 7: Assessment of organizational maturity,” 2008. https://www.iso.org/standard/50519.html (accessed Mar. 21, 2019).
- J. Becker, R. Knackstedt, and J. Pöppelbuß, “Developing Maturity Models for IT Management,” Bus. Inf. Syst. Eng., vol. 1, no. 3, pp. 213–222, Jun. 2009, doi: 10.1007/s12599-009-0044-5.
- G. Klimko, “Knowledge Management and Maturity Models: Building Common Understanding,” in Second European Conference on Knowledge Management, 2001, pp. 269–278.
- R. Wendler, “The maturity of maturity model research: A systematic mapping study,” Inf. Softw. Technol., vol. 54, no. 12, pp. 1317–1339, 2012, doi: https://doi.org/10.1016/j.infsof.2012.07.007.
- R. Caralli, M. Knight, and A. Montgomery, “Maturity Models 101: A Primer for Applying Maturity Models to Smart Grid Security, Resilience, and Interoperability,” 2012. Accessed: Apr. 01, 2019. [Online]. Available: https://resources.sei.cmu.edu/asset_files/WhitePaper/2012_019_001_58920.pdf.
- J. Pöppelbuß and M. Röglinger, “What Makes a Useful Maturity Model? A Framework Of General Design Principles for Maturity Models and its Demonstration in Business Process Management,” 2011. Accessed: Jan. 26, 2019. [Online]. Available: http://citeseerx.ist.psu.edu/viewdoc/download?doi=10.1.1.232.1367&rep=rep1&type=pdf.
- T. de Bruin, R. Freeze, U. Kaulkarni, and M. Rosemann, “Understanding the main phases of developing a maturity assessment model,” in Australasian Chapter of the Association for Information Systems, 2005, pp. 8–19, doi: 10.1108/14637151211225225.
- M. C. Paulk, B. Curtis, M. B. Chrissis, and C. V. Weber, “Capability maturity model, version 1.1,” IEEE Softw., vol. 10, no. 4, pp. 18–27, Jul. 1993, doi: 10.1109/52.219617.
- A. H. Maslow, “A theory of human motivation.,” Psychol. Rev., vol. 50, no. 4, pp. 370–396, 1943, doi: 10.1037/h0054346.
- P. B. Crosby, Quality is free : the art of making quality certain. McGraw-Hill, 1979.
- M. C. Paulk, “A History of the Capability Maturity Model for Software,” Softw. Qual. Profile, vol. 1, no. 1, pp. 5–19, 2009, Accessed: Jan. 22, 2019. [Online]. Available: www.asq.org.
- T. Kasse, Practical insight into CMMI. Artech House, 2008.
- CMMI Institute, “CMMI Institute,” Mellon Carnegie University, 2019. http://cmmiinstitute.com/about-cmmi-institute (accessed Jan. 21, 2019).
- J. N. Luftman, “Assessing Business-IT Alignment Maturity,” in Strategic Information Technology, vol. 4, no. 1, 2000.
- G. Lahrmann, F. Marx, R. Winter, and F. Wortmann, “Business Intelligence Maturity: Development and Evaluation of a Theoretical Model,” in 2011 44th Hawaii International Conference on System Sciences, Jan. 2011, pp. 1–10, doi: 10.1109/HICSS.2011.90.
- W. Eckerson, “Gauge Your Data Warehouse Maturity,” DM Rev., vol. 14, no. 11, pp. 34–51, Nov. 2004, [Online]. Available: http://ezproxy.staffs.ac.uk/login?url=http://search.ebscohost.com/login.aspx?direct=true&db=bth&AN=14964672&site=ehost-live.
- Hortonworks, “Big Data Scorecard - Assessing Big Data Maturity and Business Goals | Hortonworks,” 2016. https://hortonworks.com/get-started/big-data-scorecard/ (accessed Jan. 26, 2019).
- W. W. Eckerson, “Beyond the Basics: Accelerating BI Maturity,” 2007. Accessed: Feb. 16, 2019. [Online]. Available: www.sap.com.
- B. Schmarzo, “Big Data: Understanding How Data Powers Big Business,” Zhurnal Eksperimental’noi i Teoreticheskoi Fiziki. Wiley, p. 242, 2013, Accessed: Dec. 19, 2018. [Online]. Available: http://scholar.google.com/scholar?hl=en&btnG=Search&q=intitle:No+Title#0%5Cnhttp://scholar.google.com/scholar?hl=en&btnG=Search&q=intitle:Understanding+how+data+powers+big+business%230.
- N. Betteridge and C. Nott, “Big Data & Analytics Maturity Model | IBM Big Data & Analytics Hub,” 2014. https://www.ibmbigdatahub.com/blog/big-data-analytics-maturity-model (accessed Feb. 06, 2019).
- B. El-Darwiche, V. Koch, D. Meer, and W. Tohme, “Big data maturity An action plan for policymakers and executives,” 2014. Accessed: Jan. 30, 2019. [Online]. Available: https://web.archive.org/web/20160423195844/https://www.strategyand.pwc.com/media/file/Strategyand_Big-data-maturity.pdf.
- H. Sulaiman, Z. C. Cob, and N. Ali, “Big data maturity model for Malaysian zakat institutions to embark on big data initiatives,” in 2015 4th International Conference on Software Engineering and Computer Systems (ICSECS), Aug. 2015, pp. 61–66, doi: 10.1109/ICSECS.2015.7333084.
- C. Olszak and M. Mach-Król, “A Conceptual Framework for Assessing an Organization’s Readiness to Adopt Big Data,” Sustainability, vol. 10, no. 10, p. 3734, Oct. 2018, doi: 10.3390/su10103734.
- S. Mouhib, H. Anoun, M. Ridouani, and L. Hassouni, “Global Big Data Maturity Model and its Corresponding Assessment Framework Results,” IAENG Int. J. Appl. Math., vol. 53, no. 1, 2023, Accessed: May 14, 2023. [Online]. Available: https://www.proquest.com/openview/b76d5a1d693cdc9164944fe2bdca7235/1?pq-origsite=gscholar&cbl=2049591.
- I. H. Rajteric, “Overview of Business Intelligence Maturity Models,” Pregl. Model. ZRELOSTI Posl. Intel., vol. 15, no. 1, pp. 47–67, May 2010, [Online]. Available: http://ezproxy.staffs.ac.uk/login?url=http://search.ebscohost.com/login.aspx?direct=true&db=bth&AN=51594235&site=ehost-live.
- Internet Archive, “Internet Archive: Wayback Machine,” 2019. https://archive.org/web/ (accessed Mar. 24, 2019).
- S. M. Drus and N. H. Hassan, “Big Data Maturity Model-A Preliminary Evaluation,” 2017. Accessed: Jan. 26, 2019. [Online]. Available: http://www.uum.edu.my.
- A. Soroka, Y. Liu, L. Han, and M. S. Haleem, “Big Data Driven Customer Insights for SMEs in Redistributed Manufacturing,” in Procedia CIRP, Jan. 2017, vol. 63, pp. 692–697, doi: 10.1016/j.procir.2017.03.319.
- M. Mattera, “SMEs transformation through usage and understanding of big data case study: Spanish restaurant industry,” in 2018 IEEE 3rd International Conference on Big Data Analysis (ICBDA), Mar. 2018, pp. 186–189, doi: 10.1109/ICBDA.2018.8367674.
- J. Naskali, J. Kaukola, J. Matintupa, H. Ahtosalo, M. Jaakola, and A. Tuomisto, “Mapping Business Transformation in Digital Landscape: A Prescriptive Maturity Model for Small Enterprises,” Springer, Cham, 2018, pp. 101–116.
- P. Ulrich, W. Becker, A. Fibitz, E. Reitelshöfer, and F. Schuhknecht, “Data Analytics Systems and SME type – a Design Science Approach,” Procedia Comput. Sci., vol. 126, pp. 1162–1170, Jan. 2018, doi: https://doi.org/10.1016/j.procs.2018.08.054.
- E. Raguseo, “Big data technologies: An empirical investigation on their adoption, benefits and risks for companies,” Int. J. Inf. Manage., vol. 38, no. 1, pp. 187–195, Feb. 2018, doi: 10.1016/J.IJINFOMGT.2017.07.008.
- B. Schmarzo, “Big Data Business Model Maturity Index Guide – InFocus Blog | Dell EMC Services,” 2016. https://infocus.dellemc.com/william_schmarzo/big-data-business-model-maturity-index-guide/ (accessed Feb. 06, 2019).
- C. A. Ardagna, P. Ceravolo, and E. Damiani, “Big data analytics as-a-service: Issues and challenges,” in 2016 IEEE International Conference on Big Data (Big Data), Dec. 2016, pp. 3638–3644, doi: 10.1109/BigData.2016.7841029.
