Billing counter optimization at hypermarkets during offer days and non-offer days

Author: Dr. S. Jaisankar, Dr. P. Nalini
Journal: Science, Education and Innovations in the Context of Modern Problems @imcra
Article in issue: 4 vol.4, 2021.
Free access
Waiting in queues are a common phenomenon that can be seen or experienced in our daily life. Queues are common in places like filling stations, supermarket stores, hospitals, tollgate, manufacturing firms etc., Waiting in line for getting a service is boredom. No customer will be willing to wait in long queues and waiting in hypermarket counters are not exception. This paper examines an efficient queue management at hypermarket counters considering the variations in customer arrivals at different time during business hours. One of the expected gains from this study is application of the queuing system to optimize the billing section within a short duration in terms of server utilization and minimum queue length. An interesting aspect of the queuing system is to measure its system’s performance evaluating the server utilization, number of counters used, and overall cost involved for operating the billing section. Finally, the study attempts to propose a scientific approach to act quickly to determine an optimum number of billing counters to put in operation at hypermarkets billing section for varying customer arrival rate during offer days and non-offer days.
Billing counter, Hypermarket, Optimization, Queuing model
Short address: https://sciup.org/16010129
IDR: 16010129 | DOI: 10.56334/sei/4.4.17
Text of the scientific article Billing counter optimization at hypermarkets during offer days and non-offer days
Waiting in long queues to get a service are most common problem faced in daily life. Queues can be seen in places such as banks, post office, ticketing office, toll gates, traffic signals and many a times in supermarket and hypermarkets particularly in the billing and delivery sections. Waiting in line for getting a service is boredom. No customer will be willing to wait in long queues. In many service points or counters one can see huge queues before the counters for getting service and supermarket or hypermarkets are no different. For decades it is known that there is an intense competition in retail business, and it becomes important for the retailer to retain the customer by providing good service and environment. The focus of a retailer is to provide good service in all possible ways and satisfy the customers. The key area to address is the long waiting lines at the billing counters in the hypermarkets. The major problem in supermarkets is billing delay and queuing issues which are considered as the key reasons for dissatisfaction of customers. The waiting time increases when the average service rate of the counters is less than the average arrival rate of customers. The queuing theory is concerned with mathematical modelling and used as a powerful technique to design a balanced queuing system and to evaluate the performance of the queuing system.
PROBLEM STATEMENT
In general, it can be observed that customers waiting in long queues in supermarket or hypermarket during peak hours for getting service. This is a huge concern for the customers, and this happens because of the time delay in billing counters. To reduce the customer waiting time more counters can be opened provided the counters are utilized fully. Again, opening more counters does not work during non-peak or lean hours. There will always be a increase or decrease in the customer arrivals depending on the peak time and lean time of business hours. This variation in customer arrivals can also occur during offer and festive days. Long queues at the bill counters in malls or supermarkets should be avoided to enhance service quality. Change in customer arrival rate is directly proportional to the number of counters required in operation. Store managers face difficulty in determining the number of the counters required due to minimize the customer waiting time. This October, 2022, Baku, ISSUE IV p. 446
ISSN 2790-0169 / E-ISSN 2790-0177
paper attempts to provide suggestive model to determine optimum number of counters that are required in operation during different time periods viz., normal time, peak time, and lean time and on offer days and non-offer days. Reduction in customer waiting time is considered important which is influenced by the queuing theory and hence this study was carried out. To grow in service business the management should always make an effective decision on waiting time management which is vital in a competitive environment. The waiting time is a factor considered by the researcher as a measure of service quality. Hence, satisfying the customer needs and making the purchase ease helps the organization in satisfying the existing customers and bringing in new customers as well. This study can benefit any business offering services with counters to minimize long waiting time and improve customer satisfaction.
OBJECTIVES
The primary objective of the paper is to optimize the billing counters in hypermarkets by determining the optimum number of counters to put in operation required at different business hours. Business hours are categorized as peak hours and lean hours and during offer days and non-offer days in a week. Queuing theory is applied to different scenarios to arrive at the required number of counters considering the business hours and offer days in a week.
REVIEW OF LITERATURE
Rema.V and Sikdar.K 2017 in their study cautions increase in competition from online grocery stores has necessitated retailers including supermarkets to understand consumers better and to satisfy customers at sales checkout. The buying behavior and customer loyalty are essential for well-established brick and mortar supermarket. Nityangini Jhala and Pravin Bhathawala in their a nalysis on application of queuing theory in supermarkets waiting lines states that queues are a common phenomenon in life, in supermarkets stores and in many places where general public requires essential services such as petrol filling stations, hospitals, and also in manufacturing firms. Anthony Igwe, J.U.J Onwumere, Obiamaka P.Egbo in their study states that efficient queue management in supermarkets can be determined by working optimal number of
ISSN 2790-0169 / E-ISSN 2790-0177
hours a system to serve that reduces excess labour or over-stress. In another study by Yina Lu, emphasis the need for measuring the effect of queues on customer purchases [16-32]. It is primarily the length of the queue that determine a customer to decide whether to join or quit the queue after joining. The number of servers determines the speed at which the queue length which has an impact on customer decisions. Damodhar F Shastrakar, in his study strongly recommends the need for queuing theory at bill paying counters to minimize the waiting time of customer. Further the authors suggested queuing model where the waiting time is reduced from 5 minutes to 2 minutes for one counter by using other counter for customer purchasing products more than five products. It reduces the waiting time for customers buying products less than five products and increase the customer satisfaction level which brings in loyalty to the store. From the reviews of the previous studies clearly states the importance of optimizing the billing counters at sales outlets. At the same time no study was found focusing on the counters required during different business hours and during offer days more arrivals are expected at these times for any supermarket or hypermarkets.
V. RESEARCH DESIGN
The study attempts to solve huge waiting time in retail outlets and supermarkets using queuing theory and hence a applied research is adopted for the study. Queuing theory is the mathematical model and analysis of systems applied at long waiting lines that provide service to random demands. A questionnaire was used to understand the functioning of current queuing model and analysis was carried out. A questionnaire was used for the study to understand the customer’s views and satisfaction towards waiting at checkout counters. A random sampling method was used in collecting data during all types of business hours.
ISSN 2790-0169 / E-ISSN 2790-0177
The arrival and service time at supermarket billing counters collected was primary and for different business categories hours. The average inter- arrival rate and service time were calculated for different counters, different days which was used for calculating various parameters for queuing analysis. The queue discipline followed was First in First out, FIFO. The objective of the study was application of queuing theory for
billing section during different working hours was to determine optimal number of billing counters and to reduce the customer waiting time.
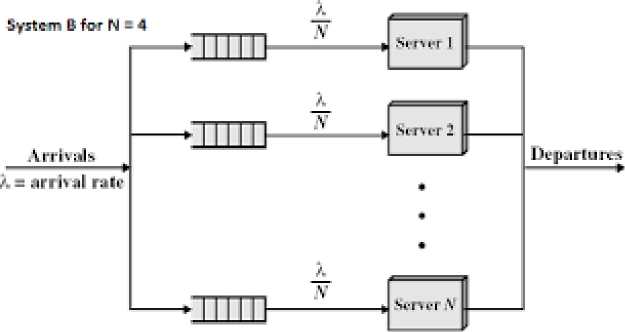
Fig. 1.1 Multi Queue and Multi Server System
Fig 1.1 shows a multi queue and multi-server model, where N number of servers, behind which number of queues shown for arriving customers. The Kendall’s notation, M/M/n queue is a model where multi server serves jobs that arrive according to Poisson Process i.e. inter-arrival durations are Poisson distributed and have exponentially distributed service times. In supermarkets, there is multiple units to perform same checkout operation of sales which are usually set all together besides the entrance. This kind of system is called multi server system with single service facility (multiple checkout counters) with sales as service available in a system. The following assumptions were made to analyze the data,
Arrivals of customers follow a Poisson distribution.
ISSN 2790-0169 / E-ISSN 2790-0177
Inter arrival times are exponentially distributed.
Service times are exponentially distributed.
All the customers leave the queue after being served.
No restriction in numbers of customers arriving in the queuing system.
Arrival is served with a queue discipline, FIFO (First In First Out) basis.
Data was collected from supermarkets and hypermarkets to understand the percentage of customer satisfied on the time taken for billing the products purchased by them, The result shows 75 percent of the customers felt that they have long waiting experience in queues Fig.1.2.
Have you experienced long waiting in queue for billing?
|
6 |
||||
|
Ye 117 0 20 40 60 80 100 120 No. of Customers |
||||
Fig. 1.2 Customer responses on waiting at billing counter
-
5.1 Queuing Analysis : To have a deeper understanding on waiting lines the business hours were divided into three categories based on the footfalls in the supermarket.
Normal Business Hour : 10 am to 2 pm
Lean Business Hour : 2 pm to 5 pm
Peak Business Hour : 5 pm to 10 pm
ISSN 2790-0169 / E-ISSN 2790-0177
ISSN 2790-0169 / E-ISSN 2790-0177
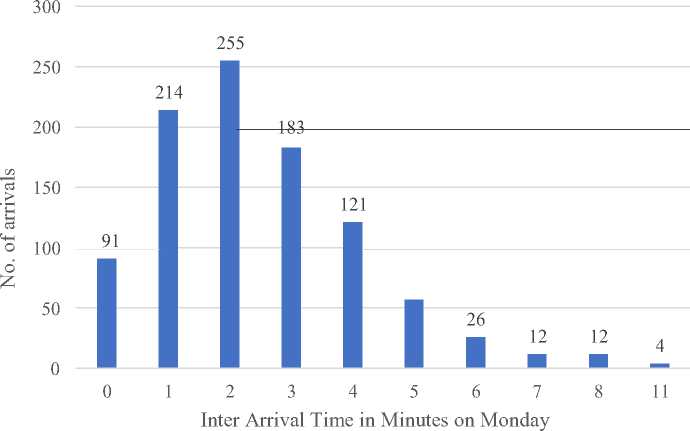
Fig. 1.3a Inter-arrival time of customers
300 283
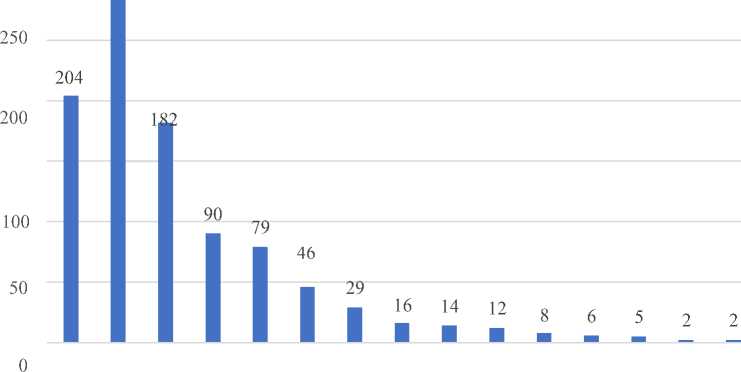
Fig. 1.3b Service time for customers
On Monday, 25 per cent of customers inter-arrival time is 2 minutes and 19 per cent of customers inter-arrival time is 3 minutes. Fig 1.3b shows the frequency of service time for Monday, 29 per cent of customers service time is between 1-2 minutes, and 19 per cent of customers service time is 3 minutes which indicates 70 per cent of customers are served between 1-3 minutes. The remaining 30 per cent of customers service time is high which results in long waiting lines.
ISSN 2790-0169 / E-ISSN 2790-0177
-
5.2 Calculation of Queuing Parameters for Offer days and Non-offer days
3.1
2.9
2.8
2.7
2.6
2.5
2.4
Table 1.1 shows the service rate and arrival rate for different business hours for all days in a week. The average arrival rate of customer for normal business was 2.74 minutes and service rate of 3.3 which is less when compared to the other business hours in a week.
|
Day |
Normal |
Lean |
Peak |
|||
|
Arrival Time |
Service Time |
Arrival Time |
Service Time |
Arrival Time |
Service Time |
|
|
Sunday |
2.62 |
3.07 |
2.37 |
3.05 |
2.9 |
2.99 |
|
Monday |
2.62 |
3.33 |
3.17 |
3.95 |
2.55 |
2.88 |
|
Tuesday |
2.82 |
3.46 |
3.45 |
3.74 |
2.75 |
2.95 |
|
Wednesday |
2.43 |
2.94 |
2.67 |
3.18 |
2.62 |
2.98 |
|
Thursday |
2.97 |
3.28 |
2.87 |
3.05 |
2.89 |
3.07 |
|
Friday |
3.08 |
3.4 |
3.03 |
3.34 |
3.0 |
3.21 |
|
Saturday |
2.68 |
2.94 |
2.89 |
3.35 |
2.72 |
3.36 |
|
Average |
2.74 |
3.31 |
3.03 |
3.52 |
2.82 |
3.06 |
Table 1.1 Service and arrival time (mins) for different business hours
ISSN 2790-0169 / E-ISSN 2790-0177
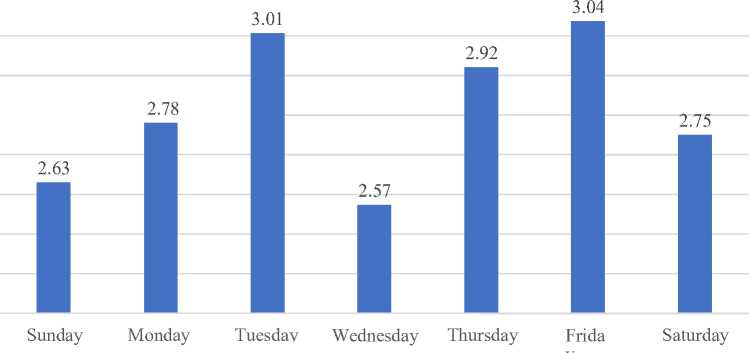
Fig. 1.4 Inter Arrival of Customer Day wise
The graph helps to understand that the customer’s inter-arrival rate in a week, the average inter-arrival rate of customers on Wednesday, Saturday and Sunday which is a non-offer day was found to be less with 2.57 minutes. Arrivals were high on Tuesday and Friday which were is either an offer day or a discount day.
-
5.3 Calculation of queuing parameters for a week: Based on the values arrived from Table 1.1, the queuing parameters are calculated for a week using Tora Software.
Day
Utilization
Factor
Average number of customers in system
Average number of customers in queue
Average waiting time in system
(mins)
Average waiting time in queue (mins)
Sunday
93%
19
17
6.50
6.18
ISSN 2790-0169 / E-ISSN 2790-0177
6.18
|
Monday |
83% |
6 |
4 |
1.90 |
1.73 |
|
Tuesday |
89% |
10 |
9 |
3.33 |
3.03 |
|
Wednesday |
85% |
7 |
5 |
2.13 |
1.81 |
|
Thursday |
86% |
7 |
6 |
2.32 |
2.00 |
|
Friday |
90% |
12 |
9 |
3.34 |
3.03 |
|
Saturday |
83% |
7 |
5 |
2.01 |
1.73 |
Table 1.2 shows the queuing parameters for the data in a week
From Table 1.2, the utilization factor for Sunday (Offer Day) is 93% which is high compared to other days and the average number of customers in system is 19 indicates that the system was utilized maximum. The number of active counters also plays a vital role in determining the parameters of queuing analysis.

3.03
3.03
1.73 1.81 2 1.73
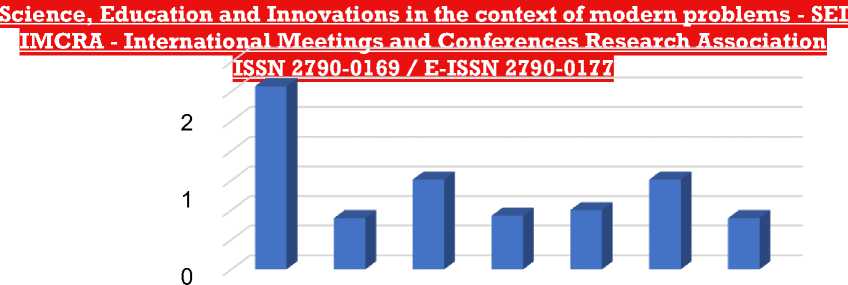
Fig. 1.4 Waiting Time of Customer Day wise in a week
Fig. 1.4 shows the average waiting time of customers in queue on Sunday is 6.18 minutes which is very high even after utilizing the available resources.
|
Parameters |
Usual Business |
Lean Business |
Peak Business |
|
Utilization Factor |
81% |
86% |
92% |
|
Average Number of customers in System, Ls |
5 |
6 |
13 |
|
Average Number of customers in Queue, Lq |
4 |
5 |
12 |
|
Average Waiting time in System, Ws |
1.67 |
1.96 |
4.34 |
|
Average Waiting time in Queue, Wq |
1.35 |
1.67 |
4.04 |
Table 1.3 Calculation of queuing parameters on offer days
ISSN 2790-0169 / E-ISSN 2790-0177
Table 1.3 shows the utilization factor for peak business hours is 92% and the average number of customers in system is 13 which is high compared to other business hours. The number of counters active in peak business hours is fully utilized i.e 12 counters. From the observations it was found that 20- 30 per cent of customers were buying products less than 10 units and hence to increase the customer satisfaction, it was suggested to implement a separate counter for customer’s buying product less 10 units.
|
Parameters |
Usual Business |
Lean Business |
Peak Business |
|
Utilization Factor |
83% |
87% |
91% |
|
Average Number of customers in System Ls |
5 |
7 |
11 |
|
Average Number of customers in Queue Lq |
4 |
6 |
10 |
|
Average Waiting time in System Ws |
1.78 |
2.12 |
3.84 |
|
Average Waiting time in Queue Wq |
1.48 |
1.84 |
3.51 |
Table 1.4 Calculation of Parameters for Non-offer Days
From Table 1.4, the utilization factor for peak business hours is 91% and the average number of customers waiting in system is 11 which is high compared to other business hours. Irrespective of the offer or non-offer days, the system is fully utilized in peak business hours and it is suggested to bring in changes to existing model or implement additional counters to improve the service level.
-
5.4 What-if Analysis: To find the results of queuing parameters various scenarios a what-
ISSN 2790-0169 / E-ISSN 2790-0177
if analysis was performed for different business hours using simulation and Tora software. The simulation helps in better understanding of the queuing parameters and obtain accurate result.
|
Business Category |
Arrical / Hour |
Service/ Hour |
Ws mins |
Wq mins |
Ls |
Lq |
Active counters |
|
Peak Business |
248* |
20 |
7.07 |
4.08 |
29 |
17 |
13 |
|
Peak Business |
248 |
22 |
5.61 |
2.89* |
23 |
12 |
12 |
|
Peak Business |
200 |
18 |
6.05 |
2.71 |
20 |
9 |
12* |
|
Peak Business |
198* |
18 |
5.64 |
2.31 |
19 |
8 |
12 |
|
Peak Business |
160 |
17* |
8.30 |
4.77 |
22 |
13 |
10 |
|
Peak Business |
111 |
12 |
9.96 |
4.97* |
19 |
9 |
10 |
|
Peak Business |
92 |
13 |
7.9 |
3.3* |
12 |
5 |
8 |
|
Peak Business |
50 * |
10 |
9.52 |
3.52 |
8 |
3 |
6 |
|
Lean Business |
102 |
14 |
8.67 |
4.38 |
15 |
8 |
8* |
|
Lean Business |
70* |
12 |
7.39 |
2.34 |
9 |
3 |
7 |
|
Lean Business |
55 |
12 |
6.39 |
2.10 |
6 |
2 |
5* |
ISSN 2790-0169 / E-ISSN 2790-0177
|
Lean Business |
40 |
12 |
9.93 |
4.93* |
7 |
3 |
4 |
|
Lean Business |
35 |
12.5* |
6.51 |
1.68 |
4 |
1 |
4 |
|
Lean Business |
30* |
12 |
12.02 |
7.022 |
6 |
4 |
3 |
|
Usual Business |
70 |
16 |
7.99 |
4.24* |
9 |
5 |
5 |
|
Usual Business |
60* |
18 |
6.62 |
3.28 |
7 |
3 |
4 |
|
Usual Business |
40 |
12* |
9.93 |
4.93 |
7 |
3 |
4 |
|
Usual Business |
40 |
17 |
6.92 |
3.39 |
5 |
2 |
3* |
|
Usual Business |
30 |
14 |
6.85 |
2.56* |
3 |
1 |
3 |
|
Usual Business |
25* |
15 |
13.09 |
9.09 |
5 |
4 |
2 |
|
Usual Business |
16 |
20 |
15 |
12 |
4 |
3 |
1* |
*Indicates the fixed parameter
Table 1.5 Calculation of Parameters for Various Business Scenarios
SUMMARY OF FINDINGS
From Table 1.5 the following findings were arrived,
Utilization factor for peak business on Monday was found to be 89 per cent which shows that the system is busy and the average number of customers waiting in system is 8 October, 2022, Baku, ISSUE IV p. 459
ISSN 2790-0169 / E-ISSN 2790-0177
which is very high. Whereas the average waiting time to be served is 3.03 minutes which is acceptable.
The average inter-arrival rate of customers for on Wednesday was found to be less i.e 2.57 minutes followed by Sunday and Saturday where all the days are Offer/ Discount days. The inter-arrival time on Friday was found to be high which is 3.04 minutes i.e. for every 3.04 minutes a customer arrives to get served.
The utilization factor on Sunday (Offer Day) is 93 per cent which is high when compared to other days and the average number of customers in system is 19 indicates that the system is utilized fully. The number of active counters also plays a vital role in determining the parameters of queuing analysis.
The average waiting time of customers in queue on Sunday is high i.e. 6.18 minutes which is very high even after utilizing the available resources.
The utilization factor for peak business hours offer days is 92 per cent and the average number of customers in system is 13 which is very high compared to other business hours. The number of counters active in peak business hours is fully utilized i.e 12 counters and about 20-30 per cent of customers buying products less than 10. It can be suggested to implement a new counter for customer’s buying product less 10 or to implement certain strategies to existing counters.
The utilization factor for peak business hours non offer days is 91 per cent and the average number of customers waiting in system is 11 which is high compared to other business hours. Irrespective of the offer and non-offer days, the system is fully utilized in peak business hours, and it can be suggested to bring in changes to existing model or implement new counters to improve the service level.
|
Business |
Active * ■ |
Days |
|
Normal Hours |
8 |
Offer Days |
|
Lean Hours |
5 |
Offer Days |
|
Peak Hours |
12 |
Offer Days |
ISSN 2790-0169 / E-ISSN 2790-0177
|
Normal Hours |
6 |
Non-offer Days |
|
Lean Hours |
4 |
Non-offer Days |
|
Peak Hours |
9 |
Non-offer Days |
Table 1.5 Recommended number of counters for offer days and peak hours
Finally, Table 1.5 summarizes the optimum number of counters to put in operation at different business hours during offer days and non-offer days was arrived.
CONCLUSION
The average waiting time in the queue was reduced from 3.35 minutes to 3.10 minutes for one customer and the average number of customers waiting in a queue was reduced from 8 customers to 6 customers for an hour irrespective of an offer or a non-offer day. The optimum number of counters recommended during different business hours will reduce the waiting time of the customers and will help to increase the number of customers served per day. Hypermarkets can improve their sales by serving a maximum number of
ISSN 2790-0169 / E-ISSN 2790-0177
customers with optimum number of billing counters at different business hours and offer days to reduce the customer waiting time and operational costs.
