Biophysical phenomena in blood flow system in the process of indirect arterial pressure measurement

Author: Rudenko Mikhail Y., Voronova Olga K., Zernov Vladimir A.
Journal: Cardiometry @cardiometry
Section: Reprinted from Intech
Article in issue: 6, 2015.
Free access
Biophysics, blood flow, arterial pressure, measurement, cardiovascular diagnostics
Short address: https://sciup.org/148308798
IDR: 148308798 | DOI: 10.12710/cardiometry.2015.6.4964
Text of the article Biophysical phenomena in blood flow system in the process of indirect arterial pressure measurement
Diagnostic parameter “arterial pressure” known in medical practice from the earliest times is now widely used for assessment of body state. Indirect occlusive methods are the most popular measurement techniques. Although the indirect method of measurement is more than one hundred years old there is no precise understanding of biophysical processes taking place in compressed blood flow.
The idea of indirect arterial pressure measurement with the help of occlusive cuff belongs to Riva-Rocci. However, the phenomenon of noise appearing and disappearing in the blood flow distal of the brachial artery compression during the equality moments of occlusive, systolic and diastolic pressure was called Korotkov sounds. The origin of the sounds is considered from different viewpoints [1]. But it is important to mention that their identification has no valid criteria. If their appearance corresponds to the systolic pressure, their disappearance is not always characteristic for the diastolic pressure. Thus, during the Olympic Games in Mexico continuous sounds were recorded with the swimmers. But this fact didn’t mean that they had zero diastolic pressure.
In case of measurement method computerization more reliably recorded biosignals in the form of oscillogram are used [1]. Nowadays Korotkov sounds are out of use in case of computerization of the arterial pressure measurement. The oscillometrical method of measurement is more reliable. But this method has no explanation from the point of view of biophysics as well.
The authors of the present research work have studied biophysics of the processes in the occlusive blood flow for a long time. The study resulted in discovery of the objective law concerning the origin of arterial pressure waves interference in occlusive blood flow. It enabled to understand the processes taking place in occlusive blood flow and find the criteria which systolic pressure and diastolic pressure correspond to.
Biophysical processes of origin of the arterial pressure waves interference in occlusive blood flow
Let us consider the occlusive method of the arterial pressure measurement. Big blood vessels are compressed with occlusive pressure artificially produced in the rubber cuff put as a rule on one of the patient’s arms. Then the pressure is measured at the moments of its balance with the arterial pressure using the corresponding criteria. This method enables the measurement of two parameters – systolic arterial pressure and diastolic arterial pressure.
Which criteria can be used for accurate measurement?
In practice the method of Korotkov sounds and the oscillometrical method are used. In case of the measurement process computerization the sounds method is not used. It is not reliable for noise recording. Oscillometrical method seems to be more reliable. Oscillogram is the signal of pulse wave oscillations modulated by the occlusive pressure. When recorded, these oscillations are extracted from the pressure signal in the cuff as a variable component with the help of the filtering method. This process is technically simple and reliable.
To understand the biophysics of occlusive blood flow it is necessary to have at least its hypothetical model. We propose to study the model ‘living body–mechanic system’. It can help to define the real biophysical processes. In this case the model is represented by the ‘artery–cuff’ system.
Electronic converters quite accurately register the processes taking place in the system. However different existing theories of biophysical processes give ambiguous characteristic of the criteria of arterial and occlusive pressure balance [3]. This prevents the provision of electronic arterial pressure measuring instruments with the corresponding metrology. Practically metrology of the indirect method of arterial pressure measurement does not exist.
Although the problem is quite serious we will try to study it. Let us consider the biophysical phenomena in the system of the proposed ‘artery–cuff’ hypothetical model in the process of indirect arterial pressure measurement [4].
Figure 1 shows the simplified version of this model. For convenience only a half of the cuff is shown, it is conventionally in contact with the artery. Pulsating blood flow contacting with the cuff influences it which is recorded in the form of the corresponding signals.
-
a. beginning of phase 1;
-
b. end of phase 1, beginning of phase 2;
-
c. transitory moment of phase 2;
-
d. end of phase 2, beginning of phase 3;
-
e. the first inflection moment in phase 3;
-
f. the second inflection moment in phase 3.
-
→ travel direction of the arterial pressure wave;
-
--→ changed travel direction of the arterial pressure wave influenced by the occlusive pressure.
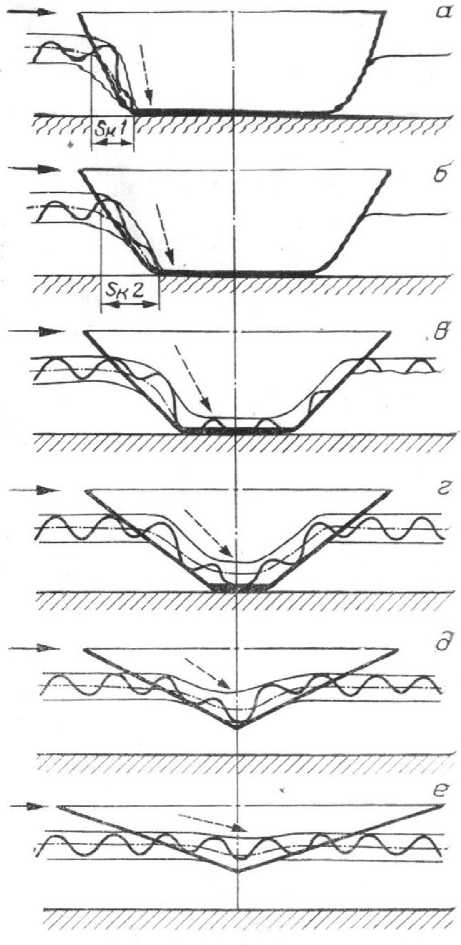
Figure 1. Changes in the ‘artery–cuff’ contact profile during different phases of arterial pressure measurement.
Figure 2 shows the synchronous record of decompression occlusive pressure. The oscillogram (Fig.2, b) is received by means of filtration in the frequency band and increase of the oscillations which exist against the background of occlusive pressure as pulsations with small amplitudes (Fig.2, a). Several heart cycles of the oscillogram and its derivatives can be more closely seen in Fig.3. The extreme values of one cardiac cycle and the corresponding derivatives are marked by points 1, 2 and 3.
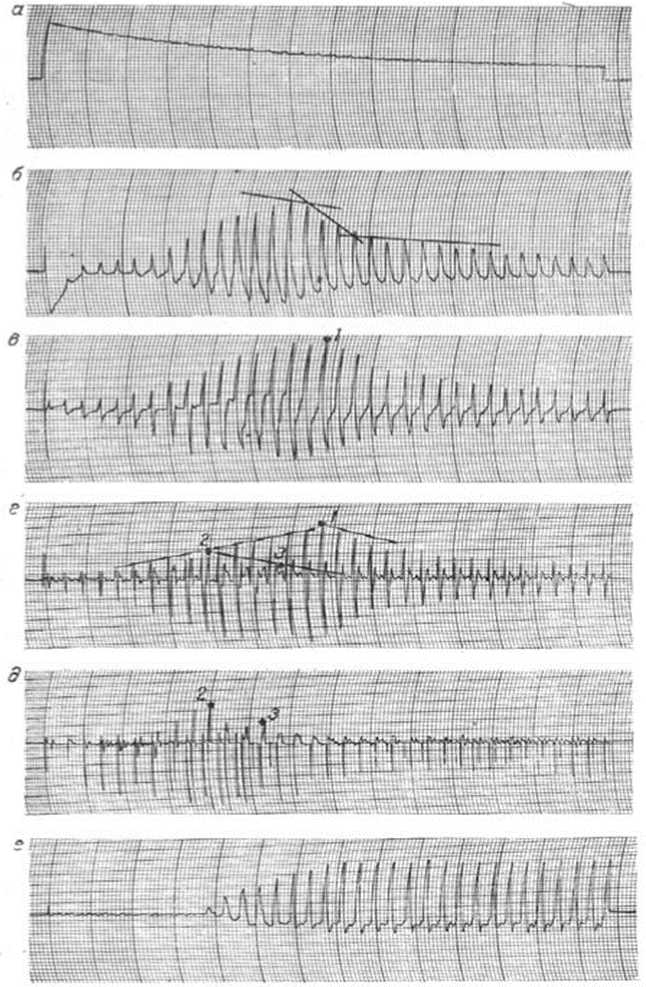
Figure 2. Synchronous record of decompression occlusive blood pressure (a); oscillogram of first-order derivative (b); oscillogram of second-order derivative (c); oscillogram of the part of the second derivative (d); oscillogram of the plethysmogram (e). The explanation is to be found in the text

Figure 3. Synchronous record of several cardiac cycles in the first phase of occlusive pressure (a); oscillogram (b); first-order derivative (c); second derivative (d); part of the second derivative (e) and photoplethysmogram (f). 1, 2, 3 are extreme values of one cardiac cycle and their corresponding derivatives
In the process of modulation of blood flow by occlusive pressure additional characteristic vessel impedance is needed. Its value is calculated in compliance with the formula:
Z = Pi^
S where: ρ – blood density; c – arterial pressure wave velocity; S – vessel area.
Increase of the additional characteristic vessel impedance causes the appearance of standing wave proximal the occlusive place. Designed in such a manner interference pattern is registered by the cuff against the background of the occlusive blood pressure (see Fig. 2, a).
We should mention that reflected waves emergence in physiological blood flow is considered from a perspective of characteristic impedance disagreement in vessel branching and curving points [2]. In scientific literature this approach is based on research in rigid pipes imitating blood vessels. The received results are not proved by the experiments over the living bodies [3]. Theoretic calculations of the arterial wave reflection level in case of vessel branching for physiological blood flow can be found in [2]. It is marked that even in case of 10% mismatch of the vessel impedances which significantly exceeds the real one, the reflected waves are imperceptible and can not considerably influence the falling pressure wave. Scientific literature does not provide the investigation of the process in case of local increase of the characteristic vessel impedance which cuff occlusion under condition of arterial pressure measurement is. Thus, the study of the phenomena in case of maximum impedance change range arouses interest.
Deviation in extreme points amplitude by the falling wave is characteristic for interference [5]. This phenomenon is presented on the second derivative (see Fig. 2,d; 3,d).
For convenience we shall divide the process of arterial pressure measurement into three phases (see Fig. 1).
During the first phase (see Fig.1, a, b) the occlusive pressure exceeds the systolic pressure and the characteristic impedance is maximum. In case of decompression in one phase it remains constant. Increase of the ‘cuff-artery’ contact area leads to cuff elasticity growth (see Fig. 1, a, b). As a result the amplitudes of the recorded oscillations on the oscillogram rise (see Fig. 2, b). Herewith the deviations of the extreme points remain maximum. This fact is proved by the first and second derivatives character (see Fig. 2, c, d). Distal of the occlusion place the arterial pressure oscillations are not to be found (see Fig. 2, f).
The second measurement phase starts from the moment of occlusive and systolic pressure balance when the oscillating part of the arterial pressure wave begins to recover distal of the occlusion place (see Fig., b, c; Fig.2, f) and finishes at the moment of occlusive and systolic pressure balance (see Fig.1, d; Fig.2, b, d).
There exist two characteristic features of this phase. Firstly, the elasticity and area of the ‘artery–cuff’ contact continue to increase when the occlusive pressure falls. As a result condition for continuous oscillation amplitudes growth on the oscillogram is created.
Secondly, characteristic impedance remains maximum for the arterial pressure values that are lower than those of the occlusive pressure. For the values that exceed the occlusive pressure ones the impedance is proportional to difference of the current occlusive and systolic pressure values. This fact is related to the alteration of the straight-line travel direction of arterial pressure wave influenced by the occlusion (see Fig.1). The reflected wave amplitude will decrease proportionately with the decrease of the vessel characteristic impedance for the arterial pressure wave layers the values of which exceed the occlusive pressure. This will lead to decrease of the corresponding layers amplitude offset against the overall interference background. As a result offset of the indicated extreme points will proportionally decrease.
For the described process of layer-by-layer vessel characteristic impedance alteration for the arterial pressure falling waves the corner of triangle (marked with 2 in Fig.2, d, e) with a definite error can serve as a criterion for systolic pressure measurement. In Fig. 2 ,e a part of the second derivative shown in Fig.2 ,d can be seen. Point 2 characterizes the amplitude offset of the dicrotic oscillogram part in case of interference of falling and reflected arterial pressure waves during the occlusion. Figure 3 shows that point 2 being extreme corresponds with the dicrotic oscillogram part.
Along the same line consideration of the extreme values of the oscillogram and its derivatives indicated with 1 and 3 in Fig. 3 enables to mark similar triangles with the corresponding corners (see Fig.2, d).
The triangle corner indicated with point 1 corresponds to the moment of diastolic pressure and occlusive pressure balance (see Fig.1, d and Fig.2, d). At this moment the oscillating blood flow part is fully recovering distal of the occlusion (Fig. 2,f). On the oscillogram the oscillation with maximum amplitude and maximum leading edge steepness which corresponds to the maximum of the first derivative conforms to the described process (see Fig.2, c).
The considered model of biophysical processes enables the pressure measurement of different arterial wave layers according to characteristic maximums of oscillogram derivatives, in particular, systolic and diastolic pressure.
The beginning of the third measurement phase is the moment of diastolic and occlusive pressure balance (see Fig.1, d). This phase is characterized by the two inflections of enveloping oscillogram, defined by the alteration of the cuff shape and elasticity as a result of occlusive pressure fall (see Fig.1, e, Fig.2, b).
For the oscillating part of arterial pressure characteristic impedance is defined only by the alteration of the arterial wave travel direction influenced by the occlusive pressure. At the moment of enveloping oscillogram inflection (see Fig.2, b) the cuff loses its shape rigidness (see Fig.1, d). At the same time characteristic impedance changes rapidly. During the period preceding the second inflection (see Fig.1, f) the cuff takes almost the same shape as it would have without the creation of the occlusive pressure. After the second inflection the cuff perceives the arterial pressure oscillations at the expense of the occlusive pressure. Herewith the cuff elasticity does not change.
The described biophysical phenomena allow concluding that indirect method can be used to measure systolic and diastolic pressure with a definite error in the process of the oscillogram and its derivatives recording. To accomplish this it is necessary to search and record the first oscillogram derivative maximum (see Fig.2,b) and a part of the second oscillogram derivative maximum (see Fig.2, e).
The described process of falling and reflected arterial pressure waves interference is accompanied by turbulence distal of the occlusion place. Let us consider the equation of continuity:
ul - S1 = u2 • S2 = u3 • S3
where: υ1 - stands for velocity proximal of the occlusion place; υ2 - is velocity at the place of occlusion; υ3 - is velocity distal of the occlusion place; S1,2,3 – artery cross-section area at the corresponding places.
Considering the equation of continuity it is possible to state that if S2 at the place of occlusion tends to zero velocity υ2 should tend to infinity. Velocity υ2 in Reynolds number equation defining the interrelation of inertial and viscous forces in the blood flow is found in numerator:
u • d
Re =---
ν where: υ - velocity; d - vessel diameter; ν - kinematic viscosity coefficient.
As velocity υ2 is found in the numerator of the above equation then during the systolic time interval Reynolds number will exceed the value of 2500 which corresponds to turbulence emersion. Turbulence promotes the acoustic noise called Korotkov sounds.
Synchronous record of occlusive decompression pressure is shown in Figure 4. According to considered above criteria of occlusive and arterial pressure balance Korotkov sounds appearance corresponds to the moment of systolic pressure measurement. The peak amplitude of the sounds corresponds to the moment of diastolic pressure measurement and the disappearance of sounds occurs during the second presented inflection of the enveloping oscillogram. The connection of Korotkov sounds disappearance with the moment of their maximum amplitude and the diastolic pressure measurement criterion is possible using the ‘cuff–artery’ contact measurement. To achieve this, the cuff should not bear against the patient’s arm. As a result the second inflection almost matches the peak amplitude and a drastic decrease of the enveloping oscillation and the sounds is registered.
Measurement criteria of systolic and diastolic arterial pressure based on recording by the oscillogram derivative extreme point
The peculiarities of oscillogram recording
In the first part of this chapter the biophysical processes forming the oscillogram were considered. It was proved that the oscillogram is a reflection of arterial pressure waves interference process in the place of artery occlusion. The process of falling and reflected waves interference modulated by external pressure can be investigated only with the help of mathematical derivatives. In this case we used the first-order and second-order derivatives. We should notice that the first derivative reflects the process of the object alteration. The extreme points of the first derivative always indicate the moment of transformation of an object’s state or its function to a different state or function. The second derivative is a result of interaction of the object or its functions with ambient environment.
Here the extreme points are also informative. But their amplitude indicates the end result i.e. the fact of interaction and its result.
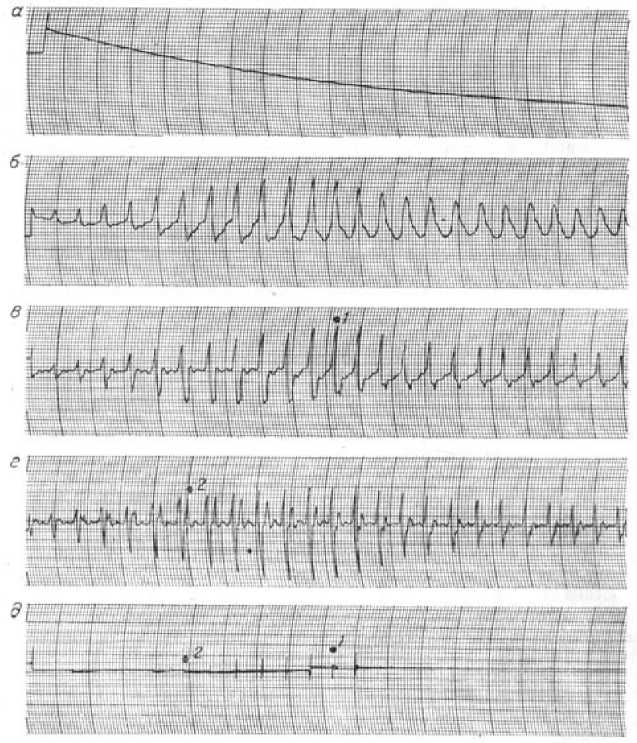
Figure 4. Synchronous record of decompression occlusive pressure (a); oscillogram (b); the first derivative (c); the second derivative (d) and Korotkov sounds (e)
In the process of investigation the authors faced an interesting problem. We would name it “take something – not known what”. The fact is that both the engineers and the doctors worked on the development of ECG and other bioelectric signals recording. The engineers tried to provide the doctors with the instruments that show “a fine signal”. They were unaware of the degree of distortion during the filtration process and its difference from the real processes. Our research showed that these distortions are significant and reach 25% [5]. This situation could be improved but the received distorted ECG have for a long time served for creation of cardiological standards in diagnostics. Moreover, the theory which was formed had many “blank spaces”.
That is why here we shall reveal a secret. It is essential that the lower cut-off band in the filter should be equal:
FH = 0,35 Hz.
The signal upper this value is differentiated, the signal lower the value is integrated. If the frequencies differ from the indicated ones it would be very difficult to understand what happens in the occlusive blood flow. The same could be said about rheography.
For the engineers we should note that for the filtration process the rate of signal increase is important as well. Different ECG phases have different amplitudes. In case of incorrect choice of filtration band R deflection can be integrated increasing the RS phase to a considerable extent. This process is influenced by the upper cut-off band. Inserting this phase time in G.Poedintsev–O.Voronova hemodynamics equation we shall obtain “fantastic” results which will be different from the real results.
Criteria of systolic and diastolic arterial pressure measurement
The considered above criteria of systolic and diastolic arterial pressure measurement using the oscillometric method and Korotkov sounds method allow to obtain identical values. But these methods have considerable discrepancies concerning diastolic pressure measurement. When the oscillometric method is used diastolic pressure is measured by the maximum of the first oscillogram derivative. When Korotkov sounds method is used diastolic pressure is measured by the sounds disappearance. Figure 5,c shows these discrepancies in points 2 and 3.
-
1. The oscillogram is recorded (Fig.5, b). At the beginning of its amplitude’s increase comparator threshold is selected. Thus, systolic pressure is recorded.
-
2. Diastolic pressure is recorded when the oscillogram amplitude decreases below the comparator threshold.
-
3. In automatic devices the oscillogram resembles the first derivative. It occurs due to minimization of transient phenomena influence in the process of pumping pressure into cuff.
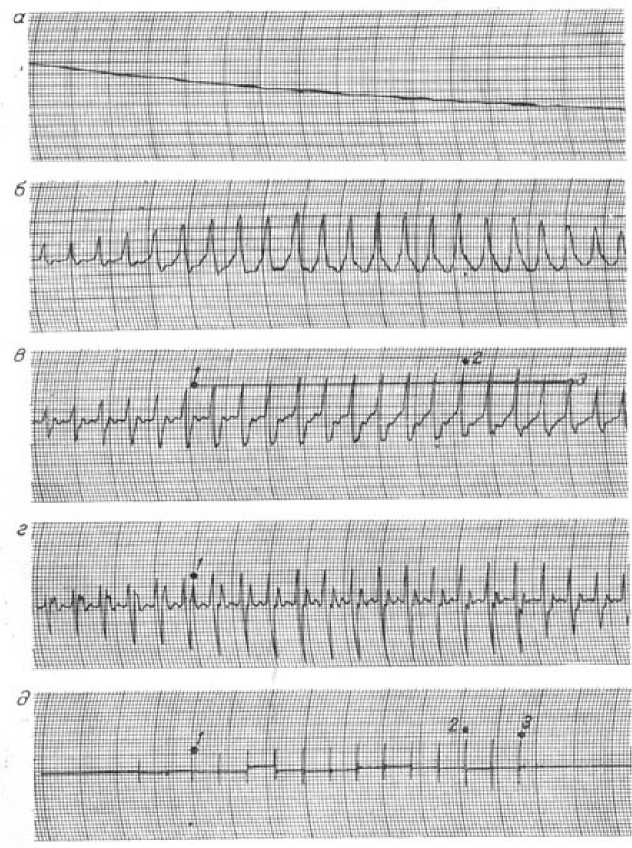
Figure 5. Diastolic pressure measurement using the moment of Korotkov sounds disappearance: a – occlusive pressure; b – oscillogram; c –first-order derivative;
d – second derivative; e – Korotkov sounds
Thus, all automatic machines with comparator threshold of signal amplitude do not measure diastolic pressure accurately. The measuring instrument developed by the authors of the present research work makes it possible to solve the problem in the following way. Figure 6 shows the signal records received from the commercially produced instrument. These signals are used to record systolic and diastolic pressure by derivatives maximum. After the measurement 15 mmHg are deducted from diastolic pressure value.
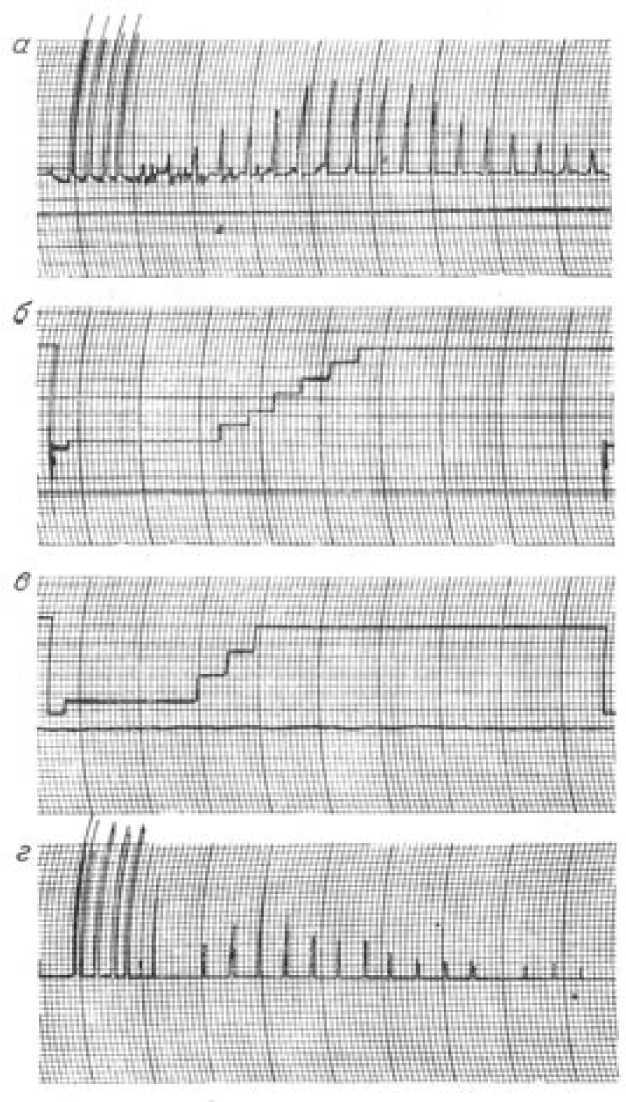
Figure 6. Synchronous record of processed oscillogram derivatives and signals of amplitudes relation analyses unit. The amplitudes were extracted from the commercially produced measuring instrument based on arterial pressure waves interference. a –first-order derivative; b – search of diastolic pressure measurement criterion; c - search of systolic pressure measurement criterion; d –second-order derivative
The end result will correlate with Korotkov sounds method and will not leave the doctors asking questions. Thus, the measuring instrument provides two variants of the measurement results presentation: 1) systolic pressure and average pressure (average pressure conforms to the time of maximum of the first derivative and maximum sounds amplitude i.e. true diastolic pressure (point 2 on Fig.5,b); 2) systolic pressure and diastolic pressure (diastolic pressure conforms to the second inflection of the enveloping oscillogram or the moment of Korotkov sounds disappearance (point 3 on Fig. 5,b). It is close to the value of comparator threshold in the measuring instruments produced by different firms.
Conclusion
-
1. The conditions of local increase of vessel characteristic impedance leading to interference of falling and reflected arterial pressure waves are considered. Criteria of systolic and diastolic pressure measurement compared with the used in practice Korotkov sounds are revealed.
-
2. The described method enables to measure systolic and diastolic arterial pressure accurately.
-
3. Commercially produced automatic arterial pressure measuring instruments using comparator functioning as criteria for diastolic arterial pressure measurement during oscillogram amplitude decrease do not measure diastolic pressure accurately; they rather show the value which is 15 mmHg lower than the true value.
Acknowledgements
The problem of arterial pressure measurement is given much attention in the world scientific literature. Specialized magazines are published. Scientific subpanels formed at symposiums study the results of research in this scientific field. Having studied in Radiotechnical institute the authors of the present research work took interest in the popular at that time idea of computerization of arterial pressure measurement process. In the 1970s the problem of pressure measurement in the place of brachial artery and temporal artery was set. Their magnitude relation should be equal to two. This coefficient was supposed to indicate good physical fitness of the sportsmen. The young authors started to work enthusiastically. We could not know then that the study of this problem would become a foundation for considerable scientific research the authors would devote their life to. A group of professionals would carry on research and develop medical instruments. Many of the researchers would found their schools of thought and achieve good results in business. Thirty years later the authors would receive a diploma for scientific discovery “Objective laws of arterial pressure waves propagation in blood-vessels in the areas of their impedance local increase”.
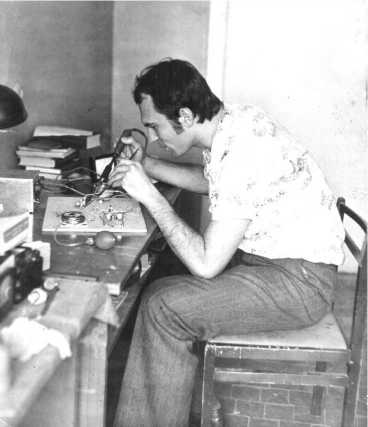
Figure 7. Mikhail Y. Rudenko is in the hostel soldering the pressure–voltage transformation junction. The strain indicator is glued to the shoe cream box. Thus, the Big Science started (1978).
An outstanding school of thought with distinguished scientists was formed. Over the past twenty years more than 150,000 copies of books were published. There emerged a need in system research of human biophysics. All of the research works found practical use.
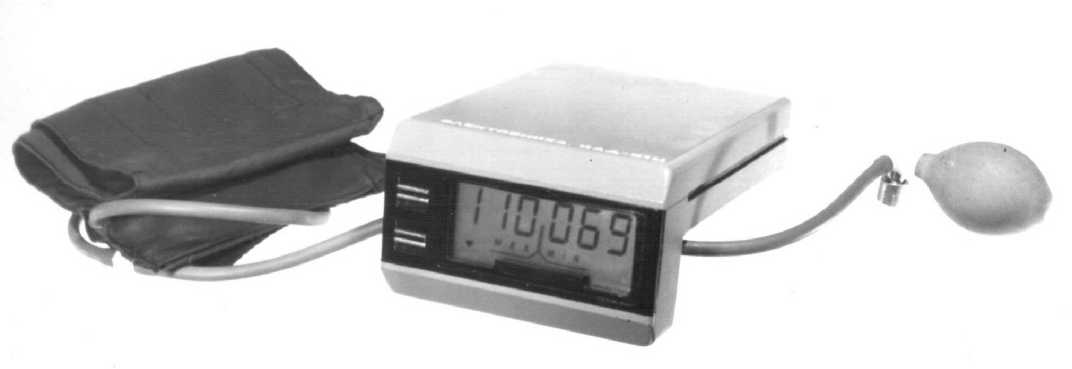
Figure 8. The first in the world commercial instrument for indirect arterial pressure measurement based on artery pressure waves interference (1986).


Российская академия естественных наук
Международная академия авторов научных открытий и изобретений Международная ассоциация авторов научных открытий
ДИПЛОМ № 290
на открытие
«ЗАКОНОМЕРНОСТЬ РАСПРОСТРАНЕНИЯ ВОЛН АРТЕРИАЛЬНОГО ДАВЛЕНИЯ
В КРОВЕНОСНЫХ СОСУДАХ В ОБЛАСТЯХ ЛОКАЛЬНОГО УВЕЛИЧЕНИЯ ИХ ИМПЕНДАНСА»
Международная академия авторов научных открытий и изобретении на основании результатов научной экспертизы заявки на научное открытие № А-358 от 5 июля 2005 г.
ПОДТВЕРЖДАЕТ УСТАНОВЛЕНИЕ НАУЧНОГО ОТКРЫТИЯ
«ЗАКОНОМЕРНОСТЬ РАСПРОСТРАНЕНИЯ ВОЛН
АРТЕРИАЛЬНОГО ДАВЛЕНИЯ
В КРОВЕНОСНЫХ СОСУДАХ В ОБЛАСТЯХ
ЛОКАЛЬНОГО УВЕЛИЧЕНИЯ ИХ ИМПЕНДАНСА»
Формула открытия
Установлена неизвестная ранее закономерность распространения волн артериального давления в кровеносных сосудах в областях локального увеличения их импенданса. заключающаяся в том, что при прохождении волн артериального давления для части отраженной волны происходит образование устойчивой интерференции, а другая часть проходит область импенданса без изменения, причем величина отраженной части волны прямо пропорциональна величине импенданса.
Приоритет открытия
14 апреля 1986 г. - по дате поступления в редакцию статьи «Биофизические явления в системе кровообращения при косвенном измерении артериального давления и анализ приборов для его измерения» (журнал «Медицинская техника», № 5, 1986).
На основании установленных в соответствии с действующим законодательством правовых положений Устава Международная академия авторов научных открытий и изобретений выдала настоящий диплом на открытие «Закономерность распространения волн артериального давления в кровеносных сосудах в областях локального увеличения их импенданса»
Авторы открытия:
РУДЕНКО МИХАИЛ ЮРЬЕВИЧ АЛЕКСЕЕВ ВЛАДИМИР БОРИСОВИЧ ЗЕРНОВ ВЛАДИМИР АЛЕКСЕЕВИЧ МАЦЮК СЕРГЕЙ АЛЕКСЕЕВИЧ
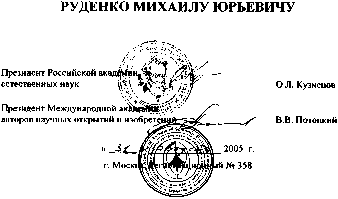
Figure 9. The documents of the official registration of scientific discovery “Objective laws of arterial pressure waves propagation in blood-vessels in the areas of their impedance local increase” (2005).
Statement on ethical issues
Research involving people and/or animals is in full compliance with current national and international ethical standards.
Conflict of interest
None declared.
References Biophysical phenomena in blood flow system in the process of indirect arterial pressure measurement
- Savitsky N.N. Biophysical principles of circulation and clinical methods of hemodynamic study. 3-d ed. Leningrad, 1974.
- Caro, C.; Padley, T.; Shroter, R.& Sid,W. (1981). Blood Circulation Mechanics. -Mir. М.
- Eman А.А. Biophysical principles of arterial pressure measurement. Leningrad, 1983.
- Rudenko, M.; Voronova, O.; & Zernov, V. (2009). Study of Hemodynamic Parameters Using Phase analyses of the Cardiac Cycle. Biometrical Engineering. Springer New York. ISSN 0006-3398 (Print) 1573-8256 (Online). Volume 43, Number 4/July 2009. P. 151-155.
- Rudenko, M.; Voronova, O.; & Zernov, V. (2009). Theoretical Principles of Heart Cycle Phase Analyses. Fouqué Literaturverlag. ISBN 978-3-937909-57-8, Frankfurt a/M. München -London -New York.
