Blackout Estimation by Neural Network

Author: Mohammad Reza Salimian, Mohammad Reza Aghamohammadi
Journal: International Journal of Intelligent Systems and Applications(IJISA) @ijisa
Article in issue: 7 vol.8, 2016.
Free access
Cascading failures play an important role in creation of blackout. These events consist of lines and generators outages. Online values of voltage, current, angle, and frequency are changing during the cascading events. The percent of blackout can be estimated during the disturbance by neural network. Proper indices must be defined for this purpose. These indices can be computed by online measurement from WAMs. In this paper, voltage, load, lines, and generators indices are defined for estimating the percent of blackout during the disturbance. These indices are used as the inputs of neural networks. A new combinational structure of neural network is used for this purpose. Proposed method is implemented on 39-bus New-England test system.
Cascading failures, Neural network, Blackout, stability, Distance relay
Short address: https://sciup.org/15010838
IDR: 15010838
Text of the scientific article Blackout Estimation by Neural Network
Published Online July 2016 in MECS
Cascading failures are the most important reason of blackout. These failures can start by a single outage or short-circuit. Lines and generators are exited after initial fault. Cascading outages of lines and generators may happen in long-term or short-term duration. Estimation of blackout percent is useful for performing suitable remedial actions like islanding for decreasing blackout. Different intelligent technique like decision tree [1-5], and neural network [6-12] can be used for this purpose. First, proper indices must be defined for estimating the situation of power system during the disturbance. These indices show the probability of lines and generators outage during the disturbance. Different vulnerability indices are presented in the literatures [13-16]. Power [17], stability [18], and Voltage [19] indices are defined in papers.
In [19], voltage stability index is defined by using the differential equations of power system. This index shows the probability of voltage collapse against the cascading failures. Voltage index is computed by using the network model. Therefore, it cannot be used for online estimation of blackout.
In [20], graph model of network is used for vulnerability assessment against the cascading failures. Vulnerability indices are defined by using the number of connected nodes and the distance of different nodes.
These indices just show the connectivity of power system and not suitable for online calculations.
In [21], some indices are defined for estimating the vulnerability of power system against the cascading failures. Also, remedial actions are defined for decreasing the risk of cascading failures. These indices are computed by offline calculation. Therefore, these cannot be used for online assessment of power system.
In [22], power system losing is used for vulnerability assessment. A losing index is defined for this purpose. This index includes of the losing power before and after clearing fault. This index is computed by ANN. For this, different values of index are trained to ANN. This index just considers power system losing.
In [23], Decision tree is used to predict the loss of synchronism for any critical contingency. Also, DT is used for designing a controlled islanding scheme. Instability prediction is performed after the initiating fault. Then, the islanding strategy is armed for preventing cascading outages. This method is demonstrated on the Entergy system, which have 2100 buses, and 240 generators.
Ref [24] presents a new approach for identifying cascading failure as soon as the initiating. Also, controlled Islanding and Load Shedding are performed to prevent Cascading Outages. This method determines the island boundaries and the amounts of load shedding. According to the simulation results, cascading outages can be prevented by the controlled islanding.
In [25], decentralized load shedding and islanding scheme is presented for mitigating cascading events. The load shedding scheme allow to shed low-priority load for mitigation the disturbance. The proposed scheme is demonstrated on the IEEE 118-bus, 19-generator test system. The effectiveness of proposed method is verified for different cascading failures.
In [26], a new islanding scheme is presented for preventing cascading events. This scheme consists of a criteria based approach for determining the proper time for controlled islanding. Also, a load/generation shedding approach is presented for mitigating blackout. The proposed method is tested by the blackout of June 20, 1998 in the BPDB grid system.
In [27], a new unified synchrophasor-based controlled islanding scheme is presented for preventing blackout created by cascading events. For this purpose, a separation risk index is presented to determine the proper separation time. The proposed method is demonstrated on a 179-bus power system.
The above mentioned methods and indices are usually computed by offline calculations and are not suitable for online estimation of blackout. For this, proper indices must be defined for estimating blackout during the disturbance.
In this paper, different indices are presented for monitoring the situation of power system during the disturbance. These indices are computed by online measurement from WAMs. Online measurements consist of voltage of buses, current of lines, angle and frequency of generators. The vulnerability indices are defined by these values. These indices show the potential of blackout during cascading failures and can be used for estimating the percent of blackout. Voltage, load, lines, and generators indices are defined in this paper for this purpose. Lines and generators indices show the probability of lines and generators outages during the cascading failures and can be used for estimating the percent of blackout. A combinational structure of neural network is used for this purpose. The size of blackout is divided into two parts. Part 1 and 2 are greater than 10% and 50%, respectively. Two neural networks are used for this purpose. Each neural network is used for estimating a specified range of blackout percent. Vulnerability indices are used as the inputs of neural networks. Simulation of cascading failures is performed on 39-bus New-England test system.
The summary of paper’s content is as follows. In section II, The proposed blackout estimator is declared. The combinational structure of neural network is explained in this section. Also, the vulnerability indices of power system that consist of voltage, load, lines and generators indices are defined in this section. Simulation results on 39-bus New England test system is declared in section III. Two blackout scenarios are presented in this section for showing the ability of neural network blackout estimator. The conclusion is declared in section IV.
-
II. The Proposed Blackout Estimator
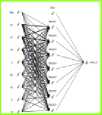
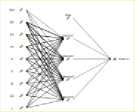
The proposed method is based on the estimation of blackout by neural networks using vulnerability induces. The structure of the proposed scheme for estimating blackout is shown in Fig. 1. The proposed scheme consists of two blackout estimator neural networks (BENN). The two stages estimator scheme can predict different ranges of blackout size. BENN1 and BENN2 estimate the blackout size in term of percentage for 10% and 50%, respectively. The input of BENNs consists of vulnerability indices of power system. Vulnerability indices consist of voltage, load, lines, and generators indices. Voltage index shows the average voltage deviations in power system. Load index calculates the percent of blackout during the disturbance. Lines and generators indices show the probability of lines and generators outages due to the action of protecting relays. Two consecutive time values of indices are adopted as the input vector of the neural networks as shown in equation (1). It is because; two consecutive values of indices can be used as a sign to show the system potential for moving toward blackout.
Input = [ VI ( t ), LD ( t ), LI ( t ), GI ( t ), VI ( t - ∆ T ),
LD ( t -∆ T ), LI ( t -∆ T ), GI ( t -∆ T )] (1)
VI is voltage index, LD is load index, LI is lines index, GI is generators index, and Δ T is the time interval between consecutive values of indices.
The outputs of neural networks are defined as 0 or 1. When the output becomes 1, show that the predicted percentage of blackout is greater than the threshold of neural networks which are defined as 10% and 50%. Proper define of vulnerability indices is very critical in this approach. In this paper, different indices are defined as follows.
-
A. Voltage index
Voltage deviations may lead to the action of protecting relays and voltage collapse. Voltage index is defined for computing the average voltage deviations in power system as below:
∑ \ Vi - 1
VI = i
NBus (2)
-
V is the voltage amplitude of bus i.
N is the number of buses.
-
B. Load index
Load shedding due to under frequency/voltage problems and uncontrolled islanding may lead to blackout. Load index shows the percent of blackout in power system:
∑ J ( P i 0 - P i ) 2 +( Q i 0 - Q i ) 2
LD = i
∑ J ( P i 0 ) 2 +( Q i 0 ) 2 (3)
i
P is the measured active power of ith load, Q is the measured reactive power of ith load, P 0 is the initial value of ith loads' active power which is measured before disturbance, Q 0 is the initial value of ith loads' reactive power.
= t = t + Δt
Compute Indices
Wide Area
Measurments Input = [ VI ( t ), LD ( t ), LI ( t ), GI ( t ),
VI ( t -Δ T ), LD ( t -Δ T ), LI ( t -Δ T ), GI ( t -Δ T )]
BENN1
Blackout < 10%
No
Out1 = 1
Yes
Blackout < 50%
BENN2
Blackout ≥ 50%
No
Yes
Fig.1. The structure of the blackout estimator scheme.
-
C. Lines Index
Lines index shows the probability of lines outage during the disturbance. Lines outages paly an important role in cascading failures. Lines are usually protected by distance relays. If the seen impedance by distance relays enters to the operational area of relay, the line will be separated from the system. Three zones of distance relays are shown in Fig. 2.
Zone 3 is the biggest zone of distance relay. For this, power swings may enter to this zone and lead to the action of distance relay. Also, overloading may be detected as fault by relay. Lines index is defined for showing the probability of acting distance relays by considering the apparent power of each line:
∑ LI j × S j
LI = j
∑ S j j
LIj =
j(( Z / 2) cos ϕ ) + (( Z / 2) sin ϕ )
cos ϕ j - ( Z /2) cos ϕ ) + ( Zj sin ϕ j - ( Z /2)sin ϕ )
( Z 3 /2)
cos ϕ - ( Z / 2) cos ϕ ) + ( Z sin ϕ - ( Z / 2) sin ϕ )
Z j ∠ ϕ j = Vj
Z is the seen impedance magnitude of line j, ϕ is the seen impedance angle of line j, V and I are the voltage and current of line j, S is the apparent power of line j,
Z is the impedance magnitude of zone 3, and ϕ is the impedance angle of zone 3.
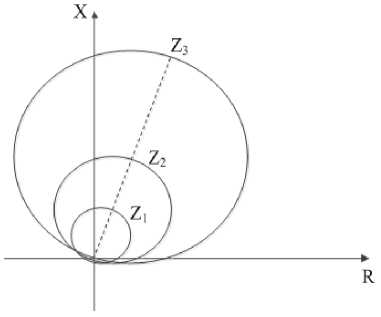
Fig.2. Three zones of distance relays.
-
D. Generators Index
Generators index shows the probability of generators outage during the disturbance. Generators tripping are usually performed for two reasons: 1) Instability 2) Under/over frequency limits. Instability happens by increasing the differences between generators' angles. When the differences between each generator and infinite-bus become greater than 180 degree, the generator becomes unstable [28]. The maximum permitted range of frequency deviations is 2.5 hz in 50hz system. The larger values of frequency deviations are harmful for generators. For this, if the deviations of generators' speed become greater than maximum permitted value, the generator is separated by under/over frequency relays. Generators index is defined for showing the probability of generators tripping in power system. This index considers both instability and frequency problems of generators and computed as:
GI =
Z M^ GI,
Z M, i
GIt = max


M{ is the moment of inertia of generator i, A - is the angle of generator i, dre, is the angle of reference machine, f is the frequency of generator i, f is the
nominal frequency of power system, Afmax is the maximum permitted value for frequency deviations which is considered as 2.5 hz.
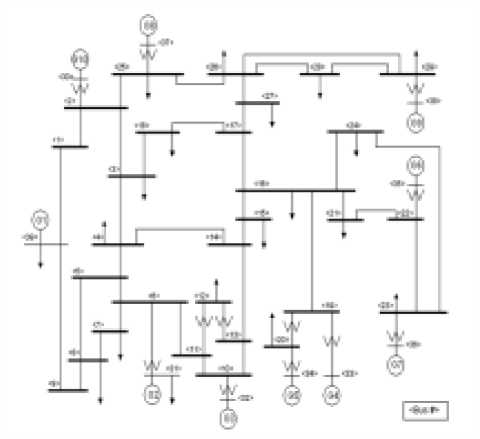
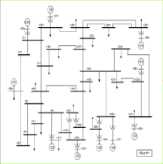
Fig.3. 39-bus New-England test system
-
III. Simulation Results
The proposed method is implemented on 39-bus New-England test system shown in Fig. 3. Distance relays of all lines, out-of-step and under/over frequency relays of all generators, and under frequency/voltage load shedding relays are modeled on test system by Power Factory® (Digsilent) software. System data is from [29-31]. The time interval between the consecutive indices within input vector of BENNs is considered as 1 sec ( A T = 1 sec ). These indices are updated every 100 ms. (
At = 100 ms).
-
A. Tra n ng BENN
In order to provide training data, nine load levels (5764, 5955, 6143, 6335, 6524, 6716, 6905, 7250 and 7595 MW) are considered. Short-circuit as single contingency on all 34 lines are considered as initial fault. By evaluating 81 samples of indices for each disturbance scenario, totally 24786 ( 24 7 8 6 = 9t 3 4 ) indices using Digsilent
programming language (DPL) are provided from which 22032 and 2754 samples are used for training and testing BENNs respectively.
BENNs are trained by using SPSS® Modeler software [32]. The accuracy of BENNs is validated by test samples as shown in Table 1 and 2.
B. Test Scenar o A
In order to demonstrate the detailed performance of the proposed BENNs, a critical scenario including load level 6524 MW with a three-phase fault on line 22-21 as initial event is investigated. For this scenario, the chain of cascading outages created by protective relays is presented in Table 3. The sequence of cascading failures starts by an initial short-circuit on line 22-21 at 1 sec. Line 22-21 is opened by distance relay at 1.088552 sec.
Table 1. Performance of BENN1
|
Category |
samples |
Percent |
|
Correct |
2,714 |
98.55% |
|
Wrong |
40 |
1.45% |
|
Total |
2,754 |
100% |
Table 2. Performance of BENN2
|
Category |
samples |
Percent |
|
Correct |
2,661 |
96.62% |
|
Wrong |
93 |
3.38% |
|
Total |
2,754 |
100% |
Table 3. Cascading outages (scenario A)
|
No |
Event |
Element |
time (sec) |
|
1 |
Short-Circuit Event |
Line 22-21 |
1 |
|
2 |
Switch Event |
Line 22-21 |
1.088552 |
|
3 |
Switch Event |
Line 24-23 |
1.641853 |
|
4 |
Switch Event |
Line 21-16 |
1.72162 |
|
5 |
Switch Event |
Line 5-4 |
1.722423 |
|
6 |
Switch Event |
Line 15-14 |
1.722466 |
|
7 |
Switch Event |
Line 23-22 |
1.812747 |
|
8 |
Switch Event |
Line 24-16 |
1.946379 |
|
9 |
Switch Event |
Line 18-3 |
2.023207 |
|
10 |
Switch Event |
Line 14-13 |
2.02866 |
|
11 |
Switch Event |
Line 19-16 |
2.05543 |
|
12 |
Switch Event |
Line 27-26 |
2.158284 |
|
13 |
Generator tripping |
Gen 6 |
2.200881 |
|
14 |
Switch Event |
Line 4-3 |
2.75131 |
|
15 |
Switch Event |
Line 3-2 |
2.751404 |
|
16 |
Switch Event |
Line 9-8 |
3.269746 |
|
17 |
Switch Event |
Line 8-7 |
3.323142 |
|
18 |
Switch Event |
Line 8-5 |
3.352067 |
|
19 |
Switch Event |
Line 2-1 |
3.459503 |
|
20 |
Generator tripping |
Gen 5 |
3.4921 |
|
21 |
Generator tripping |
Gen 4 |
3.5021 |
|
22 |
Generator tripping |
Gen 3 |
4.557294 |
|
23 |
Generator tripping |
Gen 2 |
4.582294 |
|
24 |
Generator tripping |
Gen 8 |
5.454891 |
|
25 |
Generator tripping |
Gen 10 |
5.527488 |
|
26 |
Generator tripping |
Gen 9 |
5.760085 |
Then, the other lines are opened by entering the impedance trajectory into the third zone of distance relays. As it can be seen the sequence of cascading failure for this scenario consists of 25 events following the initial event. Impedance trajectory of distance relays of lines 2221, 19-16, 2-1 and 3-2 which are tripped due to relay activation are shown in Figs. 4-7, respectively. As it can be seen in Figs. 4-7, the apparent impedance of lines enter to the zone characteristic of distance relays and lead to the separation of lines. Generators tripping are performed by protective relays due to under/over frequency and instability problems. Finally the network is separated into two islands as shown in Fig. 8. The variation of voltage, load, lines, and generators indices during the cascading failure are shown in Fig. 9. Outputs of BENNs are shown in Fig. 10. This scenario has led to 5110 MW (78.33%) blackout. As shown in Fig. 10, the outputs of BENN1 and BENN2 are activated to 1 at 2 sec. and 2.2 sec, respectively. Therefore, the severity of blackout is correctly estimated among 50% to 100% by the proposed blackout estimator neural networks.
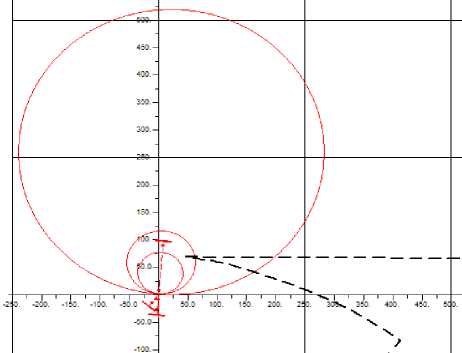
Fig.6. Impedance trajectory of distance relay line 2-1 (scenario A)
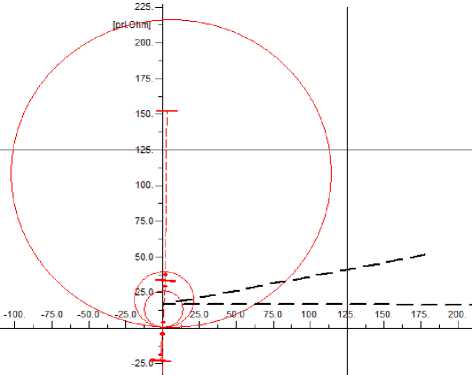
Fig.4. Impedance trajectory of distance relay line 22-21 (scenario A)
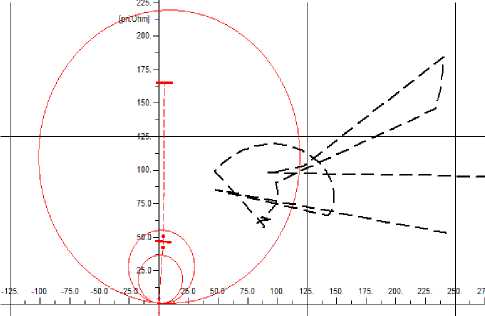
Fig.5. Impedance trajectory of distance relay line 19-16 (scenario A)
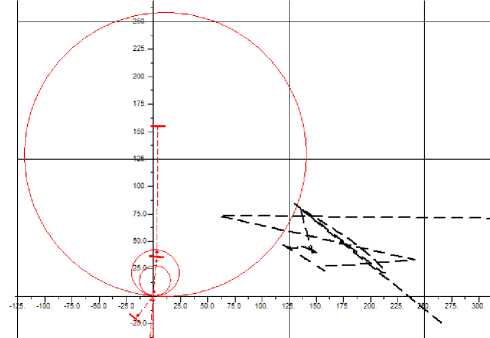
Fig.7. Impedance trajectory of distance relay line 3-2 (scenario A)
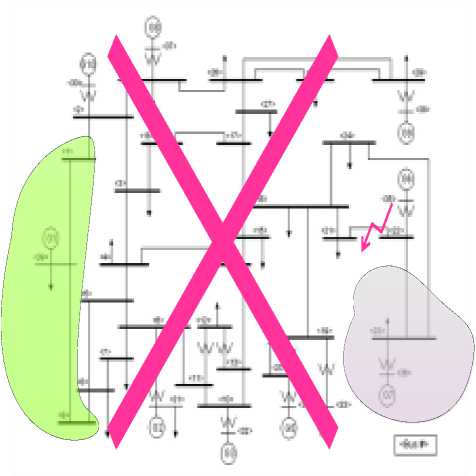
Fig.8. Uncontrolled islands following cascading failure (scenario A)
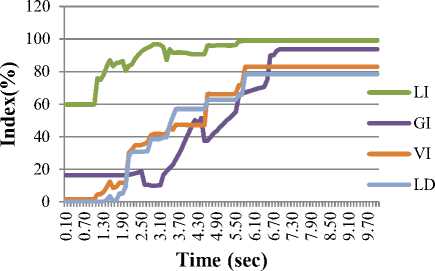
Fig.9. Variation of indices during disturbance (scenario A)
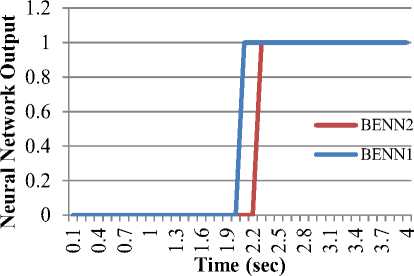
Fig.10. Outputs of neural networks (scenario A)
-
C. Test Scenario B
In order to demonstrate the detailed performance of the proposed BENNs, another scenario including load level 5955 MW with a three-phase fault on line 19-16 as initial event is investigated. For this scenario, the chain of cascading outages created by protective relays is presented in Table 4. The sequence of cascading events starts by an initial short-circuit on line 19-16 at 1 sec. Line 19-16 is opened by distance relay at 1.088548 sec. Then, the other lines are opened by entering the impedance trajectory into the third zone of distance relays. As it can be seen the sequence of cascading failure for this scenario consists of 14 events following the initial event. Impedance trajectory of distance relays of lines 1916, 22-21, 21-16 and 16-15 which are tripped due to relay activation are shown in Figs. 11-14, respectively. As it can be seen in Figs. 11-14, the apparent impedance of lines enter to the zone characteristic of distance relays and lead to the separation of lines. Tripping of generators 4, 5, and 6 are performed by protective relays due to under/over frequency and instability problems. Finally the network is separated into three islands as shown in Fig. 15. The variation of voltage, load, lines, and generators indices during the cascading failure are shown in Fig. 16. Outputs of BENNs are shown in Fig. 17. This
scenario has led to 1620.35 MW (27.21 %) blackout. As shown in Fig. 17, the output of BENN1 is activated to 1 at 2.3 sec and the output of BENN2 remains zero. Therefore, the severity of blackout is correctly estimated among 10% to 50% by the proposed blackout estimator neural networks.
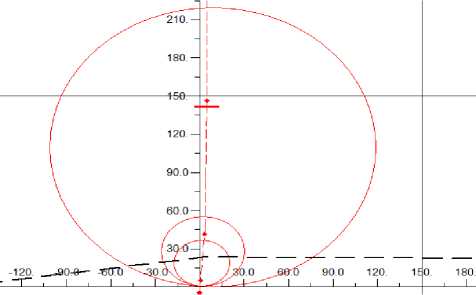
Fig.11. Impedance trajectory of distance relay line 19-16 (scenario B)
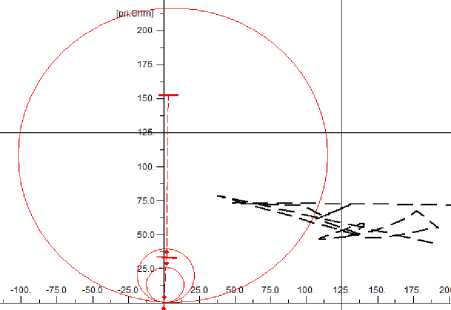
Fig.12. Impedance trajectory of distance relay line 22-21 (scenario B)
Table 4. Cascading outages (scenario B)
|
No |
Event |
Element |
time (sec) |
|
1 |
Short-Circuit Event |
1 |
Line 19-16 |
|
2 |
Switch Event |
1.088548 |
Line 19-16 |
|
3 |
Switch Event |
1.720887 |
Line 24-16 |
|
4 |
Generator tripping |
2.683484 |
Gen 4 |
|
5 |
Generator tripping |
2.698484 |
Gen 5 |
|
6 |
Switch Event |
3.898081 |
Line 15-14 |
|
7 |
Switch Event |
4.622226 |
Line 17-16 |
|
8 |
Switch Event |
4.623277 |
Line 18-3 |
|
9 |
Switch Event |
5.34258 |
Line 22-21 |
|
10 |
Switch Event |
5.342653 |
Line 23-22 |
|
11 |
Switch Event |
5.344237 |
Line 21-16 |
|
12 |
Switch Event |
5.344998 |
Line 16-15 |
|
13 |
Switch Event |
5.345672 |
Line 27-17 |
|
14 |
Switch Event |
5.346472 |
Line 26-25 |
|
15 |
Generator tripping |
6.481666 |
Gen 6 |
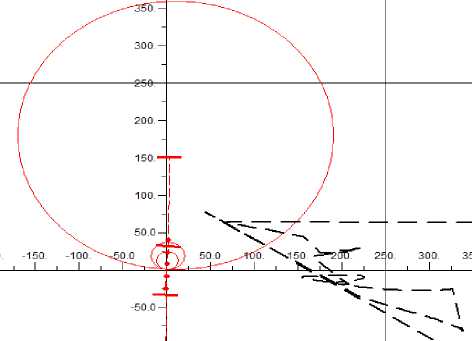
Fig.13. Impedance trajectory of distance relay line 21-16 (scenario B)
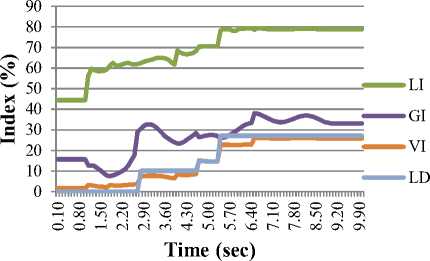
Fig.16. Variation of indices during disturbance (scenario B)
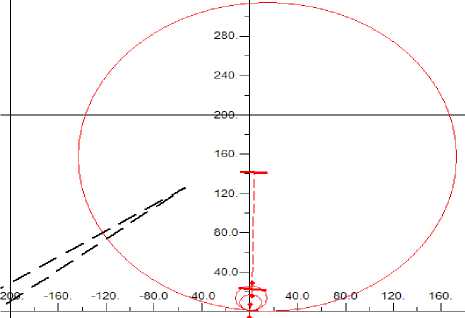
Fig.14. Impedance trajectory of distance relay line 16-15 (scenario B)
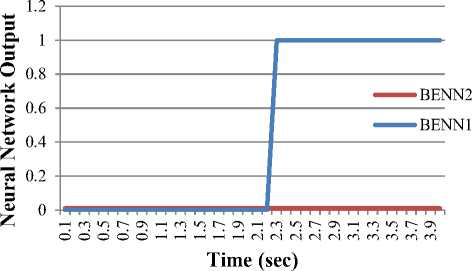
Fig.17. Outputs of neural networks (scenario B)
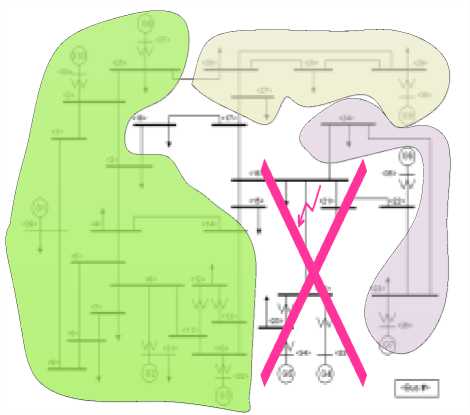
Fig.15. Uncontrolled islands following cascading failure (scenario B)
-
IV. Conclusion
A new method for estimating blackout size is presented in this paper. This method is based on the combinational neural networks. Each neural network estimates a specified percent of blackout. Different indices are defined for estimating blackout. Voltage, load, lines, and generators indices are defined for this purpose. The consecutive values of indices are used as the inputs of neural networks. Test results show the size of blackout can be estimated properly by neural networks.
References Blackout Estimation by Neural Network
- Samantaray, S. R. "Decision tree-based fault zone identification and fault classification in flexible AC transmissions-based transmission line." IET generation, transmission & distribution 3.5 (2009): 425-436.
- Ozgonenel, Okan, and SerapKaragol. "Power transformer protection based on decision tree approach." Electric Power Applications, IET 8.7 (2014): 251-256.
- Liu, Chengxi, et al. "A systematic approach for dynamic security assessment and the corresponding preventive control scheme based on decision trees." IEEE Trans. Power Syst., vol. 29, no. 2, pp. 717-730, Feb. 2014.
- G. V. Kass, “An exploratory technique for investigating large quantities of categorical data,” Appl. Statist., vol. 29, no. 2, pp. 119–127, 1980.
- L. Breiman, J. Friedman, R. Olshen, and C. Stone, Classification and Regression Trees. Belmont, CA: Wadsworth International Group, 1984.
- Mohammad Reza Salimian, "Transient Stability Prediction by ANFIS." International Electrical Engineering Journal, Vol. 5 (2014) No.3, pp. 1287-1292 .
- C. W. Liu, M. C. Su, S. S. Tsay, and Y. J. Wang, “Application of a novel fuzzy neural network to real-time transient stability swings prediction based on synchronized phasor measurements,” IEEE Trans. Power Syst., vol. 14, no. 2, pp. 685–692, May 1999.
- G. Bahbah and A. Girgis “New Method for Generators’ Angles and Angular Velocities Prediction for Transient Stability Assessment of Multi machine Power Systems Using Recurrent Artificial Neural Network,” IEEE Trans. Power Syst., vol. 19, pp. 1015–1022, MAY. 2004.
- N. Amjady and S. F. Majedi, “Transient stability prediction by a hybrid intelligent system,” IEEE Trans. Power Syst., vol. 22, pp. 1275-1283, Aug. 2007.
- M. Mohammadi, and H. Ebrahimpour-Komleh. "Rule Based Ensembles Using Pair Wise Neural Network Classifiers." International Journal of Intelligent Systems and Applications (IJISA), vol. 7, no. 4, 2015.
- R. K. Sharma, and A. K. Gupta. "Voice Analysis for Tele diagnosis of Parkinson Disease Using Artificial Neural Networks and Support Vector Machines." International Journal of Intelligent Systems and Applications (IJISA), vol. 7, no. 6, 2015.
- N. A. Kumar, and A. P. Singh. "Fault Diagnosis of Mixed-Signal Analog Circuit using Artificial Neural Networks." International Journal of Intelligent Systems and Applications (IJISA), vol. 7, no. 7, 2015.
- K., Yabe, et al. "Conceptual designs of AI-based systems for local prediction of voltage collapse." IEEE Trans. Power Syst., vol. 11, no 1, pp. 137-145, Nov. 1996.
- S. Tamronglak. S. H. Horowitz, A.G. Phadke, and J.S. Thorp, "Anatomy of power system blackouts: Preventive relaying strategies,” IEEE Trans. Power Delivery, vol. 11, no. 2, pp. 708–715, Apr. 1996.
- J, M, Hendrickx., et al. "Efficient computations of a security index for false data attacks in power networks." IEEE Trans. Automatic Contro, vol. 59, no. 12, pp. 3194-3208, Dec. 2014.
- G. J. Lee, M. M. Albu, and G. T. Heydt, “A power quality index based on equipment sensitivity, cost and network vulnerability,” IEEE Trans. Power Del., vol. 19, no. 3, pp. 1504–1510, Jul. 2004.
- A, Dwivedi, and Y, Xinghuo "A maximum-flow-based complex network approach for power system vulnerability analysis." IEEE Trans. Industrial Informatics., vol. 9, no. 1, pp. 81-88, Feb. 2013.
- I. Kamwa, et al. “Fuzzy Partitioning of a Real Power System for Dynamic Vulnerability Assessment,” IEEE Trans. Power Syst., vol. 24, no. 3, pp. 1356-1365, Aug. 2009.
- S. Mei and Y. Ni, “A Study of Self-Organized Criticality of Power System Under Cascading Failures Based on AC-OPF With Voltage Stability Margin,” IEEE Trans.PowerSyst.,vol. 23, no. 4, pp. 1719–1728, Nov. 2008.
- G. j. Correa, “Grid vulnerability analysis based on scale-free graphs versus power flow models,” Elect. Power Systems Research., vol. 11, pp. 71–79, Apr. 2013.
- M. Song, “A new Analysis method for early detection and prevention of cascadingevents,” Elect. Power Systems Research., vol. 77, pp. 1132–1142, Nov. 2007.
- M. A. Haidar, “Vulnerability Assessment of a Large Sized Power System Using Neural Network Considering Various Feature Extraction Methods,” Journal of Electrical Engineering & Technology., vol. 3, no. 2, pp. 167-176, 2008.
- D. Ruisheng, et al. "Decision tree assisted controlled islanding for preventing cascading events." IEEE/PES Power Systems Conference and Exposition, 2009.
- H. Manjari, and B. H. Chowdhury, "Intentional islanding and adaptive load shedding to avoid cascading outages." IEEE Power Engineering Society General Meeting, 2006.
- Koch, Stephan, et al. "Mitigation of cascading failures by real-time controlled islanding and graceful load shedding." IEEE Bulk Power System Dynamics and Control (iREP), 2010.
- A. S. Shahnawaz, et al. "A scheme for controlled islanding to prevent subsequent blackout." IEEE Transactions on Power Systems, vol. 18, no. 1, pp. 136-143, 2003.
- K. Sun, K. Hur, P. Zhang, “A New Unified Scheme for Controlled Power System Separation Using Synchronized Phasor Measurements, ” IEEE Trans. Power Syst., vol. 26, No. 3, pp. 1544-1554, Aug. 2011.
- T. B. Nguyen and M. A. Pai, “Dynamic security constrained rescheduling of power systems using trajectory sensitivities,” IEEE Trans. Power Syst., vol. 18, no. 2, pp. 848–854, May 2003.
- M.R. Aghamohammadi, S. hashemi and A. hasanzade, ‘‘A new approach for mitigating blackout risk by blocking minimum critical distance relays,’’ Int. J. Elect. Power Energy Syst., vol. 75, pp. 162-172, 2016.
- M.R. Aghamohammadi, M.A. Hasanzade, “A New Approach for Modeling Self Triggering Characteristic of Cascading Failure in Power System Blackout,” 17rd ICEE,2009.
- M. Zare, MR. Aghamohammadi, and M. Saeedi, “Mitigation of power system blackout by blocking zone 3 of minimum distance relays,’’ In: Universities Power Engineering Conference (UPEC), Italy; 2008. p. 1–5.
- SPSS Modeler Software User’s Guide, Version 14.2, 2010.
