Blockchain-enhanced Detection of Malicious Nodes in WSNs Using Parallel Triple Graph Attention-based Convolution Network

Author: J. Jabez, N. Jayanthi, Elangovan Muniyandy, R. Mohanapriya
Journal: International Journal of Computer Network and Information Security @ijcnis
Article in issue: 2 vol.18, 2026.
Free access
A Wireless Sensor Network (WSN) is an efficient system for monitoring distributed areas and controlling environments; however, such networks are susceptible to malicious node attacks that bring forth network insecurity and untrustworthy data. WSNs are vulnerable to malicious nodes and cyber attackers that can interfere with data transmission, leading to compromised decision-making systems. Traditional security techniques against WSNs lack flexibility in real-time detection and data integrity because of constrained processing resources and vulnerabilities from centralized storage. This work aims to improve detection accuracy through a multi-stage strategy, which constitutes the general objective of this research. The presented model uses WSN-DS and WSN-BFSF datasets. The data are pre-processed using Localized-Global Depth Normalization for uniformity, followed by feature selection via Boosted Tern-Cat Hunting Optimization, which combines Cat Hunting Optimization and Boosted Sooty Tern techniques to reduce dimensionality. The attack detection is performed by a Parallel Triple Graph Attention-based Convolution Network, which employs Quantum Parallel Deep Convolution and Triple Graph Attention Networks. The RMRO optimizes the model's parameters to classify more accurately, and the benign data are safely stored through the Consensus-Aided PoA Decision Blockchain Engine and InterPlanetary File System. This approach achieved 99.4% accuracy, 99.3% recall, and 99.5% F1 score on the WSN-DS dataset and 99.2% accuracy, 99.1% precision, and 99.3% F1 score on the WSN-BFSF dataset while showing robustness across different combinations of sensors. Hence, the Tri-QPdCNet offers a pioneering approach toward securing WSNs from dynamic and persistent attacks by providing an improved framework for anomaly detection using a strong, scalable architecture, augmented with blockchain technology. That leads to more robust WSN infrastructures that can be more securely and smoothly deployed in real-time critical environments.
Blockchain, InterPlanetary File System, Intrusion Detection System, Malicious Node, Wireless Sensor Networks, WSN-BFSF, WSN-DS
Short address: https://sciup.org/15020299
IDR: 15020299 | DOI: 10.5815/ijcnis.2026.02.12
Text of the scientific article Blockchain-enhanced Detection of Malicious Nodes in WSNs Using Parallel Triple Graph Attention-based Convolution Network
The advent of blockchain-enhanced Wireless Sensor Networks (WSNs) introduces a new defense in preventing malicious node attacks with decentralized trust and secure data management [1]. Classical WSNs, exposed to diverse attacks owing to the relative independence of the nodes [2], are now strengthened with blockchain, which ensures data tamper-proofing and subsequently achieves nodes’ identity validation [3]. The integration of blockchain with WSNs increases the security protocols to a significant extent [4], primarily in the detection and mitigation process of malicious nodes present [5]. Blockchain is a decentralized framework that allows validation [6], authentication, and recording of all transactions or exchanges within the network [7]; hence, it prevents the unwanted meddling of unauthorized elements and provides substantial traceability [8].
Integrating blockchain with an elaborate intrusion detection mechanism for WSNs provides robust security against different attacks [9]. The distributed ledger technology empowers blockchain technology that enhances node accountability through an immutable log of interactions [10]. This also facilitates quick identification of anomalies that may occur for improving detection accuracy over time, as datasets enable real-time training and evaluation of the detection algorithms [11]. Moreover, the InterPlanetary File System (IPFS) integration ensures efficient storage of data by reducing redundancy and improving node efficiency [12].
For applications such as smart cities that operate in real time, the fundamental concept is monitoring. For instance, a city is equipped with thousands of sensor nodes as part of its core infrastructure, including control of traffic management and utilities. A malicious node might transmit false information to a control center that could disrupt traffic or bring down electrical supplies [13]. In this case, the Intrusion Detection System (IDS) backed by blockchain is designed to analyze each node’s behavior to detect malicious activities, while the IPFS distributes verified data among the nodes [14], containing the threat and maintaining data integrity [15]. They help to minimize adversarial activity and ultimately keep both the network and its users safe, all while enabling decisions to be made much more quickly at a local level.
Contributions
• The primary data gathering employs WSN-DS and WSN-BFSF datasets, which record several node varieties and patterns of malevolent operations essential for model development and testing.
• Collected data is then processed using Localized-Global Depth Normalization (Lo-GDN), which improves uniformity by normalizing both local and global depth, making it a normalized dataset.
• The Boosted Tern-Cat Hunting Optimization (BoT-CHO) method effectively selects the features from the datasets, which decreases the dataset size and increases the dimensionality of effective features that improve the intrusion detection model.
• Malicious activities in nodes are classified accurately using the Parallel Triple Graph Attention-Based Convolution Network (Tri-QPdCNet). Tri-QPdCNet involves Quantum Parallel Convolution and Triple Graph Attention to probe deeply into complex node relationships.
• The weight parameters are optimized by the Resilient Mud Ring Optimizer (RMRO), which makes the modality adaptive to threats, thereby fine-tuning the network performance.
• After classification, benign data will be stored securely in a Consensus Aided PoA Blockchain Engine (CA-PoA-BE) with InterPlanetary File System (IPFS), ensuring the integrity and availability of the data is safe and decentralized.
2. Literature Survey
This work is organized as follows: Existing works are illustrated in Section 2. The proposed Tri-QPdCNet is explained in Section 3. In Section 4, the performance analysis of the suggested methodology is presented. Section 5 draws the article to a conclusion.
Among the extensive studies in this field, a selection of key works is reviewed to highlight foundational and recent advancements.
In 2023, Nouman, M., et al. [16], have examined malicious node detection and secure data storage in WSNs by integrating Machine Learning and Blockchain (BC). Blockchain was applied at Base Stations and Cluster Heads for node registration and security management, while Histogram Gradient Boost (HGB) classified nodes as malicious or legitimate. Malicious nodes were revoked, and legitimate data were stored in IPFS with hashes maintained in BC. Verifiable Byzantine Fault Tolerance replaced Proof of Work for consensus. Unlike prior works relying solely on ML classifiers such as Adaptive Boost, Gradient Boost, Extreme Gradient Boost, Linear Discriminant Analysis, and Ridge, this framework critically combined distributed storage with consensus efficiency, highlighting a more resilient workflow for WSN security.
In 2023, Elsadig, M.A., [17], investigated denial-of-service (DoS) detection in WSNs through a lightweight ML framework. The study examined vulnerabilities and limitations of WSNs under DoS attacks and evaluated earlier detection methods, emphasizing trade-offs between accuracy and computational cost. A Decision Tree (DT) classifier with Gini feature selection was applied for efficient detection, trained and tested on an enhanced WSN-DS dataset. Unlike Random Forest, Extreme Gradient Boosting, and k-Nearest Neighbor, which demanded higher computational overhead, this design aligned with WSN constraints by balancing detection accuracy with reduced resource consumption, demonstrating stronger scalability compared to prior works.
In 2024, Talukder, M.A., et al. [18], have addressed intrusion detection in WSNs by combining ML with the Synthetic Minority Oversampling Technique and Tomek Link (MLSTL-WSN) to overcome class imbalance. The approach balanced datasets by generating minority samples and eliminating overlapping instances, while feature scaling ensured consistent inputs for training. Evaluation on WSN-DS highlighted improved precision in both binary and multiclass detection. Compared to earlier intrusion detection systems that suffered from false alarms, redundancy, and computational overhead, this design demonstrated higher robustness and efficiency, offering stronger adaptability than conventional classifiers reliant on unbalanced data.
Table 1. Summary of the existing methods
|
Reference Number |
Dataset Used |
Methods |
Highlights |
Challenges |
|
[16] |
WSN-DS |
HGB |
|
|
|
[17] |
DT |
|
|
|
|
[18] |
MLSTL-WSN |
|
|
|
|
[19] |
WSN-BFSF |
IRADA |
|
|
|
[20] |
Wsn-bfsf |
|
|
|
|
[21] |
WSN-DS and WSN-BFSF |
GSWO-CatBoost |
|
|
|
[22] |
SCNN-Bi-LSTM |
|
|
In 2024, Shakya, V., et al. [19], have recommended an attack detection method in WSNs by developing an Integrated Reinforcement Learning and Deep Learning Algorithm (IRADA). The study highlighted limitations of existing Intrusion Detection Systems (IDSs), including false alarms, overfitting, and computational overhead. IRADA combined Deep Learning (DL) optimized through Bayesian methods with Reinforcement Learning (RL) to balance detection accuracy and adaptability. Unlike conventional DL-only or RL-only approaches that struggled with data dependency or training inefficiency, this integration achieved stronger robustness against adversarial threats while enhancing classification reliability, thereby presenting a more resilient security framework compared to prior IDS designs.
In 2023, Dener, M., et al. [20] analyzed attack detection in WSNs through the creation of a new dataset named WSN-BFSF, focusing on blackhole, flooding, and selective forwarding attacks simulated in the NS2 environment. The dataset underwent preprocessing to support ML and DL models for traffic classification and malicious behavior identification. Various ML methods, including Random Forest, DT, Naïve Bayes, and Logistic Regression, along with DL models such as Convolutional Neural Network, Long Short-Term Memory, and Gated Recurrent Unit, were applied. Unlike earlier studies relying on limited datasets, this contribution enriched experimental benchmarking, offering broader attack coverage and improved validation for WSN intrusion detection research.
In 2024, Nguyen, T.M., et al. [21] presented an intrusion detection approach for WSNs by integrating Genetic Sacrificial Whale Optimization (GSWO) with CatBoost. GSWO combined Genetic Algorithm and Whale Optimization Algorithm with a conditional inherited choice mechanism to mitigate premature convergence, improving feature selection efficiency. CatBoost was then employed for classification with optimized hyperparameters using GSWO-based quantization. Unlike conventional FS or DL-based methods that struggled with computational cost and slower inference, this design achieved faster processing while maintaining high accuracy across multiple datasets, demonstrating stronger scalability and real-time applicability for WSN security.
In 2024, Jena, S.R., et al. [22] introduced a privacy-preserving intrusion detection framework for Internet-enabled WSNs using Federated Learning. The design integrated Stacked Convolutional Neural Networks (SCNN) and
Bidirectional Long Short-Term Memory (Bi-LSTM), optimized through the African Vulture Optimization Algorithm, to strengthen intrusion detection accuracy while safeguarding data privacy. The framework was trained on datasets including WSN-DS, CIC-IDS-2017, and WSN-BFSF. Unlike traditional IDSs that struggled with unknown attacks and privacy risks, this method achieved superior scalability and resilience, critically outperforming standalone DL or optimization-driven IDS approaches in real-world WSN environments.
Table 1 shows the summary of the existing methods, which is given below,
Problem Statement
WSNs play a significant role in realizing real-time monitoring across different sectors, from the environmental sector to the infrastructure sector. However, WSNs are prone to many security threats, including threats from malicious nodes that can cause disruption of the integrity of the generated and transmitted data, interference with the communication network, and utilization of scarce resources. Conventional security techniques used in WSNs fail to differentiate node identity and perform rapid identification of the intruder in the decentralized network topology. The incorporation of blockchain technology increases security by creating an open yet reliable system that accurately captures and verifies all the actions of each node and easily eliminates any unbecoming nodes. Such a blockchain-integrated approach, when used with WSN-DS and WSN-BFSF for anomaly detection, promises higher reliability, robustness, and scalability for WSNs against dynamism and threats in their environment.
3. Proposed Methodology
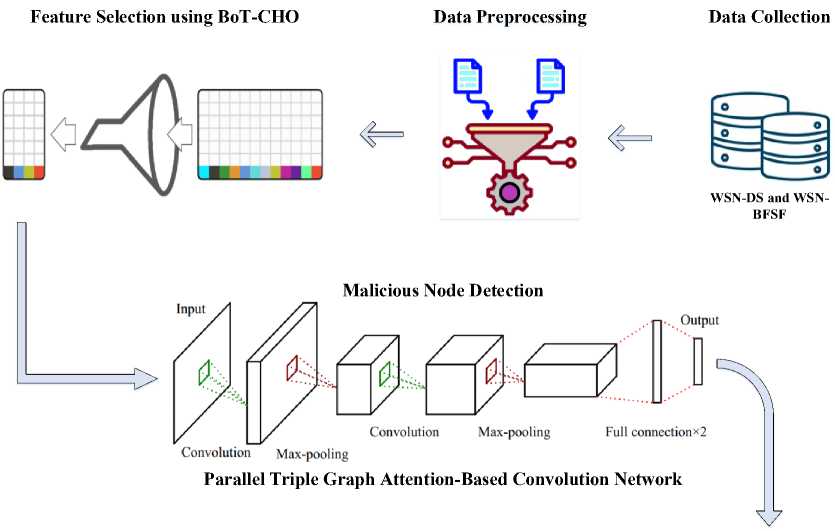
The proposed methodology improves the detection of malicious nodes in WSNs through advanced processing, attack identification, and secure storage. First of all, the data from both WSN-DS and WSN-BFSF datasets is gathered and preprocessed using the Lo-GDN technique to normalize the data. Subsequently, Boosted Tern-Cat Hunting Optimization (BoT-CHO) assigns the importance weight to differentiate and choose the most important feature from the structure of data set. For detection, a Parallel Triple Graph Attention-based Convolution Network (Tri-QPdCNet) achieves high accuracy for detecting the patterns of attacks. The accuracy of classification separates is improved by the use of the Resilient Mud Ring Optimizer, while benign data is stored securely through the decentralized Consensus-Aided PoA and IPFS blockchain structure. Figure 1 presents the block diagram of the proposed methodology.
-
3.1. Data Collection
-
3.2. Pre-processing
The data collection for this blockchain-enhanced detection framework is built on two datasets, WSN-DS and WSN-BFSF, which are specially created for wireless sensor networks (WSNs). They contain extensive logs of the type of network states in that kind of network by capturing both good and bad patterns of sensor node activities. Conversely, WSN-DS presents the complete set of well-known attacks and intrusion efforts, whereas WSN-BFSF is employed to get a focused perspective on specific network vulnerabilities.
The collected data is then forwarded to Localized-Global Depth Normalization, which is selected as it balances both localized and global features of the data and thus better normalizes various network data collected than traditional methods.
In data preprocessing for sensor networks, Localized-Global Depth Normalization (Lo-GDN) [23] is applied to harmonize sensor data across datasets like WSN-DS and WSN-BFSF. This approach enhances data uniformity, compensating for inconsistencies due to variable configurations in sensor nodes. By using Lo-GDN, the data is optimized with consistent structural quality, facilitating efficient feature selection and reducing preprocessing time.
-
• Local Depth Normalization
To achieve localized consistency, Lo-GDN partitions each sensor dataset into small regions and applies normalization within each region independently. Each patch Q is normalized to have a mean of zero and a near unit variance, according to equation (1),
Lldn(m) = s(“)-mean(s(Q)\ where mEq (1) std(S(Q))+S , where S (a) represents the sensor measurement at point a within the patch Q, and 6 is a small constant added for numerical stability and std and mean denotes the standard deviation and mean, respectively. This localized normalization minimizes local variations, refining data quality for subsequent analysis.
Secure Storage of Benign Data
Fig.1. Block diagram of Tri-QPdCNet
Optimized Classification
-
• Global Depth Normalization
In addition to local adjustments, a global normalization is introduced to capture the broader data trends across the entire dataset. The global scale is adjusted using the overall standard deviation std(S (De)), where De represents the entire data scope. It is expressed in equation (2),
Lgdn (w) =
S (a))-mean(S (Dq)) std(S(D0))+8
This normalization process frees the data from absolute scaling differences, focusing on relative variations across both local and global contexts. By implementing Lo-GDN, the preprocessing step enhances structural uniformity, essential for the data’s readiness for feature selection using Boosted Tern-Cat Hunting Optimization, which has been selected due to its applicability in high-dimensional datasets and high precision in defining the most significant features while improving the time efficiency over the traditional approaches.
-
3.3. Feature Selection
Preprocessed data are input for feature selection, optimizing the selection of relevant features critical for intrusion detection in WSNs using Boosted Tern-Cat Hunting Optimization (BoT-CHO). This advanced approach strategically extracts features, using Cat Hunting Optimization (CHuntO) [24], improving data processing efficiency and enabling faster, accurate detection in real-time threat scenarios. To further enhance feature selection effectiveness, CHuntO undergoes dynamic integration with Boosted Sooty Tern Optimization (BSooT) [25], ensuring optimal feature sets that significantly reduce computational load.
-
A. CHuntO Algorithm
In CHuntO, each solution represents a unique feature vector and a population of randomly generated vectors M. Each feature vector’s relevance is determined using an objective function that balances feature quantity and prediction error, formalized as equation (3),
Cos(M i ) = v— x^M . ) + v2x ^M . ^ (3)
wherev — and v2 are weighting coefficients within [0,1], G(Ml) represents the prediction error for vector Ml , and HMJI denotes the number of selected features.
The most competent and least competent vectors, designated a and p, respectively, define a dynamic range of possible states, with higher-competence vectors exploring a broader state space. The number of states a solution vector Ml may explore is represented by equation (4), state(Ml) = (^r^-^-)11 ■ (state(a) - stated + state^ (4)
where q is a power parameter, adjusted to regulate the search radius over iterations, ensuring an exploratory-to-exploitative transition.
The feature vectors are updated iteratively, focusing on maximizing search accuracy by adjusting solutions based on population mean Mavg and optimal solution position M * , calculated as equation (5),
Mnew = M+z — -(M- MaVg} +z2^M- M * )
where Z j and z 2 are random values within [0,1], ensuring a balanced search space coverage. The mean MaV g is updated dynamically as equation (6),
Mava ^ZT-iMi aug i= —i i
where N is the total number of vectors. These optimized parameters are integrated with BSooT to accelerate feature selection and to enhance the precision and speed essential in real-time scenarios.
-
B. BSooT Optimization
Following CHuntO, Boosted Sooty Tern Optimization (BSooT) is applied to enhance feature selection efficiency, optimizing both the accuracy and speed essential for real-time intrusion detection in WSNs. This optimized feature selection technique, applied to WSN-DS and WSN-BFSF datasets, leverages BSooT for precise, computationally efficient feature extraction that reduces dimensionality and supports high detection accuracy and rapid processing.
In BSooT, exploration is supported by migration behaviour and collision avoidance mechanisms to prevent overlap among search agents. The position of each search agent is adjusted to avoid collisions with nearby agents as equation (7),
C p =SA^P p (d) (7)
where C p denotes the updated, non-colliding position of the agent. The variable P p (d) represents the current position of the search agent, and d is the current iteration. SA is the agent's movement factor within the search space.
The fitness function in BSooT is designed to evaluate each feature subset based on its dimensionality reduction, as in equation (8),
Fitness(S) = a ■ — (8)
IFI where S is the selected subset of features, |F| is the total number of selected features (minimizing dimensionality), and a is a weight set to balance between feature count.
BSooT agents converge toward the direction of the fittest neighbour, which is determined by equation (9),
M p = CB^(Qy(d)-P p (d)) (9)
where M p is the directional update towards the optimal neighbouring agent Qy . The parameter CB = 0.5 x rand introduces randomness for improved exploration, where rand generates a random value within the [0,1] range.
In the exploitation phase, BSooT agents employ a spiral path to refine their search near promising regions, formulated in equation (10), г' = R ■ sin(к), rt = R ■ cos(k) and и' = R ■ к (10)
where R is the spiral radius, к ranges from [0,2^], and constants for altitude and radial scaling are set as 1 for simplicity. The BSooT algorithm computes the agent's position after exploiting these spiral dynamics, using equation (11),
PpW = (d^ ■ (r ' +t ' + u ' ^Q^d) (11)
where D^ is a derived factor influencing the final position update in relation to the most optimal search agent Qv .
This integration of CHuntO with BSooT enables the feature selection framework to efficiently prioritize critical features, which is then followed by a Parallel Triple Graph Attention-based Convolution Network for attack classification. It is chosen due to its superior ability to capture complex spatial-temporal attack patterns in WSNs.
-
3.4. Malicious Node Detection
After feature selection, attack detection in the node is carried out using Parallel Triple Graph Attention-based Convolution Network (Tri-QPdCNet), an architecture that integrates Quantum Parallel deep Convolution Network (QPdCNet) [26] with a Triple Graph Attention Network (Tri-GAN) [27].
-
A. Quantum Parallel Deep Convolution Network
-
• Transformation for Multi-Feature Detection
To perform effective attack detection, each feature subset is processed concurrently across QPdCNet's quantum-inspired layers, capturing intricate attack characteristics with precision. The transformation within QPdCNet, denoted as Та(Л,Х), is applied to align features without needing individual frequency adjustments, as given in equation (12),
T^X) = Ta(v + 28a,x) (12)
where /л represents the frequency parameter, % indicates the spatial dimension, and 6a , x is a scaling constant related to the quantum layer. This transformation maintains alignment across feature subsets, allowing coherent analysis of frequency-sensitive patterns.
-
• Phase Adjustment in Parallel Feature Layers
To enable simultaneous feature processing, continuous frequency compensation is introduced, ensuring consistent phase alignment across layers. This modified transformation Тр(л,Х) , eliminating frequency shifts, is defined as equation (13),
Т Р (л,Х) = Та(л,Х)е1к^ (13)
where Ka denotes the phase adjustment factor to synchronize the phase across all layers. This configuration facilitates parallel feature extraction within QPdCNet, enhancing detection accuracy for complex, high-frequency attack patterns.
-
• Parallel Network Design for Enhanced Attack Detection
The architecture of QPdCNet integrates multiple fully connected layers that run parallel to convolutional layers. These layers are carefully designed to manage large numbers of features efficiently. Each convolutional layer has activation layers, such as ReLU, along with softmax classifiers following it. An averaged cross entropy loss function has been applied across all outputs to optimize the weights for identification of diversified complex cyber threats.
-
B. Triple Graph Attention Network
Triple Graph Attention Network provides a mechanism to perform relational analysis between features extracted across graph-structured data. Capturing spatial and temporal dependencies, Tri-GAN detects subtle intrusion patterns with high accuracy, hence making the component an important constituent for effective detection of various kinds of cyber threats.
-
• Quantum-Inspired Feature Attention for Anomaly Classification
To accurately classify relevant attack features, a graph attention gating mechanism is used to refine node (feature) representations within Tri-GAN. This gating enables attack-specific attention across each dimension of the feature set, based on graph-based interactions between nodes. Given the node ps representing a specific feature (or graph node) from QPdCNet, a lookup is performed over a feature embedding matrix Ep to retrieve the initial feature representation ys . The gating mechanism then computes the target-aware feature representation ys as equation (14),
У^а^Ф^+^у (14)
where a is an activation function, Vp and 6p are trainable parameters, and f and f ^ represent graph-based embeddings associated with neighbouring nodes. This operation refines ys by filtering irrelevant data for attack detection.
-
• Temporal-Specific Attention for Attack Correlation
To capture temporal relationships that may correlate with specific attack patterns, an attention mechanism is applied, giving each feature a unique, context-sensitive weight based on temporal dynamics. The attention weight вг for each feature node ps is defined as equation (15), вг = Softmax(we ■ tanh(Ue[f^ фyp] + Se)) (15)
where wg,U e, and 6 в are trainable parameters. This equation assigns a higher weight to features strongly correlated with the temporal attack pattern.
-
• Respondent-Guided Attack Representation
-
3.5. Optimized Classification with Resilient Mud Ring Optimizer
The integration of spatial and temporal features with context-specific weights results in a comprehensive representation r s of each feature’s importance in detecting attacks. The final representation for a node, considering both respondent and temporal influences, is computed as equation (16), rs = Т.„=1в„^Урв (16)
where p represents the total number of temporal steps considered, and Qv is the assigned weight for each step.
Loss Function
For training, a cross-entropy loss function Iattack is applied across all output nodes to optimize the model’s parameters as in equation (17),
1 attack “T.s=i (yslog(ys) + (.1-ys)log(1-ys)) (17)
where ys denotes the true label for node s, ys represents the predicted probability, and n is the total number of nodes in the graph. This comprehensive approach ensures that both QPdCNet and Tri-GAN contribute to the precise and reliable classification of attacks. To finetune the network parameters, the Resilient Mud Ring Optimizer is used. This method is selected for its adaptive parameter optimization, enhancing classification accuracy and resilience against network fluctuations.
In order to improve the network classification performance, the Resilient Mud Ring Optimizer (RMRO) [28] algorithm is presented. This algorithm adapts to varying networks and different threats, improving the stability of the classification model. To evaluate and optimize agent positions, a fitness function FRMR0 is employed to measure classification accuracy and error reduction as in equation (18),
F rmro = Y t=i (~yi log(yi) + (1 - y t ) log(1 - y t ) (18)
where yt is the actual classification label, yt is the predicted label, and n is the number of samples. This fitness function aims to maximize accuracy and minimize classification error, guiding the RMRO agents towards optimal model parameters.
-
• Exploration Phase – Searching for Optimal Parameters
In the exploration phase, RMRO mimics dolphin echolocation, where virtual agents (simulating dolphins) search randomly for the best weight configuration. Each agent operates with a velocity Vc at position Dc, generating a sound intensity Kc to detect optimal parameters. To regulate the agent's sound emission and focus on relevant parameter zones, the pulse rate p varies between 0 (no pulse emission) and 1 (maximum emission). The adaptive sound intensity Kc is calculated as equation (19),
Kc = 2ac-Uc-Pc where Uc is a random vector between 0 and 1, and ac = 2 (1 — ~~~ ()) reduces linearly over time t with a maximum duration Tmax. This variable intensity Kc aids in exploring the parameter space by encouraging agents to diverge from one another, thus supporting a global search for optimal configurations. To compute new positions, the position Dc of each agent at time step t is updated based on its velocity as in equation (20), dc = dc-1 + vC
where V^ is initialized randomly within a predefined range, simulating initial exploration. This position update enables agents to explore the entire search space.
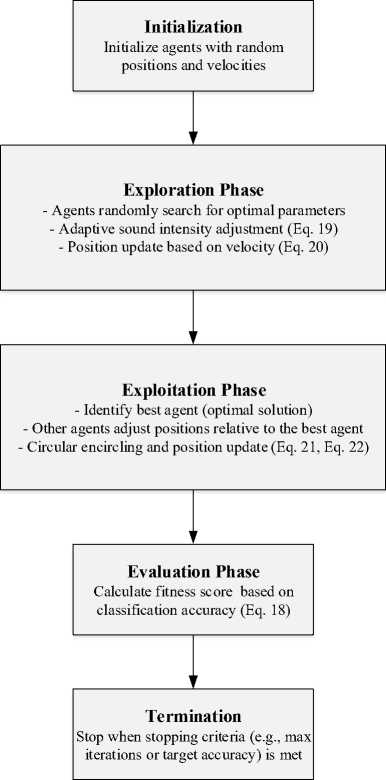
Fig.2. Step-by-step procedure of resilient mud ring optimizer
-
• Exploitation Phase – Encircling Optimal Solutions
In the exploitation phase, RMRO agents identify and converge towards an optimal solution. Once the best agent is identified, other agents adjust their positions relative to this agent's location to refine their own. The deviation Ac between an agent’s position D c and the best-known position D c is defined as equation (21),
A c = IC c D c —D c -1l
where Cc is a coefficient vector that scales the influence of the best agent’s position. The position update for the encircling behaviour is given as equation (22),
D C = D C - sin( 2nA) -Kc-Ac
where A is a random variable that simulates oscillatory encircling, and Kc adjusts the degree of attraction towards the optimal solution. Each iteration dynamically refines the position of the agents around the optimal region. Figure 2 shows the procedure of RMRO.
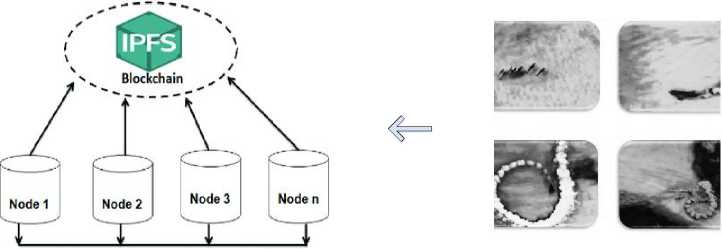
Thus, RMRO enables adaptive and precise tuning of classification model parameters, improving resilience and accuracy in variable network conditions. To store the benign data, the Consensus-Aided PoA Decision Blockchain Engine (CA-PoA-BE) is used. CA-PoA-BE is chosen for its enhanced security, scalability, and efficient protection of benign data compared to other methods.
-
3.6. Secure Storage of Benign Data
After the network has been fine-tuned for classification tasks, benign data are securely stored using the Consensus-Aided PoA Decision Blockchain Engine (CA-PoA-BE) [29]. The integration of the InterPlanetary File System (IPFS) with CA-PoA-BE provides a distributed network for benign data storage, enhancing accessibility, scalability, and rapid data retrieval for real-time applications.
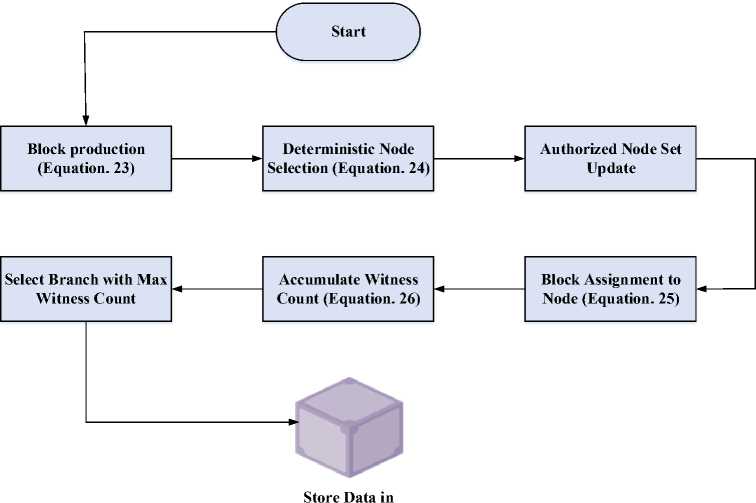
In the CA-PoA-BE model, each block in the Decision Blockchain is generated at consistent time intervals. Starting from the initial block time-stamped at T0, a block at height и > 0 created at time Tu satisfies equation (23),
Tu = T0+y-A (23)
where у is an integer parameter representing the step count, and A is the fixed interval for block generation.
To maintain the security of the blockchain, a deterministic process termed Deterministic Pseudo-Random Process (DPRP) decides the authorized node for block generation. The status of nodes as "active" or "inactive" is regularly updated. The legitimacy of node J for producing block B(u,T at height и and time T is determined by a pseudorandom value Р(и, T), as expressed in equation (24),
P(u.T) = DRPRP(u,T) = hash(и ф T)
where ф signifies byte-array concatenation. The active node set AB is defined as the ensemble of nodes with the authority to produce a given block. For any node M in AB , its index in the set is computed by equation (25),
8м(и,Г) = P(u,T)mod^Aв^
IPFS
Fig.3. Secure Storage of Benign Data using CA-PoA-BE
Thus, node M generates block B(u,T) only if it matches the index 6м calculated in the set AB . For branch selection, CA-PoA-BE employs an accumulated witness count, denoted by λB ( u , T ) , to determine the legitimate branch. For any block B(u, T), this is computed as equation (26),
* b (u,T = ^ pa(b(ut)) + ||A b (u,T)|| (26)
where ЦАВ(и, T)| denotes the number of active nodes witnessing the block. Figure 3 shows the series of steps for CA-PoA-BE.
The CA-PoA-BE architecture enables secure, decentralized, and high-speed storage of benign data in IPFS. This model provides resilience against data tampering and supports scalability, making it an efficient choice for managing data in real-time wireless sensor network applications.
Therefore, this methodology is an accurate, safe solution for real-time threat detection of Wireless Sensor Networks while keeping the optimal capabilities to attack identification and data, distributed storage to increase the degrees of freedom of the network.
4. Results and Discussions
The outcomes and analysis of the suggested technique, Blockchain-Enhanced Detection of Malicious Nodes in WSNs Using Parallel Triple Graph Attention-based Convolution Network (Tri-QPdCNet), are shown in this section. The evaluation of the proposed method is simulated in Python. This research is tested over two datasets: WSN-DS and WSN-BFSF. Table 2 provides the simulation parameters for the proposed research.
Table 2. Simulation parameter
|
Simulation Parameters/Hyperparameters |
Description |
|
Datasets used |
WSN-DS and WSN-BFSF |
|
Simulation Tool |
Python |
|
Number of sensors |
100-120 |
|
Sensing range |
50 m |
|
Transmission range |
40-80 m |
|
Node Energy (Initial) |
0.5 Joules per sensor |
|
Activation Functions |
ReLU (hidden), Softmax (output) |
|
Optimizer for Training |
RMRO |
|
Learning Rate |
0.001 (adaptive decay) |
|
Batch Size |
64 |
|
Epochs |
100 |
|
Dropout |
0.3 (to prevent overfitting) |
|
Loss Function |
Cross-Entropy |
|
RMRO Population Size |
30 agents |
|
RMRO Iterations |
100 |
|
Termination Condition |
Minimum error < 1e-5 or max iterations |
The experiments were conducted using the WSN-DS and WSN-BFSF datasets in Python, simulating 100–120 sensors with a 50 m sensing range, 40–80 m transmission range, and 0.5 J initial energy. The Tri-QPdCNet employed ReLU activation for hidden layers and Softmax at the output. Training utilized RMRO optimizer with a learning rate of 0.001, batch size of 64, and 100 epochs. Additional settings included 0.3 dropout, cross-entropy loss, 30-agent RMRO population, 100 iterations, and termination at error < 1e-5.
Implementation Details
The implementation of Tri-QPdCNet with RMRO optimization was conducted to ensure reproducibility, utilizing publicly available datasets WSN-DS [29] and WSN-BFSF [30] from Kaggle. Preprocessing steps such as feature normalization and attack-class balancing were handled by the Lo-GDN module, which extracts local graph dependencies to improve training quality. The model was implemented in Python 3.10 with TensorFlow 2.12 on an Intel i7 CPU with 16 GB RAM. For blockchain integration feasibility, a CA-PoA-BE-based blockchain framework is adopted by assigning validation tasks to cluster heads or edge gateways instead of resource-constrained sensor nodes, thereby reducing computational load, minimizing energy consumption, and enabling deployment in real-world WSNs. The lightweight CA-PoA-BE consensus mechanism ensures low latency, making it suitable for time-sensitive anomaly detection in large-scale networks.
-
4.1. Dataset Description
-
A. WSN-DS
The Wireless Sensor Network Dataset (WSN-DS) [29] was created to enhance the detection and classification of Denial of Service (DoS) attacks. It allows sensor nodes to distinguish typical network behaviors from malicious signatures, enabling timely identification of potential attackers and informed response measures. The dataset was constructed using the LEACH routing protocol, extracting 23 attributes for each node's operational status. The dataset categorizes four types of DoS attacks: Blackhole, Grayhole, Flooding, and Scheduling (TDMA) attacks, and a "Normal" category for nodes free from malicious influence. This comprehensive classification approach ensures the dataset covers both attack-related and benign behaviors, enabling the development of robust intrusion detection models specifically tailored to wireless sensor networks.
-
B. WSN-BFSF
-
4.2. Performance Analysis
The WSN-BFSF dataset is a comprehensive resource for analyzing Wireless Sensor Network (WSN) traffic, including instances of Blackhole, Flooding, and Selective Forwarding attacks. It contains 312,106 entries with 16 unique features, providing a detailed framework for analyzing traffic patterns alongside normal network activity. The dataset includes a diverse array of traffic types, including Blackhole attacks, Flooding attacks, Selective Forwarding attacks, and regular network traffic. After a meticulous preprocessing phase, it is a valuable asset for understanding vulnerabilities and cyber threat behaviors in WSNs. Dataset available at [30]. Table 3 provides the data distribution for the WSN-DS and WSN-BFSF datasets.
Table 3. Training and testing data distribution in WSN datasets
|
Datasets |
The Traffic Type |
Training Set |
Testing Set |
|
WSN-DS dataset |
Blackhole |
8104 |
1945 |
|
Grayhole |
10,598 |
2624 |
|
|
Flooding |
2405 |
597 |
|
|
TDMA |
5306 |
1322 |
|
|
Normal |
259,621 |
65,020 |
|
|
WSN-BFSF dataset |
Normal |
210,223 |
52,628 |
|
Flooding |
23,913 |
5931 |
|
|
Blackhole |
9441 |
2325 |
|
|
Forwarding |
6108 |
1537 |
Table 3 shows that the WSN-DS and WSN-BFSF contain large training and testing sets across different traffic types. The WSN-DS dataset includes Blackhole, Grayhole, Flooding, TDMA attack and normal wireless nodes, comprising 259,621 nodes for the training set and 65,020 nodes for the test set. Likewise, the WSN-BFSF dataset divides the data into Normal, Flooding, Blackhole and Forwarding with a significant amount of normal nodes (210,223 for training data and 52,628 for test data). Note that these large and diverse samples ensure that all the training coverage required for the correct identification and categorization of attacks in WSNs is provided.
The performance of the proposed BLogDirHip is analysed and compared with HGB [16], DT [17], MLSTL-WSN [18], IRADA [19], Wsn-bfsf [20], GSWO-CatBoost [21], and SCNN-Bi-LSTM-AVOA-FL [22]. The performance metrics are listed below:
Table 4. Performance metrics
|
Performance metrics |
Formula |
|
Accuracy |
я '’ 1 z 8 + ст + ( + ; |
|
Precision |
8 '' 8 1 С |
|
Sensitivity |
8 Se =8+^ |
|
Specificity |
ст Sp = CT+x |
|
RMSE |
RMSE = ^^(kt-Rty |
-
A. Performance Metrics
The performance measures like detection accuracy, attack classification, and secure storage, and the analysis of the proposed algorithm are carried out using the Tri-QPdCNet method. The performance metrics used in the evaluation of the proposed algorithm are tabulated in Table 4.
where ^denotes the true positive, ст denotes the true negative, ( denotes the false positive / represents the false negative. Table 5 evaluates the blockchain-specific aspects of each model.
Table 5. Comparative analysis of blockchain efficiency and security
|
Methods |
Consensus Efficiency(%) |
Fault Tolerance (%) |
Storage Efficiency (%) |
Security (%) |
Data Integrity (%) |
Execution Time (ms) |
|
HGB [16] |
94.5 |
93.7 |
92.9 |
94.0 |
91.8 |
110 |
|
DT [17] |
92.3 |
91.9 |
90.8 |
91.3 |
90.0 |
105 |
|
MLSTL-WSN [17] |
95.8 |
94.6 |
94.2 |
95.1 |
93.5 |
98 |
|
IRADA [18] |
93.4 |
92.5 |
91.5 |
92.7 |
91.2 |
120 |
|
Wsn-Bfsf [19] |
96.7 |
96.0 |
95.5 |
96.8 |
95.1 |
115 |
|
GSWO-CatBoost [20] |
97.2 |
97.1 |
96.5 |
97.4 |
96.7 |
95 |
|
SCNN-Bi-LSTM [22] |
98.0 |
97.8 |
97.4 |
97.9 |
97.2 |
90 |
|
Tri-QPdCNet (Proposed) |
99.5 |
99.4 |
99.2 |
99.6 |
99.0 |
85 |
Experimental results and analysis of the compared methods of blockchain are presented in Table 5 in terms of efficiency and security indicators. The proposed algorithm Tri-QPdCNet performs significantly better as compared with the others with average consensus efficiency of 99.5%, fault tolerance of 99.4% and security of 99.6% in the field of blockchain. It also shows high capability in storing and retrieving data with efficiency of 99.2% and 99.0% in data integrity respectively. Being the fastest among the existing methods, it has an execution time of 85ms and this makes it deliver the best of both the performance and security measures.
(a)
(b)
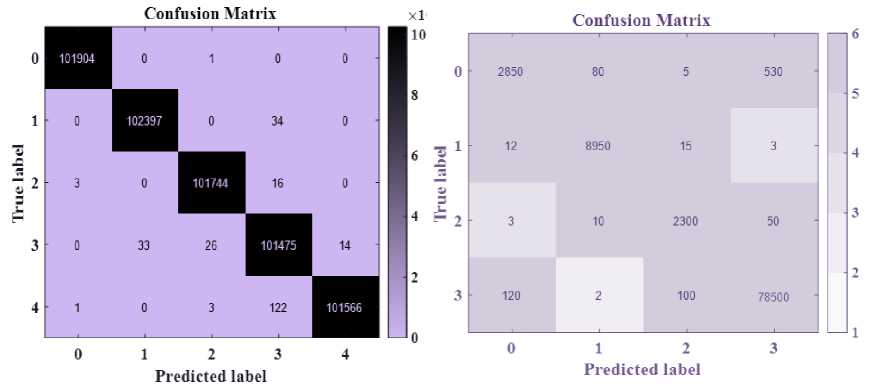
Fig.4. Confusion Matrix Interpretation
The confusion matrices in Figure 4(a) and 4(b) exhibit the proposed classifiers’ classification performance with respect to the WSN-DS and WSN-BFSF datasets. For WSN-DS in 4(a), the high diagonal values (e.g., 101904, 102397) illustrate that the proposed model achieves accurate classification with fewer numbers of misclassified samples with reference to each class. In 4(b) WSN-BFSF the proposed model provides good results where majority of the predictions are found in diagonal, for example 78500 correct predictions for class 3. But some of the off-diagonal elements which are negative are also meaningful, such as 120 from class 0 to class 3 which means occasional misclassification. Each of these matrices demonstrates the model’s performance for each of the datasets.
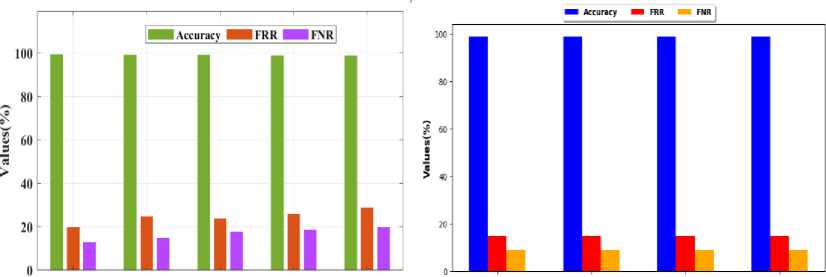
Figure 5 shows a Comparative Analysis of Intrusion Detection Accuracy in WSN-DS and WSN-BFSF Datasets. The graphs compare detection metrics—Accuracy, False Rejection Rate (FRR), and False Negative Rate (FNR)— across Blackhole, Grayhole, Flooding, TDMA, and Normal categories for (a) WSN-DS and Blackhole, Grayhole, Flooding, and Normal categories for (b) WSN-BFSF datasets. Both datasets show high accuracy, exceeding 99% for all categories, with low FRR and FNR values. The consistency in results highlights the models' robust performance in identifying normal and intrusion behaviors across various attack types, reinforcing their reliability in Wireless Sensor
Networks (WSN).
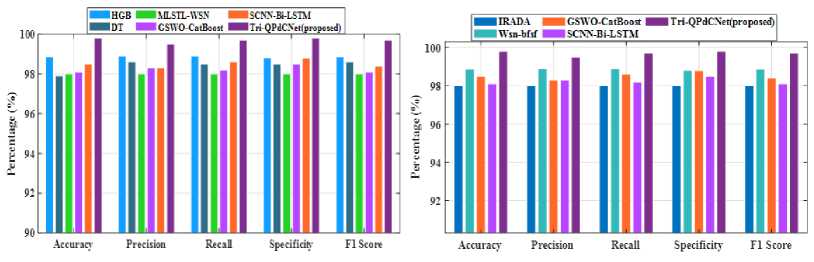
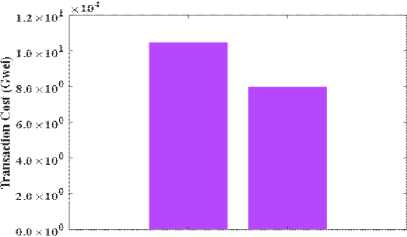
The performance of proposed models: accuracy, precision, recall, specificity, and F1 score on WSN-DS and WSN-BFSF are shown in figure 6(a), 6(b). The proposed Tri-QPdCNet model obtained 99.4% accuracy, 99.3% recall, and 99.5% F1 score by the WSN-DS; 99.2% accuracy, 99.1% precision, and 99.3% F1 score by the WSN-BFSF; therefore, it is efficient. Figure 6(c) represents the transaction cost figure and compares the cost of storing data with that of storing hashes as needed for efficient resource utilization.
Blackhole Grayhole Flooding TDMA Normal te“ “>“' “"5 B°™1
(a) (b)
Fig.5. Comparative analysis of intrusion detection accuracy in WSN-DS and WSN-BFSF datasets
(a) (b)
Data storage Hash storage
(c)
Fig.6. Performance metrics for WSN-DS and WSN-BFSF datasets and transaction costs
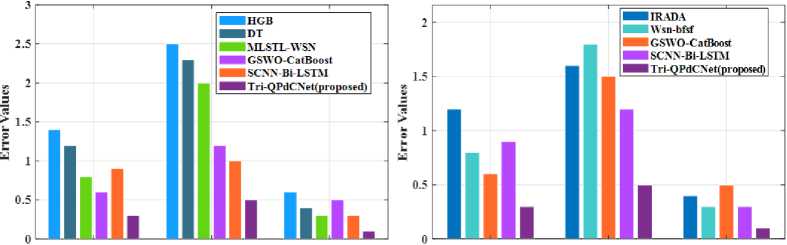
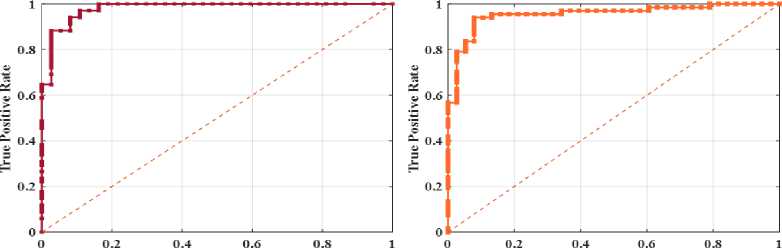
In figures 7(a) and 7(b), bar charts are shown with Mean Absolute Error (MAE), Root Mean Square Error (RMSE), and Mean Square Error (MSE) for the models on WSN-DS and WSN-BFSF, respectively. The proposed Tri-QPdCNet model obtains the lowest errors in terms of all four measurement metrics in comparison with other models. In both cases, the ROC curves of 7(c) and 7(d) denote high classification performance with an area under the curve (AUC) evaluated very close to 1, which points to higher model discrimination. Using both the error metrics and subsequent classification accuracy, the Tri-QPdCNet demonstrates a set of positive outcomes.
Figure 8 analyzes the real-world deployment cost of the proposed CA-PoA-BE blockchain framework in wireless sensor networks. Figure 8(a) shows the cost distribution across major factors, where energy consumption (25%) is the largest contributor, followed by hardware, scalability, and deployment costs (20% each), while communication overhead (15%) has the lowest impact. Figure 8(b) presents cumulative cost implications, confirming that although blockchain introduces additional resource requirements, the overall trade-off remains feasible, enabling secure anomaly detection without critically burdening WSN resources.
MAE RAISE MSE MAE RAISE MSE
(a) (b)
False Positive Rate False Positive Rate
(c)
(d)
Fig.7. Error metrics and ROC curve analysis for WSN-DS and WSN-BFSF models
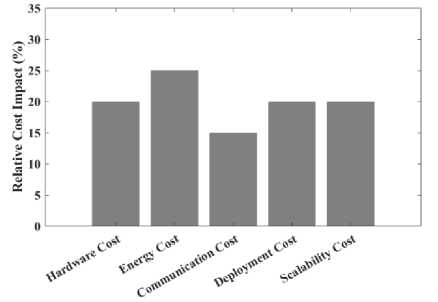
Fig.8. Real-world deployment cost of blockchain infrastructure in WSNs
-
4.3. Statistical Analysis
-
4.4. Ablation Study
The statistical analysis evaluates the performance of intrusion detection methods across two benchmark datasets: WSN-DS (Dataset 1), which contains diverse Denial-of-Service (DoS) attack types, and WSN-BFSF (Dataset 2), focused on Blackhole, Flooding, and Selective Forwarding attacks. By comparing accuracy, confidence intervals, and p-values, table 6 highlights the effectiveness of existing models and validates the superior reliability of the proposed Tri-QPdCNet framework.
Table 6 presents the statistical analysis comparing existing methods with the proposed Tri-QPdCNet. Across both WSN-DS and WSN-BFSF datasets, Tri-QPdCNet achieves the highest accuracy (99.4% and 99.2%) with narrow confidence intervals, demonstrating consistent reliability. Its p-values (1.0e-30, 1.0e-28) confirm statistically significant superiority over prior methods such as GSWO-CatBoost (98.5%, 98.0%) and SCNN-Bi-LSTM (98.9%, 98.6%). These results highlight the robustness of Tri-QPdCNet in outperforming existing intrusion detection models.
The ablation study in Table 7 evaluates the individual impact of key components within the proposed framework, namely Lo-GDN, BoT-CHO, and RMRO. By systematically removing each element from Tri-QPdCNet, the analysis reveals how performance is influenced on both WSN-DS (Dataset 1) and WSN-BFSF (Dataset 2). This comparison highlights the necessity of each module and demonstrates that the full integration yields the highest accuracy and robustness.
Table 6. Statistical analysis of the proposed method
|
Methods |
Dataset 1 |
Dataset 2 |
||||
|
Accuracy (%) |
95% CI |
p-value |
Accuracy (%) |
95% CI |
p-value |
|
|
HGB [16] |
96.80 |
(96.67 – 96.93) |
6.26e-284 |
96.20 |
(96.05 – 96.35) |
5.90e-274 |
|
DT [17] |
95.10 |
(94.94 – 95.26) |
0.00e+00 |
94.50 |
(94.32 – 94.68) |
0.00e+00 |
|
MLSTL-WSN [17] |
97.50 |
(97.38 – 97.61) |
4.94e-186 |
96.90 |
(96.76 – 97.03) |
6.41e-190 |
|
IRADA [18] |
96.40 |
(96.26 – 96.53) |
0.00e+00 |
95.80 |
(95.64 – 95.95) |
0.00e+00 |
|
Wsn-Bfsf [19] |
97.90 |
(97.79 – 98.00) |
1.85e-133 |
97.30 |
(97.17 – 97.42) |
1.41e-144 |
|
GSWO-CatBoost [20] |
98.50 |
(98.41 – 98.59) |
1.21e-62 |
98.00 |
(97.89 – 98.11) |
8.39e-73 |
|
SCNN-Bi-LSTM [22] |
98.90 |
(98.82 – 98.97) |
6.33e-25 |
98.60 |
(98.50 – 98.69) |
2.53e-24 |
|
Tri-QPdCNet (Proposed) |
99.40 |
(99.34 – 99.45) |
1.0e-30 |
99.20 |
(99.13 – 99.27) |
1.0e-28 |
Table 7. Ablation study of the proposed method
|
Methods |
Accuracy (%) |
|
|
Dataset 1 |
Dataset 2 |
|
|
Tri-QPdCNet without Lo-GDN |
96.80 |
96.20 |
|
Tri-QPdCNet without BoT-CHO |
97.40 |
96.90 |
|
Tri-QPdCNet without RMRO |
98.60 |
98.20 |
|
Proposed Model |
99.40 |
99.20 |
Table 7 presents the ablation study analyzing the contribution of each component in the proposed framework. Removing Lo-GDN reduces accuracy to 96.8% and 96.2%, showing its role in capturing local graph dependencies. Excluding BoT-CHO achieves 97.4% and 96.9%, reflecting weaker contextual optimization. Without RMRO, performance improves but remains lower at 98.6% and 98.2%, highlighting the optimizer’s importance. The full proposed model delivers the highest accuracy (99.4%, 99.2%), confirming the complementary impact of all components.
4.5. Discussions
5. Conclusions
The results demonstrate the effectiveness of the proposed Tri-QPdCNet with CA-PoA-BE blockchain integration in improving anomaly detection and security within WSNs. The simulation setup (Table 2) included 100–120 sensors, a sensing range of 50 m, transmission range of 40–80 m, and initial energy of 0.5 J. Training was performed with RMRO optimization, ReLU and Softmax activations, 0.001 learning rate, 64 batch size, 100 epochs, and a dropout of 0.3. Implementation details confirmed reproducibility using WSN-DS and WSN-BFSF datasets, with Lo-GDN preprocessing to enhance feature quality.
Dataset descriptions (Section 4.1, Table 3) highlight the diversity of attack and normal traffic samples, ensuring robust evaluation across both datasets. Performance metrics (Table 4) guided the evaluation, covering accuracy, precision, sensitivity, specificity, and RMSE. Comparative blockchain analysis (Table 5) shows that Tri-QPdCNet surpasses prior methods with consensus efficiency (99.5%), fault tolerance (99.4%), security (99.6%), storage efficiency (99.2%), and execution time (85 ms), indicating superior reliability.
The confusion matrices in Figure 4 reveal high classification accuracy across all classes, with only limited misclassifications. Similarly, Figure 5 confirms detection accuracy above 99% across multiple attack types, supported by consistently low FRR and FNR values. Performance metrics in Figure 6 demonstrate accuracy of 99.4% (WSN-DS) and 99.2% (WSN-BFSF), alongside efficient transaction costs. Error metrics and ROC analysis (Figure 7) further validate the model’s robustness, with AUC values approaching 1.
Finally, Figure 8 presents real-world deployment costs of CA-PoA-BE, showing energy (25%) as the highest factor but confirming feasibility under balanced trade-offs. Statistical analysis (Table 6) and ablation study (Table 7) underline the model’s superiority, with accuracy gains attributable to Lo-GDN, BoT-CHO, and RMRO integration. Overall, results validate the framework’s scalability, efficiency, and resilience for WSN security.
The proposed framework provides an advanced solution for resilient, proactive anomaly detection in Wireless Sensor Networks (WSNs). Implemented in NS-2, this framework showed high efficiency for all special indexes, including detection accuracy, precision, recall and F1-score, exceeding 99%. Through this, blockchain and a graph attention mechanism are implemented to guarantee high accuracy in detecting corrupted nodes and reliable isolation of such nodes to minimize their negative impact on other nodes. The main benefits are extensibility to easily scale up the cellular depth in environments with high node density in WSN and decentralized data storage through IPFS, which prevents single points of failure and tamper attacks. It is envisaged that the combination of blockchain and attentionbased convolutional mechanisms guarantees high accuracy in detecting the malicious nodes and provides the corresponding isolating mechanisms to prevent the overall network from being compromised. The key benefits include extensibility in WSN contexts with a large nodal density and use of distributed data storage based on the IPFS that proactively addresses the issues of single-point failures and tampering risks.
The proposed framework is well-suited for real-time applications in domains such as smart cities and environmental monitoring, where timely identification and isolation of malicious nodes are critical. However, limitations remain in terms of computational cost, scalability under heavy data flow, and the energy overhead introduced by blockchain integration at cluster heads or gateways. Addressing these issues through lightweight optimization strategies and advanced consensus mechanisms forms a promising direction for future work, enabling broader applicability to large-scale WSN deployments with improved efficiency and robustness.
Author Contributions Statement
N. Jayanthi- Formal analysis, Investigation, Resources, Validation, Writing - Original Draft Elangovan Muniyandy- Project administration, Data Curation, Software.
All authors have read and agreed to the published version of the manuscript.
Conflict of Interest Statement
