Boundaries, structure, and integrity of the occupation layer at the Gordinskoye I (Guryakar) fortified settlement, Udmurtia (9th–13th centuries), according to multispectral imaging
 fortified settlement, Udmurtia (9th–13th centuries), according to multispectral imaging")
Author: Zhurbin I.V.
Journal: Archaeology, Ethnology & Anthropology of Eurasia @journal-aeae-en
Section: The metal ages and medieval period
Article in issue: 2 т.52, 2024.
Free access
Science-based studies at Gordinskoye I (Guryakar) fortified settlement in northern Udmurtia (9th–13th centuries AD) were carried out. The occupation layer had been largely destroyed by plowing. The statistical analysis of multispectral images and segmentation of the generated images of vegetation distribution make it possible to assess the integrity of the occupation layer. The preliminary conclusion about the presence of its parts, varying in thickness, is based on the analysis of the configuration of areas of segmented multispectral images and the correspondence of diverse segments to relief features. Assessment of archaeological context and of the preservation of occupation layer (superficially disrupted, replaced, or transported) is possible only with the use of geophysical and soil studies and targeted excavations. The available reference data allow us to interpret individual segments present solely on the flat surface of the promontory. The assessment of the parameters of the occupation layer within the entire survey area is possible through the extrapolation of properties of vegetation segments with known characteristics. Based on the totality of data, it can be assumed that the built-up area of Guryakar was limited by the outer fortification line. A thick occupation layer is localized on the promontory, within two inner structural parts of the site. Two other parts of Guryakar, situated between the residence area and the outer fortification line, were probably used for utility purposes and manufacture. The deposition of the medieval occupation layer was less intense there. Additional markers of the fortifications, delimiting the boundaries of the settlement’s structural parts, are vertically oriented linear areas of the transported layer on slopes of the promontory.
Short address: https://sciup.org/145146985
IDR: 145146985 | DOI: 10.17746/1563-0110.2024.52.2.100-107
Text of the scientific article Boundaries, structure, and integrity of the occupation layer at the Gordinskoye I (Guryakar) fortified settlement, Udmurtia (9th–13th centuries), according to multispectral imaging
Remote sensing offers a considerable extension of the limits of archaeological studies (Lasaponara, Masini, 2012; Luo et al., 2019). This technique allows us to examine not only the territory of sites, but also large surrounding area. In the conditions of surfaces flattened by plowing, typical for archaeological sites in central Russia and western Urals, vegetation traits of the occupation layer (density and length of the modern plant cover) can be more informative. One of the factors accounting for the diversity of vegetation across the site area and in its vicinities is the content of anthropogenic organic remains in the occupation layer. Multispectral imaging makes it possible to subdivide the territory of the settlement and surrounding area by differences in the vegetation cover. The consecutive comparison with geophysical, soil, and archaeological data allows the interpretation of the diverse
areas (Luo et al., 2019; Mozzi et al., 2016; Wadsworth, Supernant, Kravchinsky, 2021).
At sites of the Cheptsa culture (9th–13th centuries, northern Udmurtia), three types of the occupation layer were identified (Zhurbin, Borisov, Zlobina, 2022). In the superficially disrupted layer, only lower horizons are preserved in situ , while upper horizons are destroyed by plowing. The replaced layer is viewed as the extreme condition of the previous one, where only the bottom parts of structures dug into the parent material are preserved. The destroyed upper horizons are distributed over the site’s territory and surrounding area; erosional processes transport them into subordinate forms of landscape. The presence of the transported layer in combination with superficially disrupted and replaced ones serves as evidence of an archaeological site.
Principle findings of studies at the Guryakar fortified settlement
The Gordinskoye I fortified settlement of Guryakar is considered a key medieval center in the Cheptsa River basin (Ivanova, 1998: 218–224). The site is located on the southwestern outskirts of Gordino village (Balezinsky District of Udmurtia), on a promontory of a bedrock river terrace (Fig. 1). Owing to the close proximity to Guryakar village, the settlement was subjected to a heavier distraction than other Cheptsa sites. The 1615 inventory books mention a “meadow at Fort Gordinskoye” (Luppov, 1958: 189). In the late 19th century, the area was plowed, while the territory of the outer rampart was occupied by a peasant vegetable garden (Pervukhin, 1896: 53). M.G. Ivanova, who in 1979 conducted the first and the only large-scale excavations there, also mentioned that the settlement area had been plowed (1982). Initially, it was believed that there were two fortification lines protecting the settlement (Pervukhin, 1896: Fig. 35, 36). Later on, V.A. Semenov (1957: 34, 35) made an assumption about the third fortification line. At present, the fortifications are hardly visible in the landscape because of many years of plowing (Arkheologicheskaya karta…, 2004: 119, 120).
As the archaeological data are scarce, interdisciplinary studies have been conducted at the site (Fig. 1): aerial photography (visible range and multispectral imaging), resistivity and magnetometry surveys, and soil coring (with assessment of the granulometric composition and chemical and biological properties of cores).
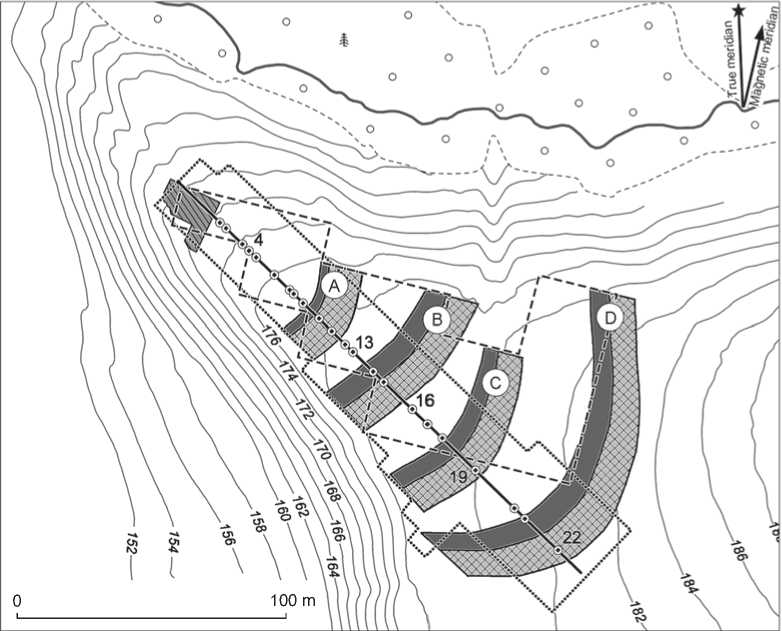
Fig. 1 . Topographic plan of the Gordinskoye I fortified settlement of Guryakar (base by N.G. Vorobieva, Finko LLC; addition by R.P. Petrov, Udmurt Federal Research Center, Ural Branch, Russian Academy of Sciences).
1 – resistivity survey; 2 – magnetometry survey; 3 – electrical resistivity tomography profile; 4 – excavation; 5 – soil cores;
6 – fortifications; 7 – fortification lines.
The comparison of data received by independent science-based methods and by excavations provided fundamentally new information for the reconstruction of Guryakar (Zhurbin, 2020: 84–96). In particular, the interdisciplinary studies have revealed the fourth fortification line. The layout of all structural elements of the settlement was reconstructed. It was suggested that although the Guryakar area had expanded more than once, the uninterrupted occupation and utility zones had remained within the promontory part, being limited by the inner fortification line (A) without expanding beyond the next one (B). A thick occupation layer was recorded there. A quite different situation can be observed in the outer part of the settlement (between B and C, C and D fortification lines): the occupation layer is more homogeneous, and the density of geophysical anomalies is far less. The structure of this sort normally corresponds to utility and production zones of medieval settlements. This reconstruction coheres with the results of archaeological studies carried out at other Cheptsa settlements, where various zones differ in the thickness and structure of the occupation layer. Soldyrskoye I fortified settlement of Idnakar most vividly demonstrates these tendencies. All structural parts were examined there by large excavated areas (Ivanova, 1998: 30, 66, 71–73, 81–85). Excavations at Kushmanskoye (Uchkakar) (Zhurbin, 2020: 98, 99) and Vesyakarskoye (Vesyakar) (Ibid.: 107–111) fortified settlements also revealed dissimilarities in layouts and in the thickness of culture-bearing deposits in different zones.
Methods
Aerial photography in the visible range (Fig. 2, a ) was carried out using a Supercam S350-F unmanned
0 100 m
Spectral reflectance max j^^^^^^^lniin
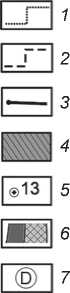
Fig. 2 . Orthophotomap of Guryakar ( a ) and reflection maps in Green ( b ), Red ( c ), and NIR ( d ) bands.
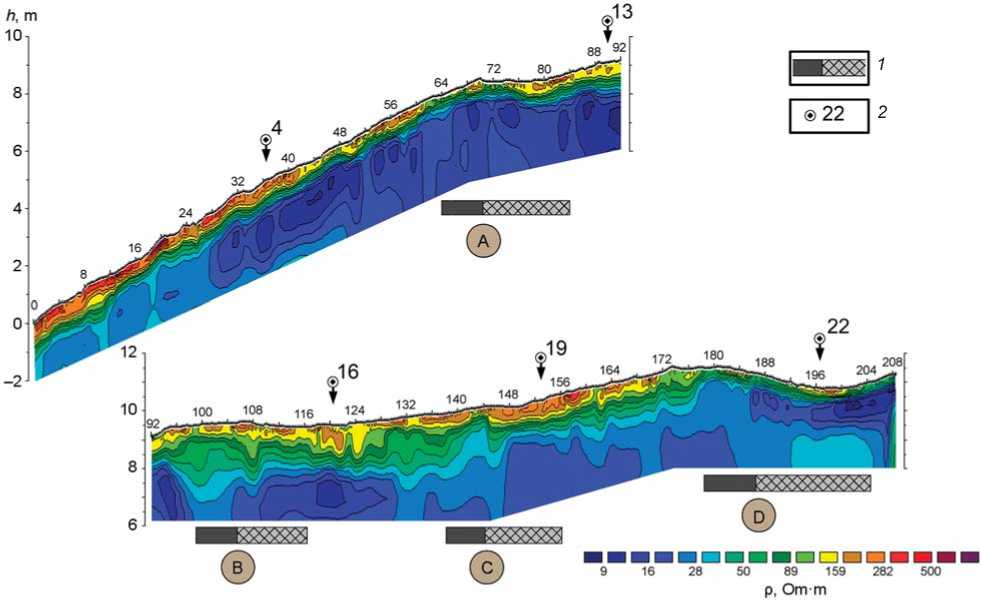
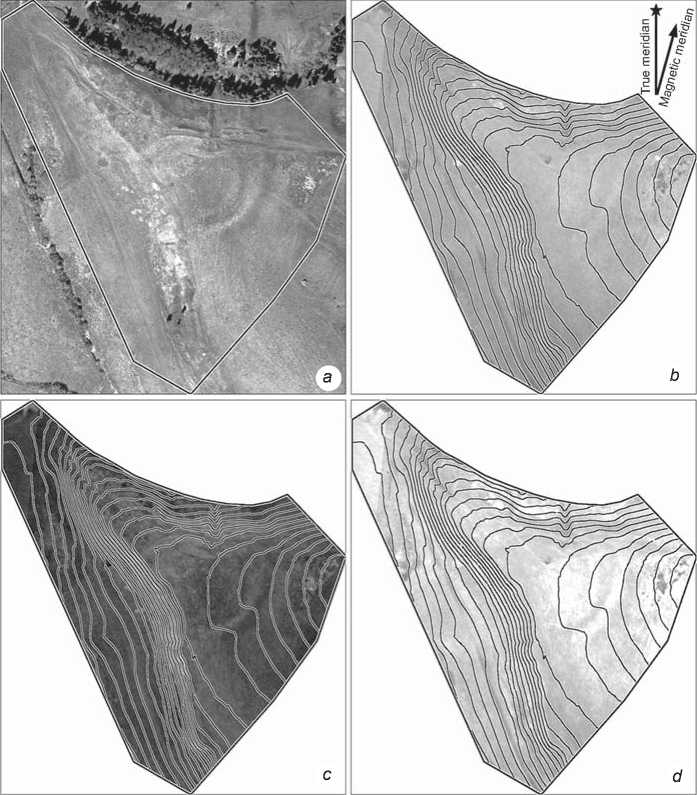
Fig. 3 . Geoelectric section.
1 – fortifications; 2 – soil cores.
aerial vehicle ( Finco LLC, Izhevsk). A high-precision topographic plan of Guryakar was thus made; coordinate referencing of geophysical study areas, soil coring points, and excavation area was performed (see Fig. 1). A series of images made with a multispectral camera in Green, Red, and NIR bands (see Fig. 2, b–d ) was received. These make it possible to assess changes in the vegetation corresponding to areas varying in thickness of the occupation layer.
Terrestrial geophysical survey was carried out, using resistivity and magnetic prospecting methods (Zhurbin, 2020: 87–89). In order to reconstruct the deep structures of the revealed anomalies and to assess the thickness of the occupation layer, the electrical resistivity tomography data were used (Fig. 3). Geophysical methods, as compared to aerial photography, provide the information only about a fragment of the study area––a flat surface of the promontory (see Fig. 1).
Soil coring of areas varying in geophysical characteristics was carried out (Derendyaev, 2018: Suppl. 1). Soil cores were taken on the line of the electrical resistivity tomography profile (see Fig. 1), which made it possible to compare results of the soil studies with geophysical data. The analysis of granulometric composition and morphology of soils along the whole length of the core provided an opportunity to assess the thickness and structure of culture-bearing deposits
(Fig. 4). Examination of chemical and physical properties of the soil samples (pH, urease activity, content of phosphates, magnetic susceptibility) gave ground for delimiting residential and utility zones of the settlement (Zhurbin, Borisov, 2020).
Multispectral imaging: segmentation and interpretation of data
All the images received demonstrate contrasting differences between vegetation on the flat surface and on the promontory slopes. Modern disturbances, such as a garbage dump in the eastern part of the area, field roads, and pits, are also visible. In Green band (see Fig. 2, b), only these elements are distinct, while the rest of the image is virtually homogeneous. In distinction from it, Red and NIR bands (see Fig. 2, c, d) demonstrate areas of varying vegetation cover. For example, in Red band, the zone of patchy vegetation is located on the promontory part of the site, approximately up to fortification line C (see Fig. 1). The rest of the territory (with the exception of an arciform area, possibly corresponding to the buried base of a rampart in line D) is rather homogeneous. This part differs significantly in reflectance from the promontory part. In NIR band, the vegetation cover is displayed in more detail. In the promontory part and between fortification lines C and D, numerous local inhomogeneities are located. A rather homogeneous zone separates these areas. Outside fortification line D, the concentration of inhomogeneities significantly reduces. Results of multispectral imaging on the whole supplement the image in the visible range (see Fig. 2, а). However, the raw images do not allow us to determine reliably the location of areas differing in thickness of the occupation layer.
To evaluate the tendencies in the distribution of the occupation layer across the site and the adjoining area, statistical analysis was used (Zlobina et al., 2021), including Haralick’s algorithm, principal component analysis, and segmentation through k-means clustering. Segmentation implies finding non-overlapping areas of the image, each of which is characterized by similar properties such as intensity and density of vegetation, as well as thickness and saturation of the occupation layer. Results were interpreted by comparing the revealed segments with reference samples.
Given the plowing, to which the site area was subjected over many years, and the accompanying erosion, the content analysis of the segments must be carried out with regard to the relief (flat surfaces on the
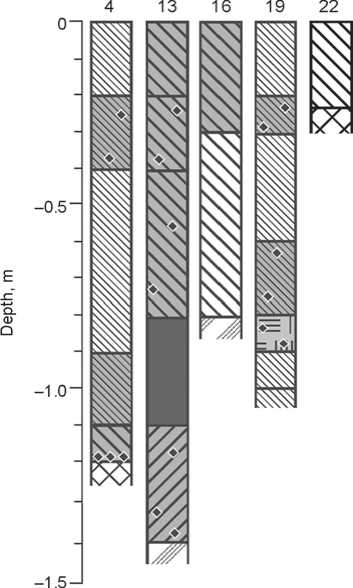
Fig. 4 . Lithological structure of typical cores (drilling and interpretation by A.V. Borisov, Institute of Physicochemical and Biological Problems in Soil Science, Russian Academy of Sciences, Pushchino).
1 – silty loam; 2 – sandy loam; 3 – clay; 4 – marl; 5 – burnt clay; 6 – wood residues; 7 – coal; 8 – layers with artifacts.


promontory and below versus slopes). Also, reference samples make it possible to interpret only segments on the surface of the promontory. Therefore, the assessment of the occupation layer in the remaining parts of the site is based on the extrapolation of segment properties with known parameters.
In the promontory part, including fortification line B, patches of class 1 vegetation prevail (Fig. 5, а ). Geoelectric section shows considerable thickness of the occupation layer (see Fig. 3). This estimation is confirmed by the results of soil coring (see Fig. 4, cores 4 and 13). It also accords with archaeological observations: near the eastern side of the excavation, the thickness of culturebearing deposits outside the deepened objects reaches 1.2 m (Ivanova, 1982: Fig. 5). The maximum resistivity in the whole section (see Fig. 3, 0–42 m diapason) testifies to the high concentration of remains of anthropogenic activities in the humified layer of the promontory part. The analysis of chemical and physical properties of soil samples also points to this (Zhurbin, Borisov, 2020: Tab. 7). A synchronous rise in magnetic susceptibility and phosphate content in the area within fortification line A indicates the intense residential use. The highest values of these properties were recorded in culture-bearing deposits preserved in situ under the topsoil horizon. The totality of reference data suggests that in the promontory part, the segments of class 1 mark a thick superficially disrupted layer saturated with remains from anthropogenic activities.
Areas of class 2 vegetation are few and adjoin the segments of class 1 (see Fig. 5, а ). On the basis of resistivity level, it can be conjectured that these correspond to a thinner superficially disrupted layer with high content of anthropogenic activity remains.
Segments of class 3 vegetation (see Fig. 5, а ) are characterized by medium values of resistivity (see Fig. 3, 120–180 m diapason) and by the thick humified layer (see Fig. 4, cores 16 and 19). This can be possibly explained by small amount of anthropogenic activity remains. The range of magnetic susceptibility and quantity of phosphates are significantly lower there (Ibid.) and close to values from the soil horizons of the bottom part of the occupation layer in the promontory area (buried soil on which the residential zone was formed). Such values might be determined by relatively small anthropogenic impact over these territories (possibly, utility and production zones of Guryakar). The lower building density is evident in the layout of the settlement reconstructed by the complex geophysical survey (Zhurbin, 2020: Fig. 2.34). Hence, the segments of class 3 vegetation can be classified as a thick superficially disrupted layer with a low concentration of anthropogenic remains. This situation prevails between fortification lines B and D.
The segments of classes 1–3 occupy the whole flat surface of the promontory, up to fortification line D.
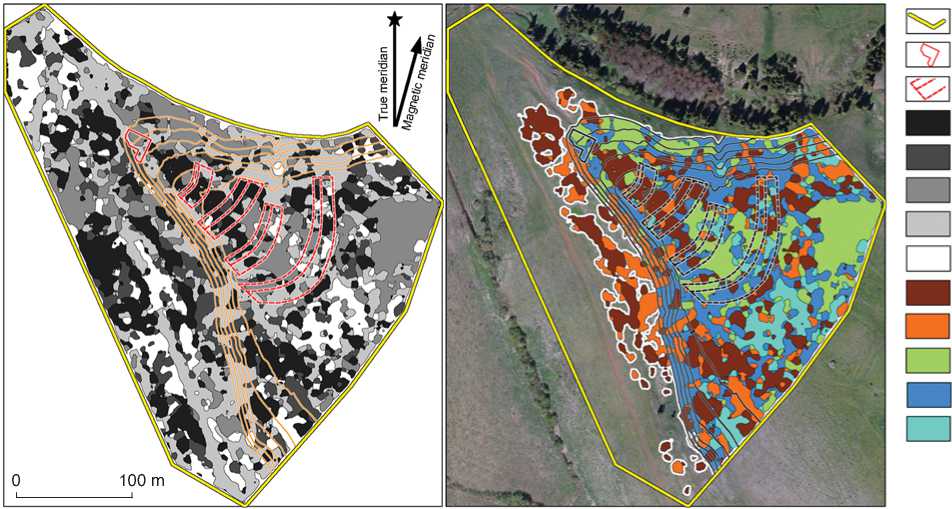
100 m
b
а
Fig. 5 . Results of segmentation ( a ) and interpretation of the segments ( b ).
1 – boundaries of the statistical analysis area; 2 – excavation; 3 – contour of fortifications; 4–8 – areas of vegetation of classes 1 ( 4 ), 2 ( 5 ), 3 ( 6 ), 4 ( 7 ), and 5 ( 8 ); 9 , 10 – saturated superficially disrupted and transported layer (thick and thin, respectively); 11 – thick unsaturated superficially disrupted layer; 12 – replaced layer; 13 – areas with minor anthropogenic transformation.
Vegetation cover of class 4 prevails along the perimeter of this territory, in the area passing from the flat surface to slopes. In such areas, an intensive transit of soil and ground material to subordinated landforms is observed. Therefore, in these segments, culture-bearing deposits show a low thickness of humified layer (see Fig. 3, 188– 208 m diapason). The situation of this sort is evident in core 22 (see Fig. 4), where the parent material is overlain by the topsoil only, that corresponds to the replaced cultural layer.
An absolute majority of class 5 segments are located on the flat surface of the promontory outside fortification line D and on flat areas of the Cheptsa River flood plain (the western periphery of the study area) (see Fig. 5, а ). Configuration and large size of these segments, as well as their location, suggest that these are areas of natural environment that were not exposed to severe anthropogenic impact.
The tendencies in the vegetation distribution on the hill slope require special consideration. Segments of classes 1 and 2 are visible on the southwestern slope of the promontory. Their distinctive features are the linear shape and location along the settlement ground delimited by fortification line D. Notably, on the slopes outside this line, only local segments of classes 1 and 2 are present. The location and configuration make it possible to correlate them with transported occupation layer that was shifted by horizontal erosion into subordinate landforms. This speculation is based on the results of studies conducted at another Cheptsa settlement–– Kushmanskoye III (Zhurbin, Borisov, Zlobina, 2022). The statistical analysis of organic carbon content, number of thermophilic bacteria, activity of urease and phosphatase enzymes in soil samples has shown that the transported occupation layer retains chemical and biological traits of the initial horizon. The vegetation cover in areas of the transported layer is therefore comparable with the vegetation of segments in the superficially disrupted layer (classes 1 and 2 for Guryakar).
Conclusions
Assuming that tendencies in the distribution of the occupation layer within the site and the adjoining area mirror the thickness of the initial cultural deposits, the structure and boundaries of Guryakar can be interpreted as follows (see Fig. 5, b ). The built-up area of Guryakar was presumably limited by the outer fortification line. In this zone, the vegetation is rather homogeneous: large parts of the superficially disrupted layer (classes 1–3) are surrounded by segments of the replaced horizon (class 4). The vegetation structure changes significantly outside fortification line D. Areas of all the revealed classes are represented there. Segments of vegetation correlating with a weakly humified layer (classes 4 and 5)
prevail. Areas of the transported layer (linear in shape) on the promontory slopes (classes 1 and 2) can serve as another evidence attesting to the presence of the original culture-bearing deposits. Their location corresponds to the identified segments of the superficially disrupted layer. Accordingly, the uninterrupted area of the transported layer on the slopes can correspond to the residence zone, where the thickest and the most saturated deposits were formed.
Additional markers of the fortifications, delimiting the boundaries of the settlement’s structural parts, are the vertically oriented linear areas of the transported layer on slopes of the promontory. Their origin is presumably connected with water erosion, when intensive water streams flowing down the moats provide the transit of the occupation layer destroyed by plowing to the areas below the moat’s mouth. At Guryakar, such areas are located on the southern slope of the promontory, below fortification lines C and D. The location of all the fortifications at the settlement was determined through the multidisciplinary geophysical and soil studies (Zhurbin, 2020: 89–94).
The initial thickness of the occupation layer in various structural parts of the site is marked by the thickness and saturation of the remaining cultural deposits. The most significant superficially disrupted layer has been revealed in the promontory part delimited by fortification line B. In the area separating lines B and D, the preservation of cultural deposits is much worse. The inner structural parts of Guryakar (delimited by fortification lines A and B) are presumably residential and utility zones, with a thick occupation layer containing numerous materials of anthropogenic origin. The outer parts (delimited by fortification lines C and D) were probably used for utility purposes and manufacture. The medieval occupation layer was formed less intensively there. This supposition agrees with the layout of Guryakar reconstructed on the basis of geophysical and soil study findings (Ibid.: Fig. 2.34).
The generally tentative conclusion about the presence of the occupation layer varying in saturation and thickness can be based on the analysis of configuration of the segmented multispectral images and on the correspondence of various segments to topographic features. The assessment of the archaeological context and of the preservation of deposits (superficially disrupted, replaced, or transported) can be made only with the use of reference samples resulting from geophysical and soil studies and excavation findings.
Acknowledgements
This study was supported by the Russian Science Foundation (Project No. 22-28-00189). I am thankful to A.G. Zlobina,
A.S. Shaura, and A.I. Bazhenova from the Udmurt Federal Research Center, Ural Branch, Russian Academy of Sciences (Izhevsk) for the statistical analysis of the multispectral images.
