Calculation of Overvoltage and Estimation of Power Transformer’s Behavior When Activating the Reactors

Author: Slobodan Bjelić, Zorica Bogićević
Journal: International Journal of Information Technology and Computer Science(IJITCS) @ijitcs
Article in issue: 12 Vol. 6, 2014.
Free access
The document illustrates the methods and algorithms for calculation of overvoltage at the power transformer excerpts during the activation of inductive consumer to secondary transformer. Characteristic stages are activation of the primary phase and followed by two other phases. The new specific condition occurs during the activation of each phase which is presented by alternative electric circuit and simplified equivalent scheme that is used to calculate the values and evaluate overvoltage. For selected parameters of the transformer and inductive loads, the simulation is performed with chosen MATLAB software package.
Algorithm, Calculation, Estimation, Over Voltage, Transformer, Inductive Load
Short address: https://sciup.org/15012209
IDR: 15012209
Text of the scientific article Calculation of Overvoltage and Estimation of Power Transformer’s Behavior When Activating the Reactors
Published Online November 2014 in MECS DOI: 10.5815/ijitcs.2014.12.09
-
I. Introdaction
The simulation of electromagnetic transients is shown in the power transformer based on the theoretical model with complete analysis of the state of the transformer [1]. When switching the reactive consumers in the secondary circuit of a three-phase transformer, more complex problems occur because the process depends on the type of transformer coupling and the possible appearance of unbalance and harmonics in distribution networks [2]. Possible methods for examine this problem are: analytical methods, numerical programming, supporting access, the algorithms based on artificial intelligence, algorithm graphical testing [8], partially resulting algorithms and tables explored algorithms....
This paper presents simple equivalent circuits for analyzing phenomena on the three-wire power transformer while switching the three-phase reactor with a given value of the linear inductance parameter. All the influential parameters are taken into account while less influential parameters are ignored. Using this method, the excitation voltage on the transformer’s secondary where reactor is switched on with earthed neutral point can be evaluated.
Mathematical model of power transformer is completely derived from the literature [1], and is based on the model derived in the software package MATLAB and Simulink [7]. The simulation’s goal of the set theoretical models is to obtain relevant information about the behavior of the power transformer in the transition processes.
The remainder of this paper is organized as follows: Section II gives an analytical model of the overvoltage phenomenon, asymmetry and harmonics while switching passive linear parameters such as inductance of the reactor. The active resistance in the electrical circuit absorbs the oscillations but it doesn’t influence on their character and this parameter is negligibly small because of simplified calculation.
Section III describes dynamic changes in power transformer (Yd11). The MATLAB Simulink has analysed the significant overvoltage on secondary extracts because of unsynchronised inclusion of phases (a, b, c) during the inclusion of the three-phase grounded reactor to the secondary transformer.
Simulation (Section IV) –The simulation model analyses the characteristic involvement of the state of the first stage (a), then the inclusion of the other two phases (b and c).The specific state occurs during the inclusion of each phase that is used for calculation of values and overvoltage valuation.
The phenomenon of overvoltage was successfully analysed by using the simulation. While measuring the overvoltage at the contact switches using the described method, the evaluation of their values is presented as well as their time course. The diagram presents commutation at each time point. Conclusion and future work are presented in the final section.
-
II. Analytical Method
The analytical methods are used, for the duration of the overvoltage survey and the emergence of asymmetry and harmonics while inclusion of linear passive parameters, such as inductance of the reactor.
An active resistance in electric circuit muffles the oscillation but doesn’t affect their character which justifies the presumption that, for the simplicity of the calculation, there is no parameter of active resistance, as shown in figure1. For ease of calculation in the round has no parameters of active resistance. The function related to the oscillation muffling can be added to the obtained result if it is of interest for obtaining exact values.
∆ v (0) = v (0) - v *(0), - difference of the current value of the voltage v (0) and the voltage at the time of closing contact (K), v * (0) .
AC

C 1
v 1 (t)

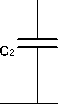
v *( t ) = 1 2 its own angular frequency
(1 + L 1 )(1 - ω )
L 2 ν 2
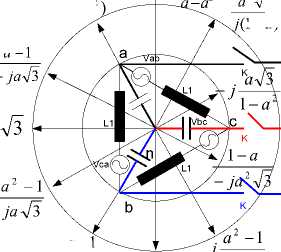
Fig. 1. Single-line representation of a back-to-back situation
It is known [3-4] that the parallel electric fields in which the inductance and a second capacitance greater contribution to the oscillation gives the branch where it accumulates more energy. That is why calculation and evaluation the transition process that occurs when switching inductive loads on the transformer [1, 8] it is possible to omit the mutual inductance of the transformer, which is much larger than the inductance of the reactor. For the same reason it is omitted capacitance of the primary windings of the transformer compared to the capacitance of strong source [1, 6, 15].
Under such assumptions, the formed scheme of Figure 1 in that it applies:
v ( t ) = V sin( ω t + ϕ ), - electrical voltage source,
circuit in the figure, after the closing of the contact K.
On the basis of the relation (2) the voltage on C after the ignition of contact K has two components: 1. voltage of stationary condition after closing the contact; 2. component that characterizes transient phenomenon and oscillates with frequency ν and amplitude Δ v (0) .
This logical thinking can be applied to three-pole power up, but we need to know that, when you power up, and assuming the equally spaced contacts in other two phases, turn on of all three phases cannot simultaneously
occur.
III. Switching Three-Phase Grounded Reactor on the Secundary Transformer
L - inductance of the transformer dissipation (can be increased for inductance of the transmission line directed to the secondary side of the transformer ) ,
C - capacitance of the transformer's secondary to the earth,
C - capacitance of the reactor,
L - reactor inductance or inductive load.
Calculation of overvoltage on the secondary feeder, or
the reactor, after closing contact switches can be according to the following relation [1]. :
v ( t ) = v *( t ) +∆ v (0) ⋅ cos( ν ⋅ t )
+ ∆ v (0) ω ctg ϕ sin( ν ⋅ t )
νω
For real instances ctg ϕ sin( ν ⋅ t ) << 1,
ν
made
the
expression (1) is approximated with sufficient accuracy by:
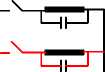
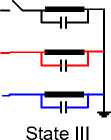
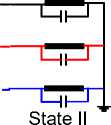
The switching of three-phase grounded reactor to the secondary transformer Yd11 is considered in figure 2, a scheme can be simplified , and it gets simpler circuit in figure 3, in which L the leakage inductance of the transformer is increased for the inductance value of power cable and directed to a secondary side.
Phase voltages are symmetric at the secondary connections (state I, figure 3.).
At switching reactor with a defined linear inductance parameter with earthed neutral point of the transformer secondary , due to unsynchronized inclusion phase (a, b, c) result significant overvoltage on secondary [11-15]. Factors that characterize overvoltage reaches the value k = 2.61.
During the approximation of contacts, through the electrical arc, the connection between the contact with the highest potential difference has been established first [7][14].This is normal to happen in the phase whose voltage passes through a maximum value at a time when the distance between the contacts has such value where amplitude of the phase voltage makes it conductive.
v ( t ) = v *( t ) + ∆ v (0) ⋅ cos( ν ⋅ t ) (2)
In relation are (2):
v ( t ) - voltage on C - from the moment of contact closure K,
v *( t ) = v 1 ( t ) voltage on the
(1 + L 1 )(1 - ω )
L ν 2
capacitance C corresponding to the stationary condition after closing contact K,
AC
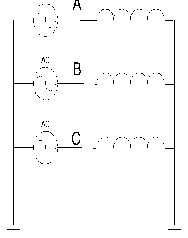
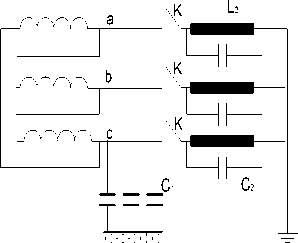
Fig. 2. Power transformer at three-pole switching on-of the reactor
-
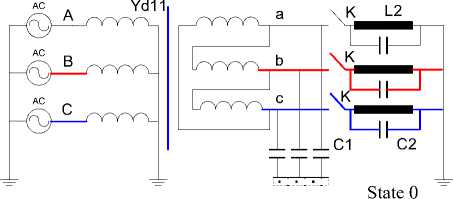
Fig. 3. Power transformer at three-pole switching-on of the reactor
j (1 - a
. V 3
- j 2
a - 1
a
-
- a2
a - 1 j 2
- j V3
(1 - a )

State I
- j V3
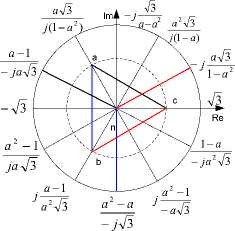
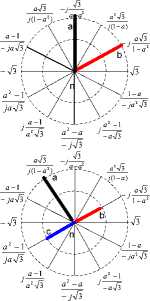
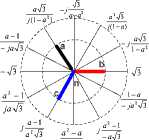
Fig. 4. Power transformer at three-pole switching-on of the reactor, equivalent diagram and states 0, I, II, III transient processes switching-on reactor.
Figure 3 illustrates the establishment of extensive contacts between secondary and the appropriate reactor connection. Phase voltage point (c) in the new stationary condition, (state II, figure 3.), changes the pre sign and value. If viewed from the secondary connections' side, a big inductive load is on the connection, and ports (a) and (b) with negligible capacitive load (self-capacitance of the secondary).
Connections (a) and (b) are on the line voltages to ground and connection (c) is on the ground potential. The transition from state 0 to state I (figure 3.), where the switching on of one phase can be treated as single-phase phenomena [1, 3], and if it happens at a time t when vc = Vm according to the scheme in figure 3, we get:
vc ( t ) = 3 ⋅ ω 2 L 2 C 1 Vm sin( ω ⋅ t + ϕ ) = 0 (3)
Δ v c (0) = V m + 3 ⋅ ω 2 L 2 C 1 V m ≅ V m (4)
From relations (2-4), it is followed that t = t potential (c) with the value of v = V fall on the ground’s potential value oscillating around that value in accordance with the equation:
vc ( t ) = Vm sin( ν 2 ⋅ t ) (5)
Where the circular frequency is dominant and correspond to the circuit condition State I, Fig. 4, when the pole is involved (c). State I, Fig. 3 has two circular frequencies that can be easily determined if the pattern of this condition is transformed into an equivalent scheme in Fig. 4.
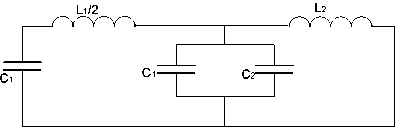
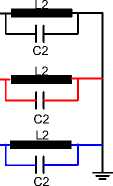
Fig. 5. Equivalent diagram from state II transient processes switching-on
For LC circuit in Fig. 5 with compiled capacitance ( C = C + C ) , own frequencies are calculated in accordance to the following relation:
11 ν 12,2 = [
1,2 2 LC
L 2 ( C 1 + C 2 ) + L 1 ( C 1 + C 2 )
± {1[ 1 +
2 LC
L 2 ( C 1 + C 2 ) + L 1 ( C 1 + C 2 )
]}2 -
L L ( C + C ) C
Harmonic with frequency ν is dominant in power overload process.
That frequency ν can be determined from (6) and in a simpler way, according to relation (7) if neglect the part that relates to the inductance leakage of the transformer L /2 on the scheme in the figure 4.
ν 2 (3 C + C ) L
The voltage on connections (a) and (b) oscillate with the same rhythm like on the connection (c) and on condenser C , because the voltage connection triangle ( d = Δ ), winding circuit is sable enough. a t the moment, which is confirmed in the simulation, voltages (a) and (b) have values
2 Vm < va = vb = - 2.6 ⋅ Vm < 3 Vm , where in phase (b) due to the growth of the stationary voltage has increasing tendency vb < - 2.73 Vm , through Δ t = π /6 ω a in the phase (a ) where stationary voltage drop has smaller value, v a <- 2.6 ⋅ V m .
If state III appear during establishing connections in phase (b), the dominant frequency isν3 , due to switching on of the second reactor ( 2 ) times higher value thanν , ν3 = ■J2ν2 .
Neutral point state II is in the middle of the voltage line V ( t ) . If it was a breakthrough in phase (a) happened in the moment t = t + π / ω or in time Δ t = π / ν after phase (c), point’s voltage (c) is changed from the moment ( t ) in accordance to relation (2) [ 7 ][ 19 ], where is approximately:
π ππ
v*(t) ≅ Vm cos ⋅sin[ω(t+ )+ ]
Δvc(0)≅-Vm[1+ 3sin(ωπ+π]
Maximal value of the connection voltage (c) to the ground after Δ t = π / v (if there is no breakthrough of phase contacts in the meantime) (a), reach the value like in state II, s approximately equal to value V m , c = (1 +7 3) V m .
The highest possible coefficient of the overload occurs if both remaining phases establish contact simultaneously e.g. at the same moment t = t + π / v . Then:
v (0) ≅ 2V cm
v * c ( t ) ≅ V m sin[( ω ( t + π ) + π ] (10)
ν 2
Overload coefficient, if dumping processes are ignored (characterized by active resistance in the circuit), each the value of ( ≅ 3 ) in the moment t = t + π + π . Circuit ν 2 ν 4
frequency is ν ≈ J 3 ν because all three inductances
L in the state II are switched on.
If it happens that breakthrough between the contacts phase (c) appeared far from the position where the maximal value of voltage is , e.g. in the moment when phase voltage (a) pass through zero value where ( ϕ = 3 π / 4), possibility of appearance of all described conditions is higher, as during the oscillatory process and phase contact breakthrough (c), phase voltage (a) change 0 ≤ va ≤ - 2 Δ v phase (b) change for :
-
- Vm ≤ vb ≤ - ( 2 V + 2 Δ v ) (11)
mb m
Because of higher value of voltage among the contacts, breakthrough appears in state I in phase (b) which results transition from oscillation to state I and in oscillating toward state III, frequency ( ν ) and only after that (figure 6., simulation diagram, after multi periodical frequency ν ) creates a contact in phase (a) and circuit with frequency ( ν ) transits into stationary condition – state II.
-
IV. Simulation
Advantages of MATLAB simulations are a number of possibilities where the simulation results are forms and obtained characteristics values of wave diagram. The model verification of transit condition was performed with a package of the MATLAB programs to simulate the psb demo by changing the position of the switch for the load parameters. The adapted part of the MATLAB – psb three phase lines was used for determining of the voltage waveforms on inductive load. All wave forms are shown in Fig. 7.
The breaker block implements a circuit breaker where the opening and closing times can be controlled either from an external Simulink signal (external control mode), or from an internal control timer (internal control mode). The arc extinction process is simulated by opening the breaker device when the current passes through 0 (first current zero crossing following the transition of the MATALAB supplement Simulink control input from 1 to 0).
Load: RLC Branch Transformer
L load [ H ] = 0.9337;
R load [ Ω ] = 0.01273;
C load [ F ] = 12.74 e - 8;
Yd 11: u =12, u = 0.5[%]
S [ MVA ] =31.5;
V n ` [ kV ] =115; V n `` [ kV ] =11.5
R T =0.0192; R T ; parale =11[Ω]
L T =1.47 e -3[ H ]≈ L T ; paralele
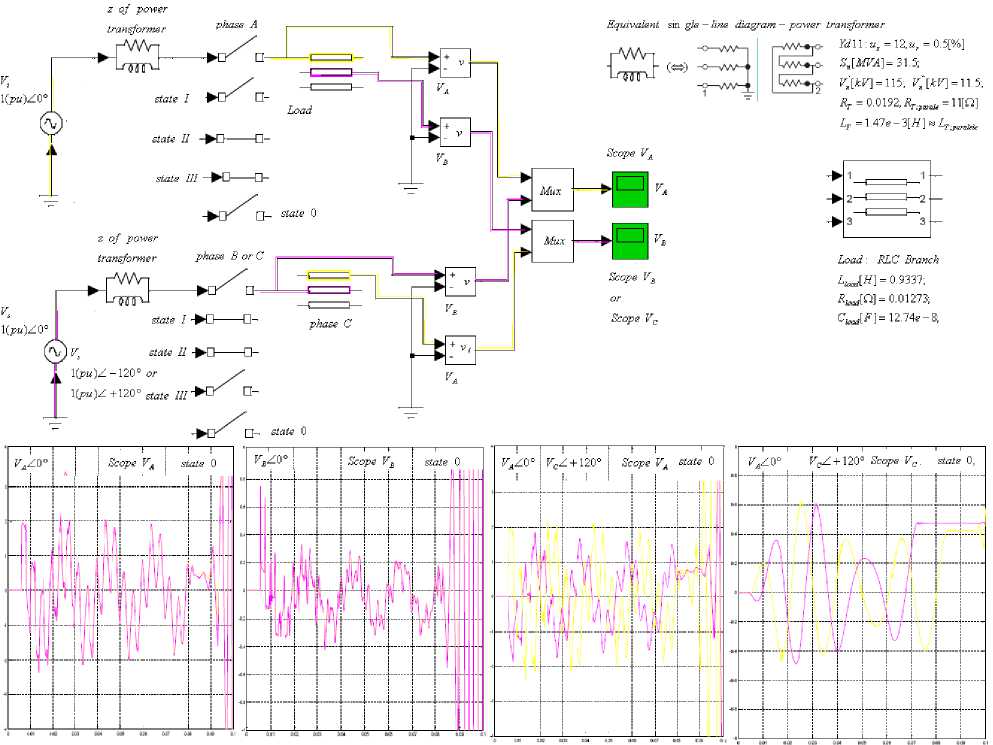
Fig. 6. a) Main scheme for simulation of transit overloads at MATLAB, b) diagrams of 0 (zero) tests
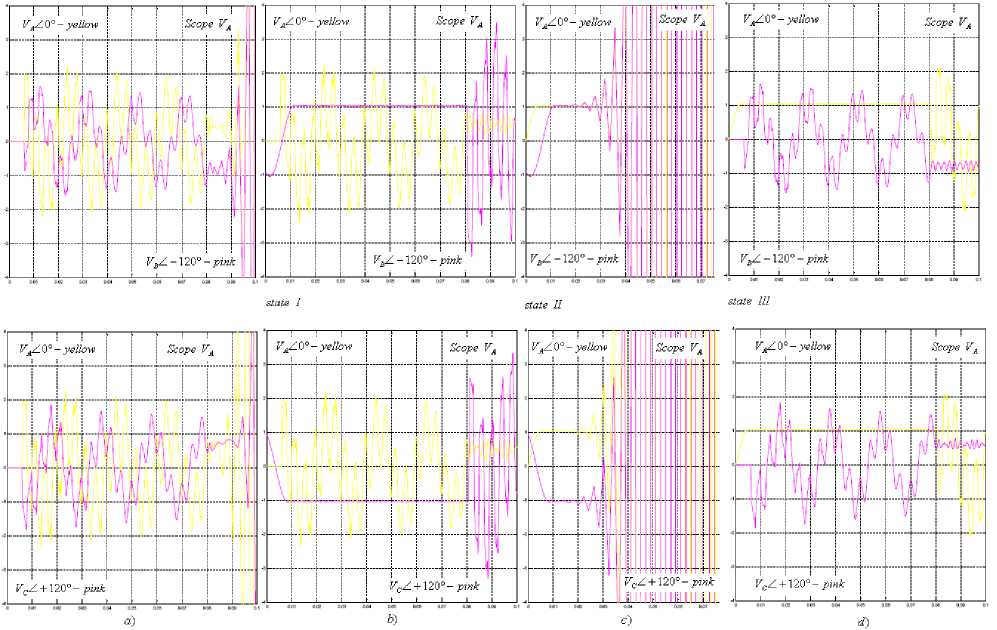
Fig. 7. Diagrams of transit overloading on transformer excerpts for different dynamic conditions - switching on and off the A, B, C phases
AC Voltage Source (mask) (link) Ideal sinusoidal AC Voltage source.
Parallel RLC Branch (mask) (link) Implements a parallel RLC branch.
-Parameters—
Breaker resistance Ron (Ohm):
0.01
Parameters
Peak amplitude (V):
Parameters
Resistance R (Ohms):
Initial state (0 for 'open', 1 for 'closed'):
Io
Phase (deg):
Frequency (Hz):
Sample time
Inductance L (H): |1 47e-3 Capacitance C (F):
Snubber resistance Rs (Ohms): [inf

Sample time of the internal timer Ts(s):
Switching times ($): [ 0.25/50 4/50 ]
Fig. 8. Information on source of parameters, switches, and parallel circuits that characterise transformer
Snubber capacitance Cs (F): [o
Voltage diagram on the secondary of the transformer with Yd connection during the inclusion and exclusion of mainly inductive load on A, B, C extract phases.
-
IV. Conclusion
The presented method and simulation enables fast and efficient process solving that is important for relay protection and automatic control (e.g. auto-reconnection and re closing to the electrical networks). Calculation and simulation can successfully replace standard tests on power transformers which can turn out to be expensive and unpredictable.
The phenomenon and assess the value of the voltage and frequency that arise during the three-phase inclusion [1-17] can be analysed successfully by using the experience in simulation of single-phase equivalent circuits related to the activation of the reactor.
The inclusion of three-phase grounded reactor to the secondary transformer is discussed in the work, because unsynchronized inclusion phase (a, b, c) resulting in significant surges in excerpts secondary. Factors that characterize transients reaches the value k = 2.61.
To determine the voltage waveforms on inductive load was used during adapted part of the package MATLAB, all waveforms are shown on the graphs, and indicate the crossing processes which may affect the functioning and cause significant damage to the transformer.
Therefore, according to the described method, the values and the time course can be estimated before measuring the overvoltage on the ignition switch. The diagram shows the commutation process at each time period which occurs.
The application of a computer simulation of dynamic behavior of a power transformer in the software program MATLAB-SIMULINK at transient processes, the validity of a given theoretical model in extreme regimes such as load changes.
References Calculation of Overvoltage and Estimation of Power Transformer’s Behavior When Activating the Reactors
- B. Mitraković, “Transformatori”, Beograd, 1985.
- S. Bjelic, Z. Bogićevic, “Computer Simulation of Theoretical Model of Electromagnetic Transient Processes in Power Transformers”, International Journal of Information Technology and Computer Science (IJITCS), volume 6, no. 1,pp.1-12, 2014-01-01.
- S. Bjelic, N. Jelic, “Automatic Secondary VAR Control: A Multivariable Approach”, 1995 01/01, German National Library of Science and Technology (GetInfo) BL CP.
- Z. Bogićević, S. Bjelić, “Higher harmonics as effect of nonlinear pre-connecting baffler at light sources”, 2007.telfor.rs,Viši harmonici kao posledica nelinear-nosti predspojnih prigušnica kod svetlosnih izvora Cite,
- MATLAB SIMULINK Sim Power System, Copyright 1984-2002 The Math Works, Version 6.5.0,180913a, June 2, 2000.
- T. Lakshmi Priyanka, K.R.S. Narayanan, T.Jayanthi, S.A.V. Satya Murty, “Simulation and Tuning of PID Controllers using Evolutionary Algorithms”, International Journal of Information Technology and Computer Science`` (IJITCS), volume 4, no. 11, data 2012-10-09.
- S. Bjelic, V. Mladenovic, “Algorithms and possible methods of emergency control electrical network” Konferenzbericht (2008) 9th Symposium on Neural Network Applications in Electrical Engineering, NEUREL 2008 Proceedings , pp. 69.
- S. Bjelić, Z. Bogićević, N. Marković, “Determination of optimal power value on the exit part of stabilizator in electrical network for public enlightening”, 2007.telfor.org.rs, Cite
- N.Markovic, S. Bjelic, Z. Bogicevic, “Graphical zero-sequence cut-offs method of determining of fault to earth in electrical lines”, View in Scopus | Show abstract, 9th Symposium on Neural Network Applications in Electrical Engineering, NEUREL 2008 Proceedings , pp. 73
- S. Bjelić, N. Marković, U. Jakšić, “The simplified procedure for calculation of influence of thermal losses on decrease of technical endurance of electric equipment”, III Energy efficiency in application of electricity www.society-of thermal engineering of Serbia, IEEP `2011, ISBN 978-86-7877-022-7, COBISS.SR-ID 184481804, 2011, Abs. p. 28.
- S. Bjelic, N. Jelic, “Area automatic control of voltage and reactive power using a multivariable approach”, View in Scopus | Show abstract, Electrical Technology 1995 (2) , pp. 99.
- S. Bjelić, U. Jakšić, N. Marković, “Informatical Model of the System of Automatic Breakdown Control in Energetic Systems”, ELEKTRONIKA IR ELEKTROTECHNIKA, Vol. 1, 2011, p. 87–92.
- N. Marković, S. Bjelić, U. Jakšić, “Proračun uticaja dopunskih gubitaka na smanjenje vremena eksploatacije energetskog transformatora”, Inovacije i razvoj, Bor, br. 1, 2011, p. 75–86.
- S. Bjelic, Z. Bogicevic, N. Kreckovic, N. Markovic, cired.net, “Estimation of curents flow loss of power and voltage fall down in distributive networks by using PDM KMp, q PROGRAM”, 19 International Conference of Electrical Distribution, Paper 0907, Block 4.2, Method and tools, Cired, Wien, 2007.
- S. Bjelić, “Energetski pretvarači u mrežama i instalacijama”, Sven, Niš, 2007, Introduction in middle voltage networks and low voltage instalations, BOOK, ISBN 978-86-83561-15-5, Cobiss SR-ID 14100 0204 SVEN, Nis, 2007.
