Cardiometric assessment of visual stimuli to identify likely reactions to destructive network content

Author: Brodovskaya Elena V., Dombrovskaya Anna Yu., Kravchuk Ivan D., Likhacheva Elvira V., Lukushin Vladimir A., Nikolaeva Lyubov P., Ognev Alexander S., Parma Roman V.
Journal: Cardiometry @cardiometry
Section: Original research
Article in issue: 29, 2023.
Free access
The article presents the experimental confirmation of the hypothesis that with the cardio- and oculometric assessment of various types of visual content, it is possible to conduct a selective analysis of the stimulus material used in projective diagnostics and identify a group of images most suitable for current consultation, and it also shows that there is often an increased interest in content that symbolizes the value of rivalry and risky forms of the behavior, with a high degree of probability, will correlate with the rapid manifestation of the respondent’s dissatisfaction with various kinds of restrictions on his/her behavior.
Projective psychodiagnostics, psychosemantics, cognitive schemes, causal attribution, destructive content
Short address: https://sciup.org/148327843
IDR: 148327843 | DOI: 10.18137/cardiometry.2023.29.4753
Text of the scientific article Cardiometric assessment of visual stimuli to identify likely reactions to destructive network content
Imprint
Elena V. Brodovskaya, Anna Yu. Dombrovskaya, Ivan D. Kravchuk, Elvira V. Likhacheva, Vladimir A. Lukushin, Lyubov P. Nikolaeva, Alexander S. Ognev, Roman V. Parma. Cardiometric assessment of visual stimuli to identify likely reactions to destructive network content. Cardiometry; Issue No. 29; November 2023; p. 47-53; DOI: 10.18137/cardiometry.2023.29.4753; Available from:
Introduction and formulation of the research problem
In psychological research and psychotherapeutic practice, to identify a person’s propensity for one or another variant of perception of visual content, a variety of projective techniques have been intensively applying for more than half a century, among which the most widely used are the so-called interpretation techniques: the Henry Murray Thematic Apperception Test (TAT), developed by Sonya and Leopold Bellak, a series of children’s apperception tests (Children’s Apperception Test; CAT), created by Lyudmila N. Sobchik, a compact modification of the TAT called Drawn Apperception Test (PAT), a modification of a part of the Thematic Apperception Test in the form of the Heckhausen Thematic Apperception Test, HTAT), the Rosenzweig picture frustration test etc. The vast majority of such images were selected by the developers of those methods, based on their subjective preferences, and they were focused on the research tasks, which were of concern to them at that moment. But every testologist, who has a long-term experience with each of these or similar methods, ultimately discovers a noticeable difference in terms of the productivity of the stimulus materials used therein. This difference becomes especially noticeable, when trying to combine operational diagnostics and psychological consulting, in the work with the same client. And all this forces the psychotherapist and consultant to decide for themselves the question of the effectiveness of applying the battery of stimuli used.
When formulating a hypothesis on possible ways to solve this problem, we, first of all, have taken into account the rich experience in cardio- and oculomet-ric assessment of various types of visual content [1, 2, 7-23]. Based thereon, an assumption has been accepted as a working hypothesis that it is possible to conduct a selective analysis of this kind of stimulus material and identify a group of images that are most suitable for operational consultation. When starting to test the hypothesis, we also have proceeded from the assumption that an effective theoretical and methodological basis for this kind of combination can be a subjectogenetic approach to the organization and implementation of various types of psychological practice, the successful application of which has already been repeatedly shown in studies of various types [3-6, 10-14, 20-23].
Experimental procedure
In testing the above hypothesis, when selecting visual stimuli, our preference was given to those types, which, at the stage of their use with an eye tracker, turned out to be the most effective in identifying the characteristics of respondents’ response to such types of visual content that contain some kind of conflict. For this purpose, eight separate protocols for using eye trackers were prepared to cover a total of 138 visual stimuli aimed at identifying those personal attitudes, which either contain destructive content or trigger the respondent to act under the conditions of massive information pressure [2, 7-10, 12 -23]. A total of 654 respondents took part in tests with those stimuli. After processing the evidence data obtained, 20 of the most effective visual stimuli have been identified, some of which are presented in Figures 1-6 herein. In addition to the images shown below, the following stimuli have been employed:
– collections of pictograms included in an open access network content with symbolic designations of various emotional states of a person (stimulus No. 1);
– an image of a person on the edge of a cliff included in open access network content (stimulus No. 2);
– inscription “it is more important to be” placed in the central part of the stimulus, around which in the corners of the visual stimulus given are such options for the proposed continuations of this phrase as: “healthy”, “right”, “lucky”, “happy” (stimulus No. 3);
– figures from Susan Dellinger’s psycho geometric personality test included in open access network content in combination with the inscriptions “this is me” (stimulus No. 4) and “this is not me” (stimulus No. 5);
– photographs of children with pronounced facial reactions included in open access network content, clearly indicating a calm state, an intense manifestation of joy, alertness, despondency, fear and surprise, as well as the inscription “very close to me” (stimulus No. 6);
– a photograph of police officers, standing opposite each other, against definetly aggressive protesters, that is included in open access network content (stimulus No. 7);
– a combination of eight basic colors from the Lus-cher test surrounding the inscription “nice to look at)” (stimulus No. 8).
During further cardiometric assessment of each of those stimuli, the PC-assisted cardiac analyzer Cardiocode was employed. In addition, the galvanic skin responses (GSR) of respondents to each of the stimuli presented above were also recorded. For this purpose, computer recorders of human physiological reactions such as CRIS and Barrier-14 were used. To assess the degree of individual significance of each of the stimuli for the respondents, they were presented in two modes: first, the respondent was asked to choose what suited him/her most from those presented in the image, and then he/she was asked to identify and focus his/her attention on what suited him/her least.
Statistical processing of the obtained data was carried out using the statistical package STADIA 8.0/ huge. With its use, the parameters of descriptive statistics were calculated, and the rank correlation coefficients between all possible pairs of measured values were calculated. Then, a structural classification of such relationships was made by reducing the number of significant variables by factor analysis, applying correlation coefficients calculated according to Spearman. To facilitate the interpretation of the resulting factor structure of relationships, procedures such as orthogonal rotation of factors and their oblique rotation were employed.
126 respondents took part in the final part of the study. With all participants in the experiments, their reactions to each of the images chosen as visual stimuli were discussed individually during a post-test conversation, which was conducted in the form of an indepth interview, described in detail in [6-8, 11-19].
Results and discussions
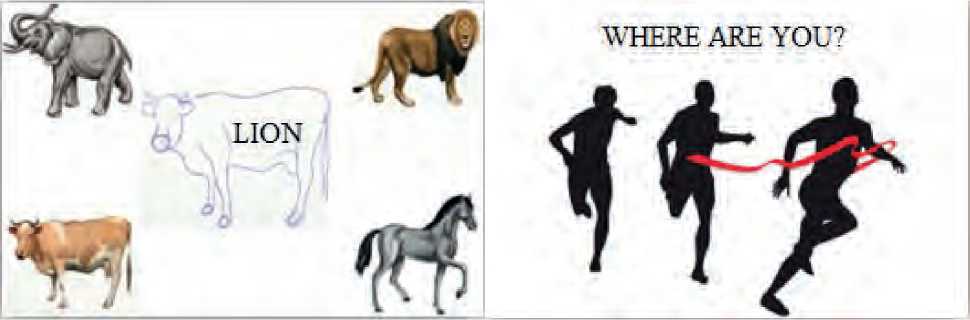
Taking into account the established correlations, the outcomes of test conversations, as well as the results from comparison of the cardiometric data and the parameters of electrodermal activity, high effectiveness in identifying the dominant signaling system of those visual stimuli similar to that shown in Figure 1-A herein has been confirmed. In terms of identifying the level of aspirations, the desire for dominance, leadership, and winning under competitive conditions, the high effectiveness of using stimuli similar to those presented in Figure 1-B herein has been demonstrated.
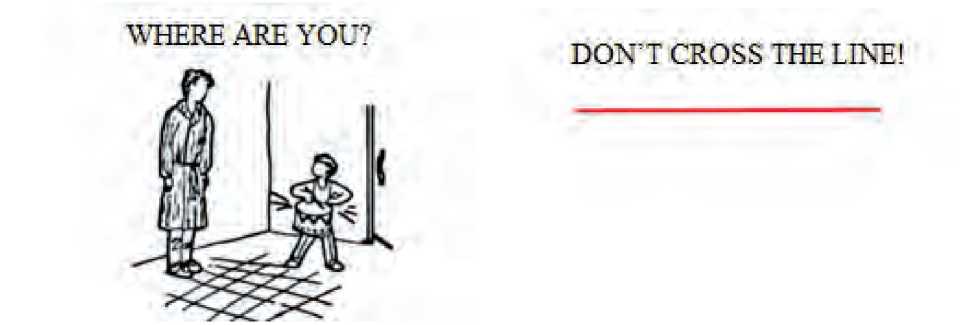
Similarly, it has been established that visual stimuli shown in Figure 2 herein can be successfully used to assess readiness to follow the established norms and act under the conditions of external restrictions.
A B
Figure 1. Examples of visual stimuli found to be the most effective in identifying the predominant signaling system (A) and in assessing the expressiveness of the desire for dominance, leadership, and winning under the competitive conditions (B).
A
B
-
Figure 2. Visual stimuli found to be the most effective for assessing the respondents’ readiness to follow established norms and act successfully under the conditions of external restrictions
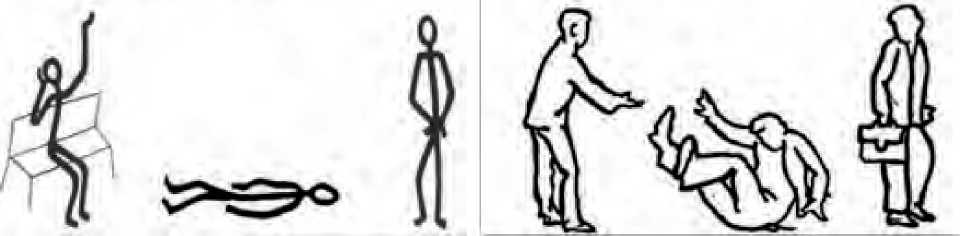
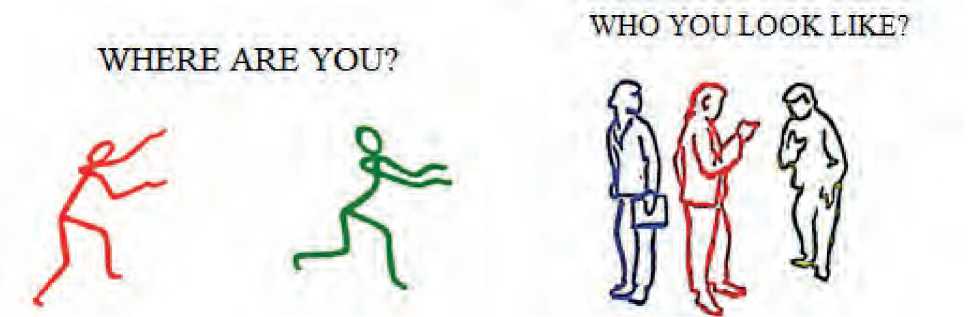
To identify the preferred role positions in potentially problematic situations, satisfactory results were obtained using the visual stimuli shown in Figure 3 herein.
We succeeded in identifying the degree of optimism inherent in each respondent participating in the research regarding their future and the type of preferred scenarios for organizing their work using visual stimuli given in Figure 4 herein.
Taking into account cardiometric data and measurements of electrodermal activity, the same type of physiological reactions was established for such stimuli as No. 2, No. 5, No. 7, as well as 1-B, 2-A and 2-B. The values of the Baevsky stress index (SI) and the area under the line of the galvanic skin response graph, recorded when the respondents operated with that particular group of stimuli, were included in the first factor identified by orthogonal rotation (Table 1, which showed only those values of weighted loads whose modulus amounted at least to 0.5 conventional units). This combination allowed us to conclude that a tendency to protest behavior was most often observed among those respondents, who were also characterized by an increased propensity to take risks, by the activation of the sympathetic system in response to various kinds of restrictions, by their attitude towards active competition and a decreased interest in issues of achieving inner peace of mind.
It also follows from Table 1 that in the formation of the second factor as another integrative latent variable, the greatest role in our case is played by stimuli No. 2, No. 3 and No. 8 (the weighted loads of the SI values are shown as the numerators and the GSR parameters are given as the denominators). This combination indicates that a pronounced desire to achieve mental balance has been observed among the respondents who strive to choose proven patterns of their behavior and actively use visual stimuli that help balance the performance of the sympathetic and parasympathetic systems.
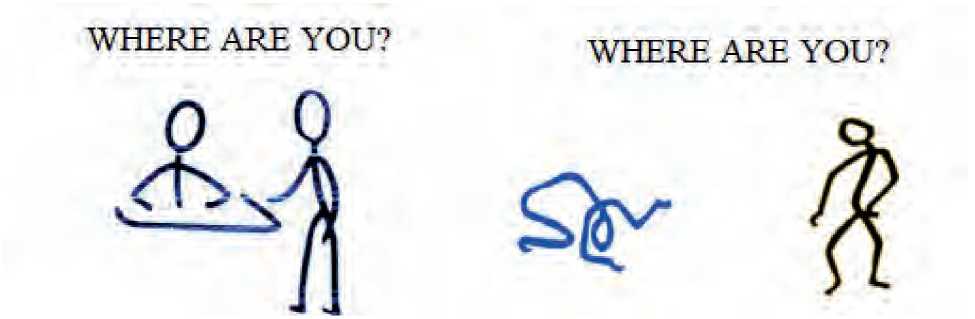
WHERE ARE YOU? WHO YOU LOOK LIKE?
A B
-
Figure 3. Examples of visual stimuli, which can be used to determine the preferred role positions in potentially problematic situations
NO
REALITY without mistakes quickly
A GOOD FUTURE WE MU S T WORK
FANTASY
EFFECTIVELY THOROUGHLY
A B
-
Figure 4. Examples of visual stimuli, which help assess the degree of optimism in the respondent’s ideas regarding his/her future (A) and identify his/her preferred types of scenarios for organizing his/her work (B)
Table 1
Factor structure of correlations after orthogonal rotation
|
Variables |
Factor 1 |
Factor 2 |
Factor 3 |
|
Stimulus No.1 |
- |
- |
- |
|
Stimulus No.2 |
0,722/0,517 |
-0,532/-0,744 |
- |
|
Stimulus No.3 |
-0,533/-0,906 |
0,524/0,905 |
- |
|
Stimulus No.4 |
- |
- |
- |
|
Stimulus No.5 |
0,963/0,728 |
- |
- |
|
Stimulus No.6 |
- |
- |
- |
|
Stimulus No.7 |
0,843/0.533 |
0,839/0,891 |
|
|
Stimulus No.8 |
- |
-0,779/-0,755 |
- |
|
Stimulus 1-А |
- |
- |
- |
|
Stimulus 1-Б |
0,828/0,611 |
- |
- |
|
Stimulus 2-А |
0, 948/0,936 |
- |
- |
|
Stimulus 2-Б |
0,755/0,921 |
- |
- |
|
Stimulus 3-А |
- |
- |
0,678/0,822 |
|
Stimulus 3-Б |
- |
- |
0,627/0,741 |
|
Stimulus 4-А |
- |
- |
0,529/0,673 |
|
Stimulus 4-Б |
- |
- |
0,622/0,674 |
In the third of the identified factors, the values of the measured parameters, when operating with stimuli No. 7, 3-A, 3-B, 4-A and 4-B, has the greatest weight. This suggests that among the respondents for whom there has been an increased tendency to the protest behavior, most often there are those who have combined this tendency with an increased emotional response to someone else’s failure and concern about their future.
During the post-test conversations, as it was previously the case, when using the eye trackers, an effect of a kind of splitting of the semantic interpretation was discovered, according to which different respondents attributed basically different interpretations to the same visual stimuli [2, 7-9, 12, 14, 18, 20 -22]. For example, those respondents, who demonstrated their increased aggressiveness or distrust of everything that was happening, often, when operating with the visual stimulus presented in Figure 3-A, stated that in the center of the picture there was the body of a deceased person. When working with visual stimulus No. 1, that group of the respondents most often chose pictograms that depicted either an apparently exhausted person or someone running somewhere at the limit of their capabilities.
The optimistic respondents most often said that Figure 3-A showed a person peacefully sleeping or resting. When operating with stimulus No. 1, the group of the respondents most often chose pictograms depicting a peaceful conversation or a person calmly reading a book in order to reflect their current state.
The first of the described groups, - especially the respondents demonstrating an increased tendency to aggression, - often believed that in Figure 3-B the person on the left pushed the other person depicted in the center as a falling individual. The second group of the respondents almost unanimously, without having agreed with each other thereon, stated that the same person on the left extended his/her helping hand to the other person shown in the center of the picture.
It is noteworthy that already at the stage of the primary selection of stimuli, when working with the images shown in Figure 5 herein, the first group believed that variant 5-A demonstrated that one person was pursued by another with some malicious intentions. As a rule, the cardiometric data and the GSR measurements in that case were consistent with the dominance of the sympathetic nervous system.
The second group, as a rule, interpreted the same scene as a fun game, some kind of entertainment. The SI values in that case were most often close to those characteristic of the respondents showing a dynamic balance between the sympathetic and parasympathetic systems.
The first group of the respondents almost unambiguously interpreted the scene in Figure 5-B as destructive. The second group most often found the same scene fascinating, with all the depicted persons discussing something very interesting to them. At the same time, many stated that the subject of their discussion was something on the screen of a smartphone, which the person in the middle part of the picture was holding in his/her hand.
There is a clear manifestation of the phenomenon of causal attribution, which consists in attributing certain intentions to those who come into the field of view of a respondent. Moreover, in addition to the conventional division of the causal attribution into external and internal one, in this case it is possible to easily distinguish its constructive and destructive varieties, taking into account the nature of the attributed
A B
-
Figure 5. Examples of visual stimuli that help determine the respondent’s preferred type of causal attribution
A
B
-
Figure 6. Examples of visual stimuli that help determine the respondent’s preferred role dispositions
causes. All this may be applicable to the a priori indicated intentions of the persons depicted, and to a certain context, either to previous or future events that, in the respondent’s opinion, predetermine the entire course of what is happening.
It is also noteworthy that the information about the respondents obtained in this way is in good agreement with the results of their operation with the stimuli, which have been introduced into the test battery to identify their preferred role dispositions (see Figure 6 herein).
In this case, those respondents, who tend to classify the ambiguous scenes as images of a destructive interaction, have often interpreted Figure 6-A as a forced visit of a subordinate to his/her boss in connection with something threatening him with various troubles. Figure 6-B was usually perceived by the said group of the respondents as a scene of remorse, the humiliation of one person and the irreconcilable attitude of another individual towards disapproval. In both cases, as a rule, we recorded such SI values that indicated a strong imbalance in the performance of the sympathetic and parasympathetic systems.
Those, who have shown their tendency to attribute a constructive character to such ambiguous scenes, have usually described Figure 6-A as a friendly conversation, a welcome meeting of the individuals. For them, Figure 6-B is an embodiment of a joint dance, or a demonstration by the left person of some complex exercise, which is admired by another individual on the right side of the Figure. The SI indicators in this case are found most often to be close to those recorded in case of a dynamic balance between the sympathetic and parasympathetic systems.
Conclusion
As a result of the study, the experimental confirmation of the hypothesis has been obtained that with the use of cardio- and oculometric data assessment of various types of visual content, it is possible to conduct a selective analysis of the stimulus material, employed in projective diagnostics, and identify a group of those images, which are most suitable for operational consultation. The visual stimuli presented in this study also have been found to be suitable for identifying likely reactions to destructive online content and the tendency of the respondent as a social network user to attribute the destructive nature to content with a high degree of ambiguity thereof.
The obtained evidence data suggest that it is highly likely that a strong desire for peace of mind will be combined with a reduced tendency to engage in risky behavioral activities and an active desire to fix one’s attention on the content that will facilitate the maintenance of balance between the sympathetic and parasympathetic systems.
The evidence data also suggest that often the respondent’s increased interest in the content that symbolizes the high value of competition and risky behavior for him will be highly likely to correlate with his/her violent expression of dissatisfaction with various kinds of restrictions on his/her behavior. In this case, there is also a high likelihood of an elevated emotional response to someone’s failure and a focus on content that gives hope to the respondent for some clarification of his/her future.
The study was carried out within the framework of State Assignment No.123100300094-1 given by the Ministry of Science and Higher Education of the Russian Federation with the support of the Expert Institute for Social Research
References Cardiometric assessment of visual stimuli to identify likely reactions to destructive network content
- Azarov AA, et al. PREDICTOR MINING: application of data mining methods in social computing problems. Proceedings of SPIIRAN. 2013;3(26):136-61. EDN: QIXKLB [in Russian]
- Brodovskaya EV, et al. Internet communications of Russian political parties in the current electoral cycle: results of oculometric analysis of network content. Political Science.2021;3:112-41. EDN: GTYLYP [in Russian]
- Ognev AS, Likhacheva EV. The practice of introducing positive-oriented subjectogenesis into the higher education system. Psychology. Journal of the Higher School of Economics.2014;11(2):51-67. EDN: TWHXML [in Russian]
- Rosenova MI, et al. Methods for assessing the effectiveness of Sandplay therapy for adults. Modern Foreign Psychology.2022;11(4):61-72. EDN: IACGGP [in Russian]
- Rosenova MI, et al. Stress and fear in extreme situations. Modern Foreign Psychology. 2020;9(1):94-102. EDN: YAXMRI [in Russian]
- Rozenova MI, et al. Fear as a mental health crisis in conditions of global risks and changes. Modern Foreign Psychology. 2021;10(1):17-26. EDN: JMSWTE [in Russian]
- Brodovskaya EV, et al. Cardiometric assessment of the subjective significance of personal strategic goals as components of the image of the desired future. Cardiometry. 2022;24:159-64. EDN: YFZKIS
- Brodovskaya EV, et al. Reverse techniques as a means of increasing the validity of the cardio-oculometric diagnostics. Cardiometry. 2021;18:33-7. EDN: DJTXKL
- Brodovskaya EV, et al. The use of cardiometric and electrodermal activity indicators for the assessment of visual online content. Cardiometry. 2023;26:122-6. EDN: VGXIPQ
- Likhacheva EV, Ognev AS, Kazakov KA. Hardiness and purpose in life of modern Russian students. Middle East Journal of Scientific Research. 2013;14(6):795-8.
- Ognev AS. Cardio-oculometric (cardio-oculographic) detection of functional states in a human individual. Cardiometry. 2019;14:105. EDN: KJSPIZ
- Ognev AS. New possibilities of combining multimodal game modeling and cardiometric detection in instrumental cognitive science. Cardiometry. 2023;28:13-8. EDN: TBNXMP
- Ognev AS, Likhacheva EV. Implementation of Positive Subjectivity Genesis in Higher Education System. Psychology. Journal of the Higher School of Economics. 2014;11(2):51-67. EDN: TWHXML
- Ognev AS, et al. Cardiometric detection of effects and patterns of emotional responses by a human individual to verbal, audial and visual stimuli. Cardiometry. 2019;14:79-86. EDN: OUWRLY
- Ognev AS, et al. Cardiometric taxonomy of stress-indicators potential in diverse domestic situations. Cardiometry. 2019;14:101-4. EDN: LNQTOU
- Ognev AS, et al. Use of cardiometry and oculography in concealed information detection. Cardiometry. 2019;14:87-95. EDN: VUAFMP
- Ognev AS, et al. Validity of cardiometric performance data: an integral part of complex assessment of training session effectiveness. Cardiometry. 2019;14:96-100. EDN: YWMEUX
- Zernov VA, et al. Cardiometric fingerprints of various human ego states. Cardiometry. 2019;15:38-42. EDN: FGZNDX
- Zernov VA, et al. Cardio-oculometric indicator of psychophysiological readiness of students to examinations. Cardiometry. 2020;16:28-34. EDN: USIYPP
- Zernov VA, et al. Cardiometric confirmations of psychotherapeutic effectiveness of psychological sand modeling. Cardiometry. 2021;19:38-42. EDN: BFXJSF
- Zernov VA, et al. Cardiometric evidence data on human self-control of emotional states in the context of the use of metaphoric associative cards. Cardiometry. 2020;16:55-61. EDN: KDHMIH
- Zernov VA, et al. Cardiometric support of visual kinetic modeling. Cardiometry. 2022;23:41-5. EDN: EOLVJT
- Zernov VA, et al. The use of Cardiometry in development self-control skills by means of game sand modeling. Cardiometry. 2022;22:95-9. EDN: QNGXRQ
