Chaotic Behavior of Heart Rate Signals during Chi and Kundalini Meditation

Author: Atefeh Goshvarpour, Ateke Goshvarpour
Journal: International Journal of Image, Graphics and Signal Processing(IJIGSP) @ijigsp
Article in issue: 2 vol.4, 2012.
Free access
Nonlinear dynamics has been introduced to the analysis of biological data and increasingly recognized to be functionally relevant. The aim of this study is to quantify and compare the contribution of nonlinear and chaotic dynamics of human heart rate variability during two forms of meditation: (i) Chinese Chi (or Qigong) meditation and (ii) Kundalini Yoga meditation. For this purpose, Poincare plots, Lyapunov exponents and Hurst exponents of heart rate variability signals were analyzed. In this study, we examined the different behavior of heart rate signals during two specific meditation techniques. The results show that heart rate signals became more periodic and their chaotic behavior was decreased in both techniques of meditation. Therefore, nonlinear chaotic indices may serve as a quantitative measure for psychophysiological states such as meditation. In addition, different forms of meditation appear to differentially alter specific components of heart rate signals.
Heart Rate Variability, Hurst Exponents, Lyapunov Exponents, Meditation, Nonlinear Dynamics;Poincare Plots
Short address: https://sciup.org/15012239
IDR: 15012239
Text of the scientific article Chaotic Behavior of Heart Rate Signals during Chi and Kundalini Meditation
Meditation refers to a family of mental training practices that is designed to familiarize the practitioner with specific types of mental processes [1]. In addition, meditation is essentially a physiological state of demonstrated reduced metabolic activity – different from sleep – that elicits physical and mental relaxation and is reported to enhance psychological balance and emotional stability [2].
There are dozens of specific techniques of meditation practice; the word meditation may carry different meanings in different contexts. Meditation has been practiced since antiquity as a component of numerous religious traditions. Two types of these techniques are Chi and Kundalini meditation.
Qigong or Chi meditation is a practice of aligning breath, movement, and awareness for exercise, healing, and meditation [3]. With roots in Chinese medicine, martial arts, and philosophy, qigong is traditionally viewed as a practice to balance qi (Chi) or what has been translated as "intrinsic life energy." [4] Typically a qigong practice involves rhythmic breathing, coordinated with slow stylized repetition of fluid movement, and a calm mindful state [5].
Kundalini meditation is a physical, mental and spiritual discipline for developing strength, awareness, character, and consciousness. Its purpose is to cultivate the creative spiritual potential of a human to uphold values, speak truth, and focus on the compassion and consciousness needed to serve and heal others [6-7].
Over the past years, a number of studies have explored the physiological correlates of different types of meditation. It is important to note here that meditation refers to a broad variety of practices, ranging from techniques designed to promote relaxation to exercises performed with a more far reaching goal, such as a heightened sense of well-being. This variation, in itself, makes the study of such practices difficult. However, we have tried to find similarities among these practices, and feel that enough prior studies have demonstrated changes associated with these practices that seem worthwhile to continue to explore them. For this purpose, heart rate variability of two specific meditation techniques was studied.
Heart rate (HR) is a nonstationary signal; its variation may contain indicators of psychophysiological states, or warnings about impending cardiac diseases. Heart rate variability is a measure of variations in the HR. It is usually calculated by analyzing the time series of beat to beat intervals from electrocardiogram or arterial pressure tracings [8].
Heart rate variability (HRV) is a reliable reflection of the many physiological factors modulating the normal rhythm of the heart. In fact, it provides a powerful means of observing the interplay between the sympathetic and parasympathetic nervous systems. It shows that the structure generating the signal is not only simply linear, but also involves nonlinear contributions.
Various measures of HRV have been proposed, which can roughly be subdivided into time domain, frequency domain and nonlinear domain measures. Peng et al [9] applied both spectral analysis and a technique based on the Hilbert transform to quantify heart rate dynamics during meditation. Some researchers have shown that low and high frequency components have increased during meditation [10-11]. Others revealed that the high frequency power was increased during meditation [12].
Recently, new dynamic methods of HRV quantification have been used to uncover nonlinear fluctuations in HR, which are not otherwise apparent. Several methods have been proposed: Lyapunov exponents [13], Poincare plots [14], 1/f slope [15], approximate entropy (ApEn) [16] and detrended fluctuation analysis (DFA) [17].
It is now generally recognized that these nonlinear techniques are able to describe the processes generated by biological systems in a more effective way, but a few studies have investigated the nonlinear dynamics of heart rate signals during meditation [14,18-19].
This study aims to evaluate the dynamic behaviors of heart rate signals during, focused on the effects of two different meditation techniques on the nonlinear dynamics of heart rate variability. For this purpose, we performed Lyapunov exponents, Hurst exponents and Poincare plot analysis of heart rate variability signals.
The outline of this study is as follows. In the next section, we briefly describe the heart rate signals applied in our study. Then, the computations of the features (Poincare plots, Lyapunov exponents and Hurst exponents) are explained. Finally, the results of application of the nonlinear features to the heart rate signals on both datasets are presented and the study is concluded.
-
II. Background
A. Data selection
Two specific meditation techniques were studied: (i) Chinese Chi (or Qigong) meditation (as taught by Xin Yan) [9] and (ii) Kundalini Yoga meditation (as taught by Yogi Bhajan) [9].
1) Chi meditation
The Chi meditators [9] were all graduate and postdoctoral students. They were also relative novices in their practice of Chi meditation, most of them having begun their meditation practice about 1–3 months before this study. The subjects were in good general health and did not follow any specific exercise routines.
The eight Chi meditators, 5 women and 3 men (age range 26–35, mean 29 years), wore a Holter recorder for about 10 hours during which time they went about their ordinary daily activities. At approximately 5 hours into the recording each of them practiced one hour of meditation. Meditation beginning and ending times were delineated with event marks.
During these sessions, the Chi meditators sat quietly, listening to the taped guidance of the Master. The meditators were instructed to breathe spontaneously while visualizing the opening and closing of a perfect lotus in the stomach. The meditation session lasted about one hour. The sampling rate was 360 Hz. Analysis was performed offline and meditation beginning and ending times were delineated with event marks.
2) Yoga meditation
The Kundalini Yoga [9] subjects were considered to be at an advanced level of meditation training. The four Kundalini Yoga meditators, 2 women and 2 men (age range 20–52, mean 33 years), wore a Holter monitor for approximately one and a half hours. 15 minutes of baseline quiet breathing was recorded before the 1 hour of meditation.
The meditation protocol consisted of a sequence of breathing and chanting exercises, performed while seated in a cross-legged posture. The beginning and ending of the various meditation sub-phases were delineated with event marks. The sampling rate was 360 Hz.
B. Poincare plot
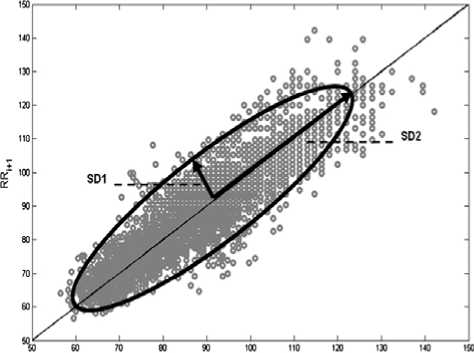
The Poincare plot is a technique taken from nonlinear dynamics and portrays the nature of R wave to R wave interval (RR) interval fluctuations. Poincare plot is a geometrical representation of a time series in a Cartesian plane. A two dimensional plot constructed by plotting consecutive points is a representation of the RR time series on phase space or Cartesian plane [20].
A standard Poincare plot of RR interval is shown in Figure 1. Poincare plot analysis is an emerging quantitative-visual technique, whereby the shape of the plot is categorized into functional classes, which indicate the degree of the heart dynamics. The plot provides summary information as well as detailed beat to beat information on the behavior of the heart [21].
RR,
Figure 1. Standard Poincare plot. A standard Poincare plot (lag-1) of RR intervals [14].
When the signal is steady and unchanging, the phase space plot reduces to a point, but otherwise, the trajectory spreads out to give some patterns on the screen. The pattern that emerges can be interpreted for finer details such as whether the signal is periodic, chaotic, or random, etc.
C.Lyapunov exponents
Consider two (usually the nearest) neighboring points in phase space at time 0 and at a time t, distances of the points in the i th direction being II ^ x i ( 0)1 and IIS x i ( t ))| , respectively. The Lyapunov exponent is then defined by the average growth rate λ i of the initial distance
Ml = 15 X i ( 0 )| =
( t ^ да )
X i = lim1 log2 t ^M t
18xi ( t )
5 X i ( 0 )
An exponential divergence of initially nearby trajectories in phase space coupled with folding of trajectories, ensures that the solutions will remain finite, and is the general mechanism for generating deterministic randomness and unpredictability. Therefore, the existence of a positive λ for almost all initial conditions in a bounded dynamical system is widely used.
To discriminate between chaotic dynamics and periodic signals Lyapunov exponent (λ) is often used. It is a measure of the rate at which the trajectories separate one from other. The trajectories of chaotic signals in phase space follow typical patterns. Closely spaced trajectories converge and diverge exponentially, relative to each other. For dynamical systems, sensitivity to initial conditions is quantified by the Lyapunov exponent (λ). They characterize the average rate of divergence of these neighboring trajectories.
A negative exponent implies that the orbits approach a common fixed point. These systems are non conservative (dissipative). The absolute value of the exponent indicates the degree of stability. A zero exponent means the orbits maintain their relative positions on a stable attractor. Such systems are conservative and in a steady state mode. Finally, a positive exponent implies the orbits are on a chaotic attractor [22-23]. The magnitude of the Lyapunov exponent is a measure of the sensitivity to initial conditions, the primary characteristic of a chaotic system.
D. Hurst exponents
The Hurst exponent is used as a measure of the long term memory of time series. It relates to the autocorrelations of the time series and the rate at which these decrease as the lag between pairs of values increases. Studies involving the Hurst exponent were originally developed in hydrology for the practical matter of determining optimum dam sizing for the Nile River's volatile rain and drought conditions that had been observed over a long period of time [24]. The name "Hurst exponent" or Hurst coefficient derives from Harold Edwin Hurst (1880–1978), who was the lead researcher in these studies, and the use of the standard notation H for the coefficient relates to this name also.
The Hurst exponent is a measure that has been widely used to evaluate the self-similarity and correlation properties of fractional Brownian noise and the time series produced by a fractional (fractal) Gaussian process.
Hurst exponent is used to evaluate the presence or absence of long-range dependence and its degree in a time series. However, local trends (nonstationarities) are often present in physiological data and may compromise the ability of some methods to measure self-similarity. Hurst exponent is the measure of the smoothness of a fractal time series based on the asymptotic behavior of the rescaled range of the process.
The autocorrelation function of a fractal noise {ξi} is related to the Hurst exponent H via the (2): c ( r ) = <^^ + r) да r2H - 2 § 2
Or, equivalently, in the power representation:
-
5 ( f ) = | x ( f )|2 = J 2 c ( r ) e 2 n frdr = -в • c
p = 2 H + 1
1/f corresponds to chaotic behavior, characterized by Fractal properties not by spectrum and it is Euclidean
properties. The harmonics of chaotic signals are fractions of the main frequency of signal. The corresponding spectral density of 1/f is continued and described by power law. It suggests that the process is self similar.
Hurst exponent of 0.5 represents the signal with the characteristics of ordinary random walk or Brownian motion. Values for H < 0.5, reflect the negative correlation between the increments or anti persistent time series, and H > 0.5, show the positive correlation between the increments or persistent natural series. In this study, in order to calculate the Hurst exponents, Kaiser Window is used.
E. Statistical analysis
In this study, the t-test of the null hypothesis that data in the vector x are a random sample from a normal distribution with mean 0 and unknown variance, against the alternative that the mean is not 0 is performed. The result of the test is returned in p-value. P-value→0 indicates a rejection of the null hypothesis at the 5% significance level ( p <0.05). P-value→1 indicates a failure to reject the null hypothesis at the 5% significance level.
-
III. Results
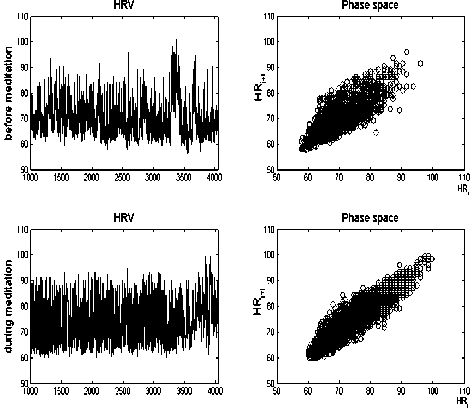
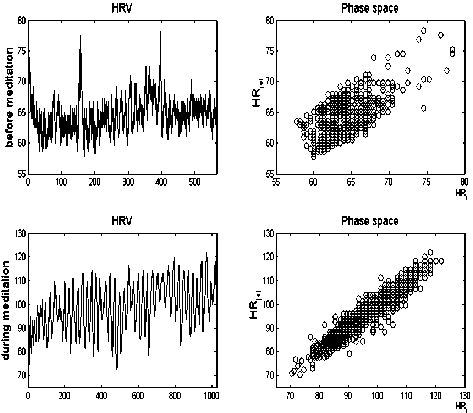
Heart rate signals (before and during meditation) in two meditation practices and their Poincare plots are shown in Figure 2. In these meditation techniques, signals become more periodic and their chaotic behavior was decreased. According to Figure 2, heart rate oscillations amplitude increased and the frequency of it significantly decreased during meditation.
Different meditation techniques had different effects on the mean of heart rate signals. In comparison with before meditation, mean heart rate oscillations were increased during Yoga meditation, but it was significantly decreased during Chi meditation. It suggests that different forms of meditation appear to differentially alter specific components of heart rate variability signals.
before meditation, the trajectories spread out in both meditation techniques (Figure 2). These increments are more significant in Yoga meditation than that of the other meditation technique.
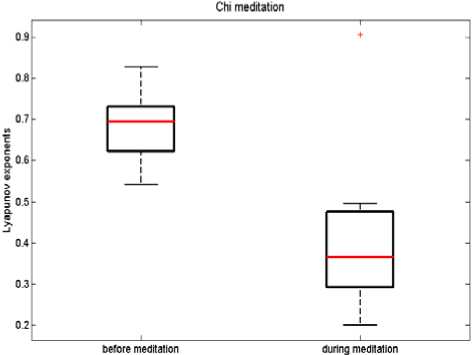
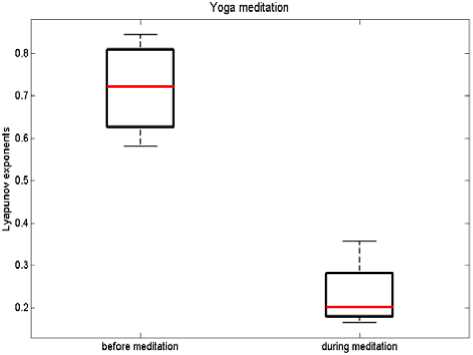
The Lyapunov exponents are computed in HRV signals for each meditation practice (Chinese Chi meditation and Kundalini Yoga meditation). The box plots of estimated Lyapunov exponents are shown in Figures 3. The average values of Lyapunov exponents are summarized in the Table I.
(a)
(b)
Figure 2. Effects of two meditation practices on heart rate signals. The HRV signals are shown on the left planes (top: before meditation and bottom: during meditation), and their respective Poincare plots are shown on the right planes (top: before meditation and bottom: during meditation).
(a) Chi meditation (b) Yoga meditation
Poincare plots (lag-1) of RR intervals (before and during meditation) in two forms of meditation are shown on the right planes of Figure 2. In comparison to
(a)
(b)
Figure 3. Boxplots of Lyapunov exponents of HRV signals in before meditation and meditation conditions.
-
(a) Chi meditation (b) Yoga meditation
According to results, there is a significant decrease in the Lyapunov exponents during two forms of meditation compared to before meditation states ( p <0.05), which shows that the HRV signals are less chaotic during meditation than that of before meditation.
In both groups, the mean values of Lyapunov exponents are about 0.7 before meditation (Figure 3 and Table I). However, during meditation these values are decreased to 0.42 and 0.23 in Chi and Yoga meditation respectively. Furthermore, heart rate time series are chaotic both before and during meditation, as suggested by the positive Lyapunov exponents in either state.
TABLE I. Average lyapunov exponents of hrv in two forms of meditation.
|
Lyapunov exponents |
|||
|
Before meditation |
During meditation |
t-test (p-value) |
|
|
Chi meditation |
0.6827 |
0.4222 |
0.0075 |
|
Yoga meditation |
0.7174 |
0.2309 |
0.0005 |
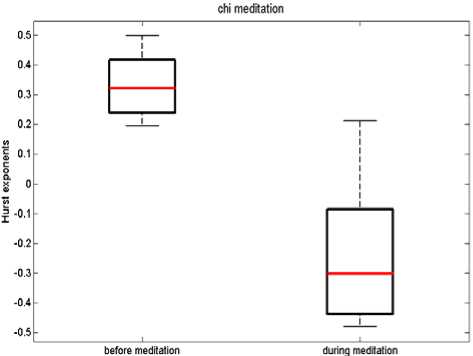
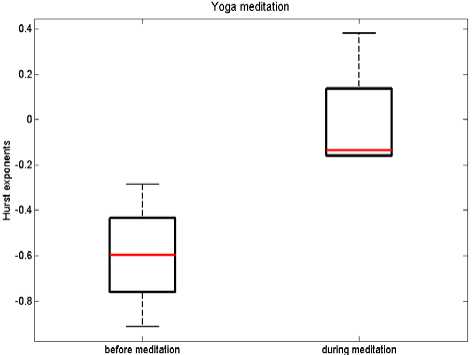
The box plot of Hurst exponents of heart rate variability signals in two meditation techniques is shown in Figures 4.
(a)
(b)
Figure 4. Box plot of Hurst exponents of HRV signals in before meditation and meditation conditions.
-
(a) Chi meditation (b) Yoga meditation
According to Figures 4, different forms of meditation have different Hurst exponents. The Hurst exponents are increased during Yoga meditation, but decreased during Chi meditation. The average values of Hurst exponents of HRV signals in two forms of meditation are summarized in the Table II.
TABLE II. Average hurst exponents of hrv in two forms of meditation.
|
Hurst exponents |
|||
|
Before meditation |
During meditation |
t-test (p-value) |
|
|
Chi meditation |
0.3302 |
-0.2409 |
2.7578e-005 |
|
Yoga meditation |
-0.5973 |
-0.0121 |
0.0186 |
-
IV .Discussion
Heart rate variability analysis has become an important tool in cardiology, because its measurements are noninvasive and easy to perform, have relatively good reproducibility and provide the great information; information was found directly linked to health [9] and prognostic information on patients with heart disease.
Different measures of heart rate signals are designed to reflect different aspects of these signals and thus do not always provide the same information about the cardiovascular system [14, 25-27]. Thus, some measures of heart rate signals may be more attuned to the effects of meditation on the cardiovascular system than others.
The framework of the theory of nonlinear dynamics provides new concepts and powerful algorithms to analyze such time series. The main goal of this study was to investigate the nonlinear dynamics of heart rate signals in the specific psychophysiological state. In this study, the different behavior of heart rate signals before and during two specific meditation techniques are examined (Chi meditation and Kundalini Yoga meditation).
The results show that signals became more periodic and their chaotic behavior was decreased in both techniques of meditation. Furthermore, heart rate oscillation amplitude increased and the frequency of it significantly decreased during meditation (Figure 2). These results were similar to those in previous meditation studies [9, 18-19, 28-29].
According to Figure 2, both forms of meditation had different effects on the mean of heart rate signals. In comparison with before meditation, mean heart rate oscillations were increased during Yoga meditation ( p <0.05), but it was significantly decreased during Chi meditation ( p <0.05).
In a previous study [14], we demonstrated that the comparative dynamic measures of the lagged Poincare plots during meditation give more insight of the heart rate signals in a specific psychophysiological state. The Poincare plot is a quantitative visual tool which can be applied to the analysis of RR interval data gathered over relatively short time periods. In this study, Poincare plots of HRV signals were constructed. The results show that the trajectories spread out during meditation in both meditation techniques (Figure 2). These increments are more significant in Yoga meditation than that of the other meditation technique.
The Lyapunov exponent is a quantitative measure of separation of the divergence of the trajectories from their initial close positions. The magnitude of this exponent indicates the intensity of the chaotic system.
Figure 3 demonstrates that heart rate variability time series are chaotic both before and during meditation, as suggested by the positive Lyapunov exponents in either state.
Furthermore, there is a significant decrease in Lyapunov exponents during two forms of meditation compared to before meditation ( p <0.05) (Figures 3), which states that the heart rate variability signals are less chaotic during meditation than that of before meditation. According to the results, in both groups the mean values of Lyapunov exponents are about 0.7 before meditation (Figure 3 and Table I). However, during meditation these values are decreased to 0.42 and 0.23 in Chi meditation and Yoga meditation respectively. These results were similar to our previous meditation studies [18-19].
In addition, the predictability of heart rate time series is estimated by using the Hurst exponent. The results of the present study demonstrate that the Hurst exponents are decreased during Chinese Chi meditation ( p <0.05), but increased during Yoga meditation ( p <0.05) (Figures 4).
-
V . Conclusion
The results suggest that nonlinear chaotic indices may serve as a quantitative measure for psychophysiological states such as meditation. In addition, different forms of meditation appear to differentially alter specific components of heart rate signals, and they may have their specific benefits to improve health.
Other nonlinear indices of heart rate signals like Fractal dimension can be studied in future. Furthermore, other biological signals like electroencephalogram signals and respiration can be analyzed during different types of meditation.
References Chaotic Behavior of Heart Rate Signals during Chi and Kundalini Meditation
- Brefczynski-Lewis J.A., Lutz A., Schaefer H.S., Levinson D.B., Davidson R.J. (2007). Neural correlates of attentional expertise in long-term meditation practitioners, PNAS, 104, 11483-11488.
- Jevning R., Wallace R.K., Beidebach M. (1992). The physiology of meditation – a review – a wakeful hypometabolic integrated response, Neurosci Biobehav Rev, 16, 415–424.
- Cohen K.S. (1999). The Way of Qigong: The Art and Science of Chinese Energy Healing. Random House of Canada. ISBN 0345421094.
- Yang J.M. (1987). Chi Kung: health & martial arts. Yang's Martial Arts Association. ISBN 0940871009.
- Frantzis B.K. (2008). The Chi Revolution: Harnessing the Healing Power of Your Life Force. Blue Snake Books. ISBN 1583941932.
- Maheshwarananda P.S. The hidden power in humans, Ibera Verlag, 47-48. ISBN 3-85052-197-4.
- Radha S.S. (2004). Kundalini Yoga for the West, timeless, 13-15. ISBN 1932018042.
- Acharya U.R., Joseph K.P., Kannathal N., Lim C.M., Suri J.S. (2006). Heart rate variability: a review. Med Bio Eng Comput, 44, 1031–1051.
- Peng C-K., Mietus J. E., Liu Y., Khalsa G., Douglas P.S., Benson H., Goldberger A.L. (1999). Exaggerated heart rate oscillations during two meditation techniques, Int J Cardiol, 70, 101-107.
- Hoshiyama M., Hoshiyama A. (2008). Heart rate variability associated with experienced Zen meditation, Computers in Cardiology, 35, 569–572.
- Phongsuphap S., Pongsupap Y., Chandanamattha P. (2008). Changes in heart rate variability during concentration meditation, Int J Cardiol, 130, 481–484.
- Takahashi T., Murata T., Hamada T., Omori M., Kosaka H., Kikuchi M., Yoshida H., Wada Y. (2005). Changes in EEG and autonomic nervous activity during meditation and their association with personality traits, Int J Psychophysiol, 55, 199-207.
- Rosenstien M., Colins J.J., De Luca C.J. (1993). A practical method for calculating largest Lyapunov exponents from small data sets, Physica D, 65, 117–134.
- Goshvarpour A., Goshvarpour A., Rahati S. (2011). Analysis of lagged Poincare plots in heart rate signals during meditation, Digital Signal Processing, 21, 208-214.
- Kobayashi M., Musha T. (1982). 1/f fluctuation of heart beat period, IEEE Trans Biomed Eng, 29, 456–457.
- Pincus S.M. (1991). Approximate entropy as a measure of system complexity, Proc Natl Acad Sci USA, 88, 2297–2301.
- Peng C-K., Havlin S., Hausdorf J.M., Mietus J.E., Stanley H.E., Goldberger A.L. (1996). Fractal mechanisms and heart rate dynamics, J Electrocardiol, 28, 59–64.
- Goshvarpour A., Rahati S., Saadatian V. (2010). Estimating depth of meditation using electroencephalogram and heart rate signals, [MSc. Thesis] Department of Biomedical Engineering, Islamic Azad University, Mashhad Branch, Iran. [Persian]
- Goshvarpour A., Rahati S., Saadatian V. (2010). Analysis of electroencephalogram and heart rate signals during meditation using Hopfield neural network, [MSc. Thesis] Department of Biomedical Engineering, Islamic Azad University, Mashhad Branch, Iran. [Persian]
- Karmakar C., Khandoker A., Gubbi J., Palaniswami M. (2009). Complex correlation measure: a novel descriptor for Poincare plot, Biomed Eng, 8, 17.
- Kamen P.W., Krum H., Tonkin A.M., (1996). Poincare plot of heart rate variability allows quantitative display of parasympathetic nervous activity, Clin Sci, 91, 201–208.
- Haykin S., Li X.B. (1995). Detection of signals in chaos, Proc IEEE, 83(1), 95–122.
- Abarbanel H.D.I., Brown R., Kennel M.B. (1991). Lyapunov exponents in chaotic systems: their importance and their evaluation using observed data, Int J Mod Phys B, 5(9),1347–1375.
- Hurst H.E., Black R.P., Simaika Y.M. (1965). Long-term storage: an experimental study Constable, London.
- Storella R.J., Shi Y., O'Connor D.M., Pharo G.H., Abrams J., Levitt T.J. (1999). Relief of chronic pain may be accompanied by an increase in a measure of heart rate variability, IARS, 89, 448-450.
- Vandeput S., Verheyden B., Aubert A.E., Huffel S.V. (2008). Nonlinear heart rate variability in a healthy population: influence of age, Computers in Cardiology, 35, 53-56.
- Xiao D., He W., Yang H., Yu C. (2006). Study on correlative dimension of HRV signals and its clinicalapplications, IEEE- EMBC, 17, 4522-4525.
- Cysarz D. (2005). Cardiorespiratory synchronization during Zen meditation, Eur J Appl Physiol, 95, 88-95.
- Lehrer P., Sasaki Y., Saito Y. (1991). Zazen and cardiac variability, Psychosom Med, 61, 812-821.
