Classification and regression trees (CART) for predictive modeling in blended learning
 for predictive modeling in blended learning")
Author: Nick Z. Zacharis
Journal: International Journal of Intelligent Systems and Applications @ijisa
Article in issue: 3 vol.10, 2018.
Free access
Today, Internet and Web technologies not only provide students opportunities for flexible interactivity with study materials, peers and instructors, but also generate large amounts of usage data that can be processed and reveal behavioral patterns of study and learning. This study analyzed data extracted from a Moodle-based blended learning course, to build a student model that predicts course performance. CART decision tree algorithm was used to classify students and predict those at risk, based on the impact of four online activities: message exchanging, group wiki content creation, course files opening and online quiz taking. The overall percentage of correct classifications was about 99.1%, proving the model sensitive to identify very specific groups at risk.
Education Data Mining, Student Data, Blended learning, Decision Trees, CART algorithm, Moodle
Short address: https://sciup.org/15016466
IDR: 15016466 | DOI: 10.5815/ijisa.2018.03.01
Text of the scientific article Classification and regression trees (CART) for predictive modeling in blended learning
Published Online March 2018 in MECS
Student academic achievement is always a matter of great concern to education stakeholders, especially in today’s fast-paced, web-enabled classrooms. High quality teaching stuff, well-designed curriculum, studentcentered learning and academic support are heavily impact on student success and help to equalize education background differences [1]. Although academic success is an outcome influenced by many factors, research has shown that students’ engagement with educationally purposeful activities lowers failure rates in introductory college courses and increases retention. The time and effort that students devote to activities linked to desired learning outcomes, such as active and collaborative learning, communication with academic staff and peers, and involvement in enriching educational experiences, has great impact on academic performance [2].
As virtual learning platforms have become the primary means for delivering learning materials for both online and traditional modes of education, instructors have the chance to program online experiences and monitor students’ activities. The large amount of data that is stored in the log files of these systems can be used to trace student online activities, such as reading files, taking tests, collaborating with peers, communicating with stuff etc [3]. The need to improve the quality of learning has led many institutions to embrace innovative practices like blended learning and use data mining techniques to identify patterns of behaviors and design interventions. Educational data mining provides instructors the tools to filter out information and create models of students’ performance that predict success [4].
This study used data mining classification algorithm CART in order to analyze student activity data and predict academic performance. The aim was to create a predictive model that will classify students into pass/fail categories and use this information for early identification of struggling students. A blended learning course on Java programming, designed to engage students in numerous interactions through a Moodle learning management system (LMS), gave students the opportunity to communicate and collaborate in teams, use the lecture materials, create and share their own artifacts and knowledge, and test online their comprehension. Classification and Regression Tree (CART) algorithm was utilized to classify data because it’s easy to interpret and present, requires little effort for data preparation and doesn’t get affected by the nonlinearity between variables in the dataset.
The rest of the paper is organized as follows: Section II reviews published information that relates to the study at hand. The next section III defines blended learning and describes its implementation through a LMS features. The following section IV outlines education data mining aims and techniques. Section V summarizes the methodology that was used to collect and prepare the data for analysis, and gives a thorough explanation of the CART algorithm that was used to classify the dataset. The following section VI presents the results of the analysis and the last section VII states the conclusions of the research.
-
II. R elated W ork
Predicting student performances, in order to take actions and prevent failure or dropout, is a matter of intense research in the educational data mining area. Grade Point Average (GPA) or grades across assignments, class quizzes and tests, lab work and attendance, as well as students’ demographic, such as gender, age and family background, and students personal behaviors, i.e. beliefs, motivations and learning strategies, are attributes that have been frequently used by researchers in predicting student performance [5].
Baradwaj and Pal [6] used grades from previous semester and two class tests, seminar performance, lab work and attendance to classify and predict students' performance in end-semester examination. Data from 50 students taking a Master of Computer Applications course collected and analyzed using ID3 decision tree learning algorithm. Adhatrao et al. [7], applied the ID3 (Iterative Dichotomiser 3) and C4.5 classification algorithms to analyze the data of students enrolled in first year of engineering. Gender, admission type and scores in entrance examinations used after dataset pruning to predict the results of students in their first semester with accuracy about 78%. Jiang et al. [8] used logistic regression as a classifier to predict the probability of students successfully completing a Massive Open Online Course (MOOC), as well as the type of certificate (i.e. distinction and normal). Four types of data, obtained in the first week of the course, were used as predictors: average score from four quizzes, the number of peer assessments students completed, the learners’ social network degree (i.e. the local centrality of learners in the online learning community) and intention to major without having declare it. The model predicting the type of certificate achieved accuracy 92% while the second model predicting the probability of earning a normal degree certificate achieved 80% accuracy.
Students’ cognitive activities and emotions impact on effective and meaningful learning and have been used in research as predictors of student performance. Wang et al. [9] investigated what emotions do students experience when they use different computer-based environments and how these emotions influence learning and performance. Cognitive states (i.e. concentration, anxiety, and boredom), prior knowledge from other courses (clustered as high or low), type of computer-based learning were the independent variables of the study. A self-report inventory questionnaire was used to measure the students’ cognitive-affective states while IBM SPSS statistical software was employed for the data analysis. A univariate cluster analysis classified students into two classes and a discriminant function analysis validated the clusters. Liyanage et al. [10] tried to predict student learning style in order to create individual profiles and recommend learning materials. 80 students completed the ILS questionnaire and these Moodle LMS data were analyzed with Weka, using J48, Bayesian network, naiveBayes, and random forest data mining algorithms. The decision tree J48 algorithm outperformed the others in all four dimensions of the learning style model.
Kabakchieva [11] used various data mining techniques to extract insightful information, from 10330 student records, described by parameters such as gender, age, living place and type of previous education, admission exam score. Weka software used to cross-validate and test the classifiers. The decision tree classifier (J48) and the rule learner (JRip) were the most accurate for all classes, while the k-Nearest Neighbor algorithm (k-NN)
and the Bayes classifiers were less accurate. Bogarin [12] gathered data from 84 undergraduate students of an online course on Moodle, in order to create accurate models of students’ behavior. Total times spent viewing resources or attempting quizzes or participating in forums, delay times between a new recourse, quiz or task being available and being viewed, as well as numbers of words and sentences written in forum posts, were the attributes obtained from the log file. The Expectation-Minimization (EM) Weka algorithm, which doesn’t require user to define a priori the number of clusters, was used to group students of similar behavior and draw useful conclusions by comparing their exam marks.
Zacharis [13] used data from a Moodle-hosted blended learning course to explore online activities that could be used to predict academic performance. The log file, containing the interactions of 134 students with the course material, mates and stuff, was processed to reveal predictors of success, such as the time spent in various activities or total LMS hits. Fourteen features were found to have significant correlation with student grades and used as the independent variables in a stepwise multivariate regression. The most predictive variables in student outcomes were the number of messages sent or viewed, the number of quiz efforts made, the number of files viewed and the number of contributions in different team tasks. To evaluate the predictive power of the regression model consisting of these four variables, a binary logistic analysis was performed that achieved a prediction accuracy of 81%. The same author [14], used the same four variables in another blended learning course with 265 students, to exam if a Multi-Layer Perceptron Neural Network could be trained to accurate predict student performance. The neural network model provided a correct classification rate of 98.3%.
-
III. B lended L earning T hrough Α LMS
Blended learning is generally defined as the integration of the best features of both face-to-face and onlinedistance learning in the learning process [13]. Traditional classroom methods are combined with rich multimedia content and Internet access, creating a hybrid teaching methodology that supports and engages in learning interactions anytime, anywhere. Learning management systems, like Moodle or Blackboard, are used today by educational institutions to facilitate all aspects of learning: creation and shearing of educational content, collaboration and communication, class monitoring and administration [15]. Incorporated html editors and webpublishing tools provide instructors the means to prepare notes and assignments, record and upload lecture videos, post hints and useful url links, create presentations and online quizzes, organize project teams and communicate with each student that needs their help.
In blended learning courses, students use the online materials to organize their own path of learning and study ahead of time, while instructors use the classroom time for problem-solving explorations and hands-on activities. The role of instructor has shifted from that of a knowledge provider to that of a guide helping students in setting learning goals, organize their study and self-direct their learning towards content mastery [14], [15]. There is a variety of ways to approach blended learning, and thus, a lot of flexibility to prioritize the physical or the online elements according to different learning styles and knowledge backgrounds. By combining different tools of a learning management system, instructors can effectively blend and facilitate all forms of learning, such as selfdirected learning, collaborative learning, problem-based learning, and so on, with varying degrees of instructor interventions.
Drawing upon information from online activities such as students’ collaboration and content creation, instructors can early indentify problematic behaviors and design focused interventions. Clear instructions and greater understanding of concepts can be provided using either the classroom instruction hours or the online teaching functionalities, while both teaching modalities can be used to support, engage and motivate effectively both struggling and highly capable students [1], [13]. As research has shown [16], [17], [18], students in blended learning courses are satisfied and motivated by the convenience, independence, and personalization that online learning provides, and feel more confident about their ability to pass course compared to their peers who either took an all-online course or a traditional learning course. As institutions increasingly introduce mainstream blended-learning options, data mining methods would become a powerful aid to analyze the increased amount of student achievement data and shorten the time needed to diagnose students’ weakness and needs.
-
IV. E ducational D ata M ining
With the continuous growth of e-learning materials in education, data mining techniques are increasingly being applied in education for developing models to predict students’ behaviors and performance [19]. Driven by the need to extract useful information from large datasets and identify hidden patterns and trends, data mining – also called Knowledge Discovery in Databases (KDD) –, uses various statistical and machine learning techniques to analyze data and facilitate decision making [20], [21]. Following this line of thinking, the Educational Data Mining community website, educationaldatamining.org, defines educational data mining as follows: “Educational Data Mining is an emerging discipline, concerned with developing methods for exploring the unique types of data that come from educational settings, and using those methods to better understand students, and the settings which they learn in.” Classification, clustering, association rule mining, regression and discovery with models, are the routine data mining methods adopted by most of the researchers to analyze the gathered data, while student learning behavior modeling, prediction of performance, prediction of dropout and retention, identification of struggling students, are the main goals of data mining in educational environments [22].
-
A. Student modeling
Student modeling is a key concept in educational data mining that refers to a qualitative representation of students’ behavior, which in turn can be used in making instructional decisions [23]. Models may represent content knowledge, problem solving skills, learning styles, student emotions and attitudes, experience or selfconfidence, errors and misconceptions, results of actions or intermediate results [23], [24]. In a blended learning environment, raw data from carefully selected online student interactions are first switched to meaningful human activities and then feed a predictive model. Different combinations of metrics, such as IP addresses, content page views, number of quizzes taken, time on task, average session length, messages exchanged/view/ commented and content creation contributions, can be used to study the impact of communication, content creation, collaboration, and self-evaluation in the success of a blended learning course [13].
-
B. Data wearhousing
The data mining process workflow contains many phases such as data collection, data preprocessing and data mining processing [25]. Data Collection – the process of gathering large amounts of data – is important because good choice of the attributes will address the concept problem [26]. When mining objectives and requirements have been specified, some data could be removed or new computed attributes could be added to ensure meaningful data mining results. This feature extraction very often requires the transformation of data encoded in different or complex database formats, into formats more suitable for the mining algorithms used for the data analysis. Data preprocessing also involves the data cleaning phase, where errors are checked and corrected, null or missing values are appropriately handled, and data extracted from different sources are integrated into a single multidimensional format for processing [27]. Finally, during the data mining processing phase, the exact features from the structured data set are analyzed by means of mathematical algorithms, which have been selected based on the type of data and the relationships and trends the model aims to capture [28].
-
C. Basic data mining methods
Data mining uses several algorithms to find, in short, four classes of relationships among data: classes, clusters, associations and sequential patterns. The choice of the algorithm to be used depends on factors such as the performance that can be achieved in the specific application domain, the level of results accuracy or the comprehensibility of the model. Classification and clustering are perhaps the most frequently mining tasks for performing mining on large data sets [29].
Classification is a supervised learning process, meaning that the algorithm learns from provided examples and creates a model that maps new, unseen instances in predefined classes. Prior knowledge is incorporated into each example as a pair of an input vector of data attributes/characteristics and a value/label indicating the class this example belongs to. Nearest Neighbors, Decision Trees, Rule-based Classifiers, Artificial Neural Networks, Support Vector Machines and Naive Bayes Algorithm are the base classifiers used to classify new unseen data.
Clustering in contrast is an unsupervised learning process which assigns data records to clusters that already contain items that are more similar to the new coming record comparing to the items contained in the other clusters. Similarity among items is measured by distance functions, such as Euclidean or cosine distance, and determines the quality of the clustering: high quality clusters have high intra-cluster similarity and low intercluster similarity. Hierarchical clustering, K–means clustering and Density-based Clustering are the main clustering approaches used in research.
-
V. M ethodology
The aim of this research was to determine the efficiency of the decision tree CART algorithm to predict student performance based on the online activity that is stored in the Moodle LMS log file. Moodle logs include actions made by the instructor, such as grading a student or uploading a lecture related file, and events related to students’ actions, such as posting to class blog or submitting an assignment. The instructor can choose to display the logs on screen (Fig. 1) or download them in text, OpenDocument Spreadsheet (.ods) or Excel format. The data used in the research, was obtained from a fullsemester, blended learning course on object oriented programming, focusing on team problem solving activities. The online interactions of 352 undergraduate students were extracted from the system's log file into an Excel table and several VBA macros used in the preprocessing phase to calculate the numbers of files viewed, of content contributions, of efforts to complete quizzes and of messages exchanged, for each individual student. After data preprocessing, the excel file including the four aforementioned attributes and the student IDs was merged with another excel file containing student IDs and corresponding course grades (Fig. 2.). Student activities statistics are given in Table 1.
Introduction to Java programming ноте AEinsipoiOTT ■ 7)/|pa 1Лтх<л1юлнкапро/ихЛг¥паАоу1ат1гь*г £иог|ратслТ£ eiessot Resorts togs

|
Course iiroouSKmo .as Drograirnng |
Sj^am |
Course viewed |
me user we и 736 viewed re course wir и "13" |
web |
77.48.141.131 |
||
|
04:49 |
Course I'ltroouctioi )ь .эя srograirnhg |
System |
Course viewed |
me user wbi и 733 viewed re course wbi и "13" |
w® |
91 13218851 |
|
|
04:43 |
Course iiroouSKmo .as Drograirnng |
Sjstam |
Course viewed |
me user wn и 729 viewed re course wir и "13" |
web |
79 13079 14 |
|
|
04:43 |
Course I'ltroouctioi )ь .эя srograirnhg |
System |
Course viewed |
me user wir и 729 viewed re course wir и "13" |
■web |
79 1307914 |
|
|
04:46 |
Course iiroouSKmo .as Drograirnng |
Sjstam |
Course viewed |
me user wir и 729 viewed re course wir и "13" |
web |
79 1307914 |
|
|
04:42 |
Course I'ltroouctioi )ь .эя srograirnhg |
System |
Course viewed |
me user wir и 729 viewed re course wir и "13" |
web |
79 1307914 |
|
|
04:42 |
Course iiroouSKmo .as Drograirnng |
Sjstam |
Course viewed |
me user wn и 744 viewed re course wn и 13 |
web |
77.49183.1 |
|
|
2202 |
Course I'ltroouctioi )ь .эя srograirnhg |
System |
Course viewed |
me user wir и 744 viewed re course wir и "IS". |
web |
77 491831 |
|
|
2024 |
Course iiroouSKmo .as Drograirnng |
Sjstam |
Course viewed |
me user wn и 743 viewed re course wbi и 13 |
web |
91 140 48 68 |
|
|
1731 |
•*^c |
Course I'ltroouctioi )ь .эя srograirnhg |
System |
Course viewed |
me user wir и 733 viewed re course wir и "13" |
web |
91 13218851 |
Fig.1. Moodle student activity log file
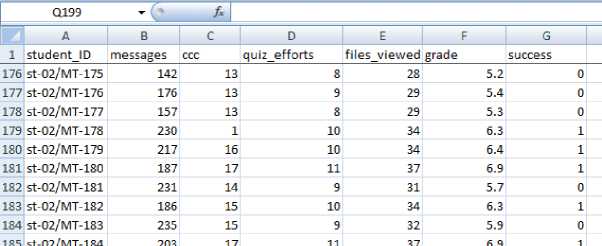
Fig.2. Combined Excel file ready for analysis
Table 1. Descriptive statistics
|
N |
Range |
Minimum |
Maximum |
Mean |
Std. Deviation |
Variance |
Skewness |
Kurtosis |
|||||
|
Statistic |
Statistic |
Statistic |
Statistic |
Statistic |
Std. Error |
Statistic |
Statistic |
Statistic |
Std. |
Error |
Statistic |
Std. Error |
|
|
messages |
352 |
181 |
86 |
267 |
184.86 |
2.097 |
39.334 |
1547.189 |
-.107 |
.130 |
-.289 |
.259 |
|
|
ccc |
352 |
17 |
1 |
18 |
12.70 |
.258 |
4.844 |
23.466 |
-1.202 |
.130 |
.080 |
.259 |
|
|
quiz_efforts |
352 |
9 |
2 |
11 |
9.28 |
.087 |
1.631 |
2.660 |
-1.416 |
.130 |
2.889 |
.259 |
|
|
files_viewed |
352 |
41 |
11 |
52 |
34.13 |
.395 |
7.405 |
54.839 |
-.244 |
.130 |
2.027 |
.259 |
|
|
grade Valid N (listwise) |
352 352 |
6.7 |
3.3 |
10.0 |
5.991 |
.0502 |
.9418 |
.887 |
-.464 |
.130 |
1.991 |
.259 |
|
-
A. Decision Trees techniques
A decision tree is a hierarchical structure that depicts the classification of a dataset into groups. As in any classification problem, the goal here is to build a model that predicts the values of a variable given the values of other variables. Decision trees follow a supervised learning approach, training a model based on a sample of known observations as input and known responses as outputs. The tree structure results from the recursive splitting of the root node, which contains all training dataset, according to simple rules of the type xi ≤ d , where xi is the value of an independent variable (or attribute) and d is a real number. In each step of the top-down greedy search, a variable is selected to separate the data of the node, based on the information gain criterion, i.e. how homogeneous (pure) would be the data included in the child nodes. The splitting continues until a leaf node (or end node) is reached, in which predetermined purity or stopping rules have been met. These stopping criteria can be tight or loose, creating small and under-fitted or large and over-fitted trees. Several pruning methods have been invented to allow trees to over-fit the training dataset and then reduce their size, removing sub-trees that increase complexity and reduce generalization accuracy [30].
Given a training dataset {( xi , yi ): i = 1, 2, … , n } ‒ where xi is the k -dimensional input vector ( x1 , x2 , … , xk ) of the independent variables, y i is the class output taking values in {1, 2, … , m } and n is the number of observations ‒ different algorithms can be used to split the data records in subsets based on the association of each input variable x j ( j = 1, 2, … , k ) with y i . The ID3 (or Iterative Dichotomiser 3) is a very simple algorithm that uses Shannon Entropy function to grow a multiway decision tree, as long as the information gain is greater than zero [31]. It applies only to categorical data and creates complex trees that tend to over-fit training data [30], [32]. C4.5 algorithm is the evolution of ID3 and applies to both categorical and numerical attributes. It also uses Shannon Entropy to choose the attribute that maximizes the information gain, but, moreover, uses bottom-up pruning and handles missing data [31], [32]. CART (Classification and Regression Trees) algorithm is similar to C4.5, but constructs only binary trees and uses Gini Impurity to select the best attribute for splitting the dataset [33]. Besides from handing both categorical and continuous attributes, CART can also create regression trees and predict not only the class but the absolute value of the dependent variable.
Decision tree is a non-parametric method, assuming no predefined data probability distribution or variables relationships. Recursive partitioning is very efficient in classifying both categorical and numerical variables and the output is easily interpreted information in form of rules - each path connecting the root of the tree with a leaf node is a rule. Large trees are more convoluted, so pre- and post-pruning methods are applied to reduce tree size. Decision trees are fast and robust algorithms that can provide information about the predictive importance of the attributes - the closer the attribute is to the root, the more important it tends to be. They are able to handle well missing attribute values and outliers which can ruin a model since they are used to limit a class. Since the aim of the present study was to predict student success or failure in blended learning courses, CART algorithm was used to create a predictive model of student performance, based on four student online activities: number of messages viewed/posted, number of content creation contributions in group wiki, number of files viewed and number of quiz efforts taken by the student.
-
B. CART algorithm
CART can be used to build both Classification and Regression Decision Trees. When a decision tree is used to separate a dataset into two classes, the model is a classification tree but, when the target variable is numeric or continuous, the predictive task is regression. When a classification tree is used, the aim is to split the dataset at hand into two parts using the homogeneity of data as criterion. In order to decide which attribute to split and where to split, CART is based on impurity measures such as entropy or Gini index. In regression trees, the output attribute doesn’t have classes and the goal here is not to predict the class a record belongs to, but to predict the value of the output variable. Each attribute in the dataset is split in different points, the error between actual value and the predicted value is calculated and the split point that gives the lowest sum of squared errors is chosen as the root node, which in turn splits in two in a recursive process. The skeleton of a recursive tree growing process is shown in Figure 3.
Stopping criteria are rules controlling when the process of tree growing stops. These rules are: a node will not be split if (a) it has records with the same value of the target variable (pure node), (b) its size is under a user-defined value, (c) the tree depth reaches a predefined maximum value, (d) contains less than a predefined minimum number of cases, (e) the split cannot improve purity above a limit.
Tree growing algorithm growingtree(X, A, y)
Input Training datasetX, attribute set A, output variable у Output Decision tree
-
1 Begin a single tree T with a root node
-
2 If all stopping criteria have been met then
-
3 | Thas one node with the most common class inXas label
-
4 else
-
5 find a eA, that best splitsX using impurity function
-
6 Label node with о
-
7 for possible value v of о do
-
8 X= the subset of /that have v = a
-
9 A = attribute set A - the best split attribute a
-
10 growingtree (X, A, y)
-
11 connect the new node to the root node with label v
-
12 return pruningtree(X, A, y)
Fig.3. Tree growing algorithm pseudocode
Since it is difficult to predict the right threshold levels without a thorough assessment and understanding of data, CART uses a pruning strategy to reach the optimal tree. The tree is first allowed to grow up and then pruned back to the right size by the pruning algorithm. Stopping tree growing too soon, can lead to loss of important, full of information, subtrees. Allowing a tree to grow with no stopping rules or pruning, leads to a predictive model that over-fits the data at hand and cannot repeat this “good fit” when is applied to a different sample. CART uses the minimal cost-complexity measure [33] for pruning. Each subtree is assigned a cost C a ( T ) = R ( T ) + aL ( T ), where R ( T ) is the ratio of training data misclassified by tree T (also called the resubstitution error), L ( T ) is the number of leaves in tree T and a > 0 , is a penalty per node factor called the complexity parameter. The aim of costcomplexity pruning is not to check all possible subtrees, but only those that minimize C a ( T ). If we denote with T k , t the branch of Tk stemming from node t , R ( t ) the resubstitution error at node t from the training dataset, and with gk ( t ) the value of a at which Tk - Tt becomes more cost-effective that T , a skeleton for the pruning algorithm is showed in Figure 4.
Tree pruning algorithm pruningtree(X,A, y)
Input Training datasetX, attribute set A, output variable у Output The pruned tree
In order to split the data, CART uses the Gini index of node impurity. At node t the Gini index is defined as
Gini ( t ) = 1 - T f j- f j = 0 1 n ( t ) )
where j is a class of target variable (in this study j = 0 means failure and j = 1 denotes success), n ( j | t ) is the number of records of node t belonging to class j , and n ( t ) is the total record number in node t . When the data in a node are equally distributed between all classes, the Gini index attains its maximum impurity value 0.5. In the case where all data belong to the same class, the node has minimum impurity and Gini index is 0. In order to decide which attribute to split upon, the tree growing algorithm calculates the weighted average of the Gini index for the descended nodes
Gini(tT„= n(tL) Gini(t ) + n(tR) Gini(tR) split n(t) L n(t) R where t and t are the left and right child nodes of node t . The attribute that minimizes the Gini(t) is chosen to split the node.
-
VI. R esults
SPSS 21 decision tree software was used to apply CART analysis to the student data. In order to predict a categorical variable, SPSS CART implementation, by default, utilizes the Gini index. The input fields (predictors) were the numbers of messages exchanged, collaborative contributions made, files viewed and quizzes taken, while the student failure or success was the target variable. The split-sample validation (70% - 30%) technique was used for model evaluation. The minimum subgroup size was set to be 15, approximately 4% of the entire sample. Model summary is shown in Figure 5, while the induced decision tree is shown in Figure 6.
Model Summary
|
Specifications Growing Method Dependent Variable Independent Variables Validation Maximum Tree Depth Minimum Cases in Parent Node Minimum Cases in Child Node Results Independent variables Included Number of No des Number of Terminal Nodes Depth |
CRT success messages, ccc, quiz_efforts, files_viewed Split Sample 5 21 15 messages, quiz_efforts, ccc, files_viewed 5 2 |
Fig.5. SPSS output, Model Summary.
As can be seen in Table 2, the CART model correctly classified 167 students who were failed the course, but misclassified 3 others who did not pass the class (it correctly classified 98.2% of cases). The model also correctly classified 182 students who were not failed (it correctly classified 100.0% of cases). The overall accuracy of classification is, therefore, the weighted average of these two values (99.1%).
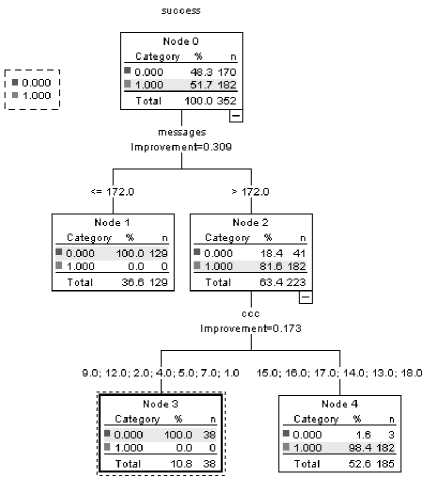
Fig.6. SPSS output, Decision Tree.
Table 2. Classification Results.
Classification
|
Observed |
Predicted |
||
|
0 |
1 |
Percent Correct |
|
|
0 |
167 |
3 |
98.2% |
|
1 |
0 |
182 |
100.0% |
|
Overall Percentage |
47.4% |
52.6% |
99.1 % |
Growing Method: CRT
Dependent Variable: success
Table 3. Predictors’ Importance.
Independent Variable Importance
|
Independent Variable |
Importance |
Normalized Importance |
|
messages ccc quiz_efforts files_viewed |
.309 .256 .120 .082 |
100.0% 82.8% 38.7% 26.5% |
Growing Method: CRT
Dependent Variable: success
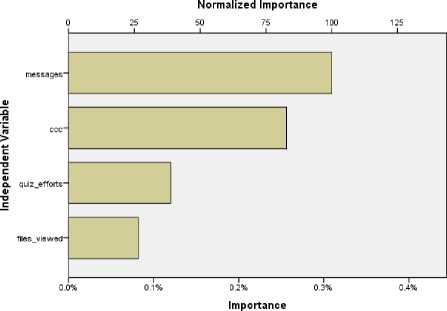
The number of messages exchanged by team members with their colleagues and instructors, as well as the number of contributions made by each individual to the team content creation activities, were the most important predictors of student success (Table 3). Figure 7 depicts a graph of the normalized importance of each of the predictor variables.
Two important rules have emerged from the tree analysis: (a) IF messages exchanged ≤ 172 THEN student fails, and (b) IF messages exchanged > 172 AND content creation contributions ≥ 13 THEN student succeeds. Since communication and interaction are important ingredients of successfully implemented blended learning programs, the number of messages exchanged in between the team members and the supervised instructors, and the new pieces of information contributed by each student during the assigned collaborative tasks, were logically expected to heavily impact student success.
Growing Method:CRT
Dependent Variable:success
Fig.7. Normalized Importance of Predictors
-
VII. C onclusion
The aim of this study was to test the ability of CART analysis to predict success in web-based blended learning environments, by using online interactions stored in the system log file. CART is nonparametric and thus, is suitable for data belonging in various distributions. The effect of outliers in the input variables is insignificant, and the pruning method it applies ensures that no important substructure is overlooked. In this study, the CART technique achieved very high accuracy (99.1 %) in classifying students into those who successfully passed the class and those who failed to do so. The number of text messages that a student sent to teammates and instructors was the most valuable predictor of course success. The second most important factor in predicting whether a student will pass or fail the course, was the number of contributions to group wiki-based tasks. Quiz efforts and the number of files viewed had a distinct but relatively modest effect on predicting success. For sure more research needs to be done using this analytic tool in more populous and diverse learning settings, but this research provides strong evidence that the CART method of analysis can effectively use the proposed predictors and forecast student course achievement. Instructors may rely on the prognostic power of CART analysis to design timely interventions and help students succeed.
References Classification and regression trees (CART) for predictive modeling in blended learning
- Hu, S. & Kuh, G. (2002). Being disengaged in educationally purposeful activities: the Influences of student and institutional characteristics. Research in Higher Education, 43(5), 555-575.
- Coates, H. (2006). Student engagement in campus-based and online education: University connections. Abingdon, UK: Routledge.
- Mostow, J. & Beck, J. (2006). Some useful tactics to modify, map and mine data from intelligent tutors. Natural Language Engineering, 12(2), 195-208.
- Siemens, G. (2013). Learning analytics: The emergence of a discipline. American Behavioral Scientist, 57(10), 1380–1400.
- Shahiri, A.M., Husain, W., Rashid, N.A. (2015). A Review on Predicting Student's Performance Using Data Mining Techniques, Procedia Computer Science, 72, 414–422.
- Baradwajdan, B. & Pal, S. (2011). Mining Educational Data to Analyze Students’ Performance, International Journal of Advanced Computer Science and Applications, 2 (6), 63–69.
- Adhatrao K, Gaykar A, Dhawan A, Jha R, Honrao V. (2013). Predicting Students’ Performance using ID3 and C4.5 classification algorithms, International Journal of Data Mining & Knowledge Management Process, 3 (5), 39–52.
- Jiang, S, Williams, AE, Schenke, K, Warschauer, M, & O’Dowd, D. (2014). Predicting MOOC performance with week 1 behavior. In Proceedings of the 7th International Conference on Educational Data Mining (pp. 273–275).
- Wang, R., Ryu, H., & Katuk, N. (2015). Assessment of Students’ Cognitive-Affective States in learning Within A Computer-Based Environment: Effects on Performance. Journal of Information & Communication Technology,14, 153–176
- Liyanage, M., Gunawardena K., Hirakawa, M. (2016). Detecting Learning Styles in Learning Management Systems Using Data Mining. JIP 24(4), 740–749.
- Kabakchieva, D. (2013). Predicting Student Performance by Using Data Mining Methods for Classification, Cybernetics and Information Technologies, 13(1), 61–72.
- Bogarín, A., Romero, C., Cerezo, R. and Sánchez-Santillán, M. (2014). Clustering for improving educational process mining. In Proceedings of the Fourth International Conference on Learning Analytics And Knowledge. ACM, New York, NY, USA, 11–15.
- Zacharis, N. Z. (2015). A multivariate approach to predicting student outcomes in web-enabled blended learning courses. Internet and Higher Education, 27, 44–53.
- Zacharis, N. Z. (2016). Predicting student academic performance in blended learning using Artificial Neural Networks. International Journal of Artificial Intelligence and Applications, 7(5), 17–29.
- Nissen, E., & Tea, E. (2012). Going blended: New challenges for second generation L2 tutors. Computer Assisted Language Learning, 25(2), 145–163.
- Donnelly, R. (2010). Harmonizing technology with interaction in blended problem-based learning. Computers & Education, 54, 350–359.
- Peine A, Kabino K, Spreckelsen C. (2016). Self-directed learning can outperform direct instruction in the course of a modern German medical curriculum - results of a mixed methods trial. BMC Med Educ. 16:158.
- Hahessy, S., Burke, E., Byrne, E., Farrelly, F., Kelly, M., Mooney, B., & Meskell, P. (2014). Indicators of student satisfaction in postgraduate blended learning programmes: Key messages from a survey study. AISHE-J: The All Ireland Journal of Teaching and Learning in Higher Education, 6(3), 1941–1957.
- Shahiri, A. M., Husain, W., & Rashid, N. A. (2015). A review on predicting student’s performance using data mining techniques. In 3rd Information Systems International Conference, Vol. 72, pp. 414–422. Shenzhen: Elsevier.
- Batware, J. B. (2007). Real-time Data Mining for E-learning. Tshwane University of Technology.
- Larose, D. T., & Larose, C. D. (2015). Data mining and predictive analytics (1st ed.). John Wiley & Sons, Inc.
- Papamitsiou,Z., & Economides, A. (2014). Learning Analytics and Educational Data Mining in Practice: A Systematic Literature Review of Empirical Evidence. Educational Technology & Society, 17(4), 49–64.
- Chrysafiadi, K., & Virvou, M. (2013). Student modeling approaches: A literature review for the last decade. Expert Systems with Applications, 40(11), 4715–4729.
- Sison, R, & Shimura, M. (1998). Student modeling and machine learning. International Journal of Artificial Intelligence in Education, 9, 128–158.
- Aggarwal, C., C. (2015). Data Mining: The Textbook, Springer.
- Kumar, A and Kumar, S. (2017). Density Based Initialization Method for K-Means Clustering Algorithm, International Journal of Intelligent Systems and Applications (IJISA), 9(10), 40–48.
- Kotsiantis, S. B.. Kanellopoulos. D.. & Pintelas. P. E. (2006). Data preprocessing for supervised learning. International Journal of Computational Scienc, 1(2). 111–117.
- Kaur, Harjot & Verma, Prince. (2017). Comparative Weka Analysis of Clustering Algorithm‘s. International Journal of Information Technology and Computer Science, 9(8), 56-67.
- Pooja Thakar, Anil Mehta, Manisha. (2017). A Unified Model of Clustering and Classification to Improve Students’ Employability Prediction. International Journal of Intelligent Systems and Applications, 9(9),10–18.
- Rokach, L. and Maimon, O. (2007). Data Mining with Decision Trees: Theory and Applications. World Scientific.
- Quinlan, J.R. (1986), Induction of decision trees, Machine Learning,1, 81-106.
- Mitchell, T. M. (1997). Machine Learning. New York: WCB/McGraw-Hill.
- Breiman L., Friedman J., Olshen R., and Stone C.. Classification and Regression Trees. Wadsworth Int. Group, 1984.
