Classification of EEG signals using Hyperbolic Tangent-Tangent Plot

Author: Reza Yaghoobi Karimoi, Azra Yaghoobi Karimoi
Journal: International Journal of Intelligent Systems and Applications(IJISA) @ijisa
Article in issue: 8 vol.6, 2014.
Free access
In this paper, a novel signal processing method is suggested for classifying epileptic seizures. To this end, first the Tangent and Hyperbolic Tangent of signals are calculated and then are classified into two classes: normal (or interictal) and ictal, using a proposed classifier. The results of this method show that the classification accuracy of normal and ictal classes (97.41%) has been higher than interictal and ictal classes (92.83%) and generally, it has a good potential to become a useful tool for physicians.
Electroencephalogram (EEG), Epileptic seizure, Tangent, Hyperbolic Tangent
Short address: https://sciup.org/15010590
IDR: 15010590
Text of the scientific article Classification of EEG signals using Hyperbolic Tangent-Tangent Plot
Published Online July 2014 in MECS DOI: 10.5815/ijisa.2014.08.04
Controlling the biological activities and information transferring inside body of a living organism is a main origin of producing bioelectrical and bio-magnetic signals. Hence, any change or abnormality in the structure or function of these mechanisms significantly changes the output signals of the overall system. Then, detection of the modifications and disturbances will be an important factor for diagnosis.
One of the bioelectrical signals is the Electroencephalogram (EEG), which provides a suitable representation of the brain disorders and can be used particularly in epileptic disorders. For this reason, researchers [1, 2] believe that pseudo-epileptic discharge detection in EEG signals is an important index for the diagnosis of epileptic seizures. Hence, many studies have been conducted to diagnose epileptic seizures using linear and nonlinear methods such as Statistic Analyzers [1, 2], Frequency Analyzers [3, 4], Discrete Wavelet Transform [5-11], Model-based methods [12, 13], Phase-Plane Trajectories [14, 15], Lyapunov Exponents [16-19], Correlation Dimension [20-22] and Fractal Dimension [23-26].
But, almost none of the above methods offer a significant visual separation to diagnose epileptic seizures. On the other hand, some of the mentioned methods need to a large feature space and complex classifiers for classification. Therefore, the aim of this study is to offer a special map using Tangent and Hyperbolic Tangent functions, so that it is able to increases the diagnosing epileptic seizures as visual and machine. In fact, it seems that this map can generates different patterns for EEG segments of epileptic and normal.
Aim of this study development a two-class classifiers using the Hyperbolic Tangent and Tangent functions are to separated the classes: normal (or interictal) and ictal. To this end, first the EEG segments are transformed to a new space by the Hyperbolic Tangent and Tangent functions (i.e. the HT-T space). Then, the EEG segments are classified into two classes of normal (or interictal) and ictal, using the proposed classifiers with the specified thresholds in the HT-T plots.
-
II. Materials and Methods
-
A. Subjects and Data Recording
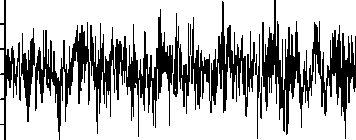
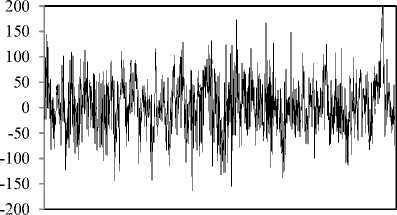
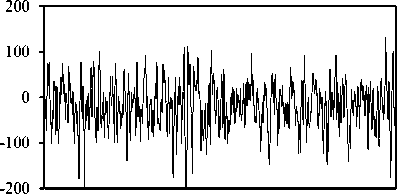
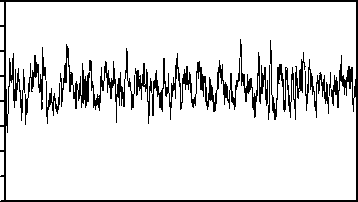
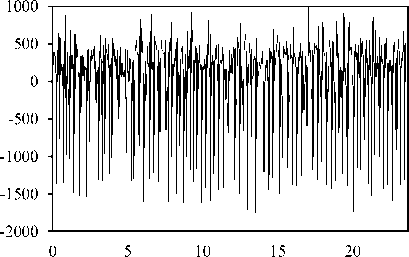
The publicly available data described by Andrzejak, et al. [27] is employed in the present study. The complete data consists of five sets from A to E, that each has 100 singlechannel EEG segments. As a typical case shown in Fig. 1, sets A and B consist of segments taken from surface EEG recordings that were carried out on five healthy volunteers using a standardized electrode placement scheme. The volunteers were relaxed in an awake state with eyes open (A), and eyes closed (B), respectively. Sets C, D, and E are originated from the EEG archive of pre-surgical diagnosis. The EEG signals of five patients were selected. All of the patients had achieved complete seizure control after resection of one of the hippocampal formations, which was correctly diagnosed to be the epileptogenic zone. Segments in set D were recorded from within the epileptogenic zone and segments in set C from the hippocampal formation of the opposite hemisphere of the brain. While sets C and D contained only activity measured during seizure free intervals (interictal), set E only contained seizure activity (ictal). All EEG signals were recorded with the same 128-channel amplifier system, using an average common reference. The data were digitized at 173.61 samples per second using 12-bit resolution. Band-pass filter settings were 0.53–40 Hz (12 dB/oct). In this study, we use every five sets. As such, sets A and B represent the normal class, sets C and D the interictal class, and set E the ictal class. Meanwhile, each of the segments 23.6s of the above sets have been divided to two segments 11.8s.
S001 (µV) F001 (µV) N001(µV) O001 (µV) Z001 (µV)
-50
-100
-150
-200
-50
-100
-150
-200
Time (Sec)
Fig. 1. Five typical EEG signals of the different datasets
tanh(XEEG[n])
tanh(X EEG [n])
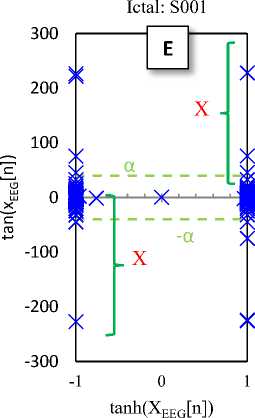
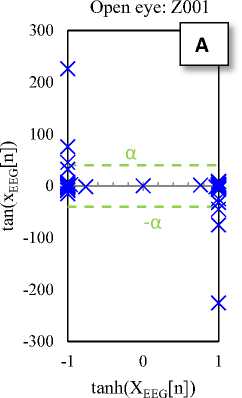
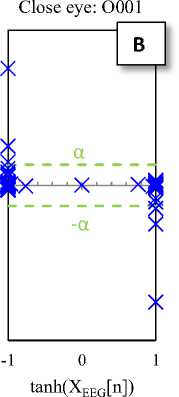
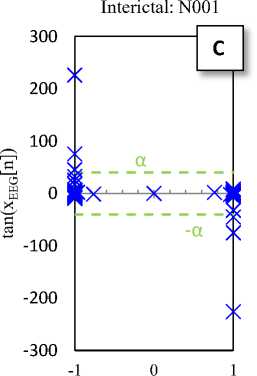
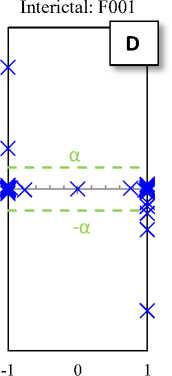
Fig. 2. Typical plots of the hyperbolic tangent - tangent plot of five EEG signals of the different sets
-
B. Hyperbolic Tangent - Tangent plot (HT-T)
The Hyperbolic Tangent – Tangent (HT-T) plot is a nonlinear process generated by plotting the hyperbolic tangent (x-axis) and the tangent (y-axis) of data. This plot produces unique (regular and symmetric) and approximately constant patterns for segments of the sets A to E, so that the change in structure (amplitude and location of activity) of productive resources of the data is lead to the change in the HT-T plot. In addition, it seems that the HT-T plot quantifies the ratio changes of signal sine and cosine (the signal tangent). So, this technique is a signal processing method of BIOS domain [28].
0 20 40 60 80 100
α
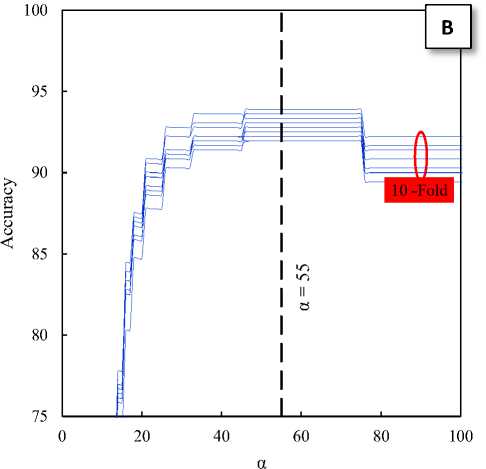
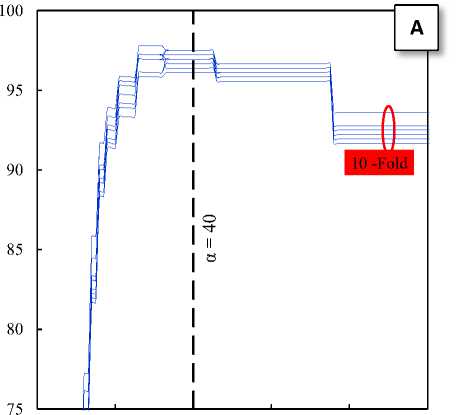
Fig. 3. The effects of α parameter on the classification accuracy of the train sets: A) Normal and ictal class, B) Interictal and ictal class
Fig. 2 shows the HT-T plots of five EEG signals of the five different sets. These plots indicate that the EEG generally has a specific pattern, so that the change in structure of its productive resources is lead to the change in the EEG pattern (see Fig 2-E). In fact, the changes in the HT-T plot are concepts from the system dynamic, which usually are affected by amplitude and frequency of the signal. These effects are appeared as distance from the origin of coordinates (y-axis) and deformation.
-
C. Classifier
The HT-T plots in Fig. 2 show samples of the EEG segments for epileptic phases: normal, interictal and ictal, which can easily distinguish from each other. In fact, the proposed classifier only checks the points available at the X area (Fig. 2-E). Then, these points are the main indicators for diagnosis. Hence, if each of these points in the HT-T plot is observed in the EEG sample, the ictal is diagnosed; otherwise, the diagnosis is normal (or interictal). So, the classifier algorithm can is summarized as follows:
Classifier algorithm:
If tanh(xEEG[n]) = 1 and tan(xEEG[n]) > a then, the EEG sample is ictal.
If tanh(xEEG[n]) = -1 and tan(xEEG[n]) < -a then, the EEG sample is ictal.
Otherwise, the EEG sample is normal (or interictal)
Where xEEG is an EEG segment and α is a separation threshold on the y-axis of the HT-T plot. This threshold is a very important factor in the proposed technique. Hence, to find the optimal alpha has been investigated the effects of the alpha parameter on classification accuracy for the ten sets of train divided by 10-fold cross-validation method. Fig. 3-A shows the effects of α parameter on the classification accuracy of the train sets for two classes: normal and ictal. Similarly, Fig. 3-B shows the effects of α parameter on the classification accuracy of the train sets for two classes: interictal and ictal. As can be seen in Fig. 3, the accuracy of the proposed classifier for two classes: normal and ictal in the neighborhood of α = 40 and for two classes: interictal and ictal in the neighborhood of α = 55 has been maximum. Therefore, these values can be the optimal values for the separation thresholds.
-
III. Experimental results
Identifying Epilepsy seizure via the EEG is a pattern recognition concept, which includes data acquisition, signals processing, feature extraction and finally epilepsy seizure detection. Thus, the revision of the above parts can improve the epilepsy diagnostic methods. In this study, first the EEG segments are transformed to a new space by the Hyperbolic Tangent and Tangent functions (i.e. the HT-T space). Then, the EEG segments are classified into two classes of normal (or interictal) and ictal, using the proposed classifiers with the specified thresholds (α = 40 and α = 55) in section 2.2. Fig. 4 shows the proposed classification process, and Table 1 shows the distribution of the training and testing sets for each fold of the 10-fold cross-validation.
In this respect, Table 2 shows the evaluation results of the two classifiers for test sets of a 10-fold crossvalidation. As seen in this table, the accuracy of the normal and ictal classifier (97.41%) is higher than the accuracy of the interictal and ictal classifier (92.83%). The reason for this decline of accuracy is the existence of spikes in the interictal phase. Nonetheless, the proposed classifier has a good ability to separate the mentioned classes.
Table 1.The distribution of the training and testing sets for each fold of the 10 fold cross validation
|
Classes |
Sets |
Train set |
Test set |
Total |
|
Normal Interictal Ictal |
A, B C, D E |
240 240 120 |
160 160 80 |
400 400 200 |
|
Total |
All |
600 |
400 |
1000 |
|
Data |
Sets |
|||
|
Andrzejak (2001) Sets: A, B, C, D, E Fs: 173.61 Hz |
Total samples: 1000 Train samples: 600 Test samples: 400 |
|||
|
Evaluation Accuracy Specificity Sensitivity |
Calculation у |
|||
|
Classification Two classes h |
1 |
tan(x EEG ) tanh(x EEG ) |
||
Fig. 4. Classification process
Table 2. Evaluation results of two classifiers for test set of a 10 fold cross validation
|
Classes |
Accuracy |
Specificity |
Sensitivity to Ictal |
|
Normal and Ictal |
97.41 |
94.63 |
98.81 |
|
Classes |
Accuracy |
Sensitivity to Interictal |
Sensitivity to Ictal |
|
Interictal and Ictal |
92.83 |
94.25 |
92.13 |
-
IV. Discussion
Many studies have been done on detection of epilepsy phases. But, based on the findings of the present study and the experiences in the EEG signal classification, we intend to emphasize the following:
-
1) Nigam, et al. [29] used the sets A and E with different features and ANNs showed an accuracy of 97.2% and claimed that the ANNs are highly efficient to classify the normal and ictal.
-
2) Subasi [30] used the sets A and E and applied the DWT on them to extract the features such as mean and standard deviation each sub-band and ratio of adjacent sub-bands. Then, using a MENN (which was included three expert networks and a gaiting network) and a standalone MLP classified sets A and E into two classes: normal and ictal. Finally, he declared the accuracy for the MENN was as 94.5% and for the standalone MLP was as 93.2%.
-
3) Übeyli [31] presented a MENN using wavelet coefficients for the classifying of the EEG sets: A, D and E. The total classification accuracy obtained by the ME network structure was 93.17%.
-
4) Übeyli [32] presented an integrated view of the automated diagnostic systems combined with spectral analysis techniques in the classification of the same EEG signals consisted of five sets (sets A–E). The paper includes illustrative and detailed information about implementation of automated diagnostic systems and feature extraction/selection from the EEG signals.
-
5) Übeyli [33] used a PNN using wavelet coefficients for classification of the same EEG signals consisted of five sets (sets A to E). The drawn conclusions indicated the PNN trained with wavelet coefficients achieved high classification accuracies (97.63% accuracy).
-
6) Subasi, et al. [9] used a combination of different classifiers on the datasets A and E with the following results: SVM+PCA (98.75% accuracy), SVM+ICA (99.5% accuracy) and SVM+LDA (100% accuracy). Although, the above methods can find the optimal features but those changes the classifiers as an offline classifier. Then, these feature extraction methods (such as Principal Component Analysis (PCA), Independent Component Analysis (ICA) and Linear Discriminant Analysis (LDA)) have not compatibility with quasi-real time algorithms, and are incompatible with the diagnostic system.
Because, a diagnostic system receives only a single sample (i.e. features of an EEG segment) of the testing data and distinguishes the normal data from abnormal ones, while in a diagnostic system using the feature extraction methods; several samples of the testing data has needed. This structure is considered as a disadvantage because the scatter matrix in PCA, ICA and LDA algorithms is zero for a single sample.
-
7) In this sense, using the same sets (A and E) and extracted features (11 dimensions) from autoregressive (AR) models and a LS-SVM classifier, Übeylï [12] shows classification accuracy of 99.56%.
-
8) Gandhi, et al. [10] used the sets A and E. They extracted energy, entropy, standard deviation, mean, kurtosis, skewness and entropy estimation at each node of the decomposition tree of the discrete wavelet transform. Then, with a probabilistic neural network (PNN) classified sets A and B using energy features, entropy features, energy and entropy features, all the features and the selected features of discrete harmony search with modified differential mutation operator (DHS-MD). The results of these work show that the probabilistic neural network and the discrete harmony search with modified differential mutation operator have a good ability to classification of these sets, so that they can give as average 99.67% , 99.67%,
99.70%, 99.18% and 100% accuracy for energy features, entropy features, energy and entropy features, all the features and the selected features of discrete harmony search with modified differential mutation operator, respectively.
-
9) Nicolaou, et al. [2] using the extracted features of Permutation Entropy (PE) and classifiers of Support Vector Machine classified the five sets (A to E) into five class. Finally, the maximum overall classification obtained was 93.55%, 82.88%,
88.83%, and 83.13% for sets A to D respectively.
-
10) Hosseini, et al. [18] by an Neuro-Fuzzy Inference System (ANFIS) classified the five sets (A to E) using extracted features of Hurst exponent and Lyapunov exponent into two classes: Normal (or interictal) and ictal. They could give 96.9% accuracy for the classes of the normal and the ictal, and 96.5% for the classes of the interictal and the ictal. Ultimately, they claimed that non-linear analysis could give a promising tool for detecting relative changes in the complexity of brain dynamics, which may not detect by conventional linear analysis.
-
11) Joshi, et al . [34] using the modeling error and signal energy of Fractional linear prediction model (FLPM) have develop a Support vector machine (SVM) for classifying of classes interictal (C and D set) and ictal (E set). Eventually, they claim that FLPM is a powerful and effective method for modeling of EEG signals and the classification of EEG data using error energy and signal energy as
parameters to the SVM has proved to be successful with a maximum classification accuracy of 95.33%.
Although the results of above research showed promising performance for classifying of Epileptic EEG signals. Nevertheless, some of the mentioned methods due to use of a large feature space and or the complex structures are the time consuming. On the other, some of the used classifiers find the local minimum in the error function, while we tend to find the global minimum. In addition, some of the feature extraction methods are incompatible with quasi-real time algorithms, while the used algorithms for clinical systems are usually the quasi -real time. In contrast to the findings of this study show that the proposed technique not only can reduce the mentioned weaknesses (esp. the time consumption, the computational load, find the global minimum in the error function and the compatibility with quasi-real time algorithms), but also it argues that such the HT-T plot can provide an appropriate visual view for the separation of epilepsy signals. Generally, the proposed technique due to use of the two-dimensional feature space and the simplicity classifier is included a low computational load. Also, since there is only a separation threshold (alpha) in the proposed classifier, therefore using a full search method in the thresholding range can be used to determine the threshold value with the highest accuracy (the global minimum in error function).
-
V. Conclusion
Epilepsy is a neurological disorder caused by sudden changes in the brain electrical balance that is usually due to various disorders such as infections, trauma and head trauma, tumors, brain damages from infancy or hereditary diseases. Hence, to diagnose epilepsy, we need to check the patient history, physical examinations, interpretation of electroencephalogram records and supplementary clinical information such as CT-SCAN, PET, MRI and FMRI. Of course, due to the simplicity of brain signal recording, EEG analyzers, and interpreters often are used, which are helpful to diagnose epilepsy. So, in the current study has been developed a classifier using the extracted features of the HT-T plot (calculated from the EEG signal) for the diagnosis of epilepsy seizures. In sum, the findings of this research show that the proposed method (in addition to its simplicity, it has a low computational load and its compatibility with quasi-real time algorithms) provides the appropriate representation of epilepsy seizures and can open a new way to detect this disease. Thus, it is hoped that further research will be conducted in this field, which may consequently provide more efficient processing methods for EEG signal classification.
Acknowledgment
The authors are thankful of the R.G. Andrzejak and his colleagues for publicly available database, described in Andrzejak et al. (2001).
References Classification of EEG signals using Hyperbolic Tangent-Tangent Plot
- Adeli H, Zhou Z, Dadmehr N. Analysis of EEG records in an epileptic patient using wavelet transform. Journal of Neuroscience Methods, 2003, 123(1): 69-87.
- Subasi A. EEG signal classification using wavelet feature extraction and a mixture of expert model. Expert Systems with Applications, 2007, 32(4): 1084-1093.
- Mashakbeh A. Analysis electroencephalogram detect epilepsy. International Journal of Academic Research, 2010, 2(3): 342-348.
- Nicolaou N and Georgiou J. Detection of epileptic electroencephalogram based on Permutation Entropy and Support Vector Machines. Expert Systems with Applications, 2012, 39(1): 202-209.
- Alessandro M, Esteller R, Vachtsevanos G, et al. Epileptic seizure prediction using hybrid feature selection over multiple intracranial eeg electrode contacts: a report of four patients. Biomedical Engineering, IEEE Transactions on, 2003, 50(8): 1041-1041.
- Yamaguchi C. Fourier and Wavelet Analyses of Normal and Epileptic Electroencephalogram. Memoirs of the Fukui Institute of Technology, 2003, 33: 305-312.
- Latka M, Was Z, Kozik A. et al., Wavelet analysis of epileptic spikes. Physical Review E, 2003, 67(5): 052902.1-052902.4.
- Subasi A, Ercelebi E. Epileptic seizure detection using dynamic wavelet network. Expert Systems with Applications, 2005, 29(2): 343-355.
- Subasi A, Ercelebi E. Classification of EEG signals using neural network and logistic regression. Computer Methods and Programs in Biomedicine, 2005, 78(2): 87-99.
- Subasi A, I Gursoy M. EEG signal classification using PCA, ICA, LDA and support vector machines. Expert Systems with Applications, 2010, 37(12): 8659-8666.
- Gandhi T K, Chakraborty P, Roy G G, et al. Discrete harmony search based expert model for epileptic seizure detection in electroencephalography. Expert Systems with Applications, 2012, 39(4): 4055-4062.
- Aliabadi R, Keynia F, Abdali M. Epilepsy Seizure Diagnosis in EEG by Artificial Neural Networks. Journal of Multimedia Processing, 2013, 2(2): 1-5.
- Khan Y U, Farooq O, Tripathi M, et al. Automatic detection of non-convulsive seizures using AR modeling. Power, Control and Embedded Systems (ICPCES), 2012 2nd International Conference on, 2012: 1-4.
- Übeyli E D. Least squares support vector machine employing model-based methods coefficients for analysis of EEG signals. Expert Systems with Applications, 2010, 37(1): 233-239.
- Babloyantz A, Destexhe A. Low-dimensional chaos in an instance of epilepsy. Proceedings of the National Academy of Sciences, 1986, 83(10): 3513-3517.
- Collura T F, Morris H H, et al. Phase-plane trajectories of EEG seizure patterns in epilepsy. The American journal of EEG technology, 1992, 32: 295-307.
- Güler N F, Übeyli E D, and Güler İ. Recurrent neural networks employing Lyapunov exponents for EEG signals classification. Expert Systems with Applications, 2005, 29(3): 506-514.
- Lai Y C, Harrison M A F, Frei M G, et al. Inability of Lyapunov Exponents to Predict Epileptic Seizures. Physical Review Letters, 2003, 91(6): 068102-1 - 068102-4.
- Hosseini S A, Akbarzadeh M R, Naghibi-Sistani M B. Qualitative and Quantitative Evaluation of EEG Signals in Epileptic Seizure Recognition. I.J. Intelligent Systems and Applications, 2013, 6: 41-46.
- Goshvarpour A, Ebrahimnezhad H, and Goshvarpou A. Classification of Epileptic EEG Signals using Time-Delay Neural Networks and Probabilistic Neural Networks I.J. Information Engineering and Electronic Business, 2013, 1: 59-67.
- Lai Y C, Osorio I, Harrison, M A, et al. Correlation-dimension and autocorrelation fluctuations in epileptic seizure dynamics. Physical review. E, Statistical, nonlinear, and soft matter physics, 2002, 65(3 Pt 1): 031921.
- Osorio I, Harrison MA, Lai Y C, et al. Observations on the Application of the Correlation Dimension and Correlation Integral to the Prediction of Seizures. Journal of Clinical Neurophysiology, 2001, 18(3): 269 -274.
- Pijn J, Velis D, Heyden M, DeGoede J, et al. Nonlinear dynamics of epileptic seizures on basis of intracranial EEG recordings. Brain Topography, 1997. 9(4): 249-270.
- Esteller R, Vachtsevanos G, Echauz J, et al. Fractal dimension characterizes seizure onset in epileptic patients. 1999, 4: 2343-2346.
- Esteller R, Echauz J, Tcheng T, et al. Line length: an efficient feature for seizure onset detection. in Engineering in Medicine and Biology Society, 2001. Proceedings of the 23rd Annual International Conference of the IEEE. 2001: 1-4.
- Xiaoli L, Polygiannakis J, Kapiris P, et al. Fractal spectral analysis of pre-epileptic seizures in terms of criticality. Journal of Neural Engineering, 2005, 2(2): 11-16.
- Kim S H, Faloutsos C, Yang, H J, et al. Coercively adjusted auto regression model for forecasting in epilepsy EEG. Computational and Mathematical Methods in Medicine, 2013: 1-12.
- Andrzejak R G, Lehnertz K, Mormann F, et al. Indications of nonlinear deterministic and finite-dimensional structures in time series of brain electrical activity: Dependence on recording region and brain state. Physical Review E, 2001, 64(6): 0619071-0619078.
- Sabelli H. BIOS: A Study Of Creation. World Scientific, 2005.
- Nigam, V P, Graupe D, A neural-network-based detection of epilepsy. Journal of Neurology Research, 2004, 26: 55 -60
- Übeyli E D, Wavelet/mixture of experts network structure for EEG signals classification. Expert Systems with Applications, 2008. 34(3): p. 1954-1962.
- Übeyli E D, Decision support systems for time-varying biomedical signals: EEG signals classification. Expert Systems with Applications, 2009, 36(2, Part 1): 2275-2284.
- Übeyli E D, Lyapunov exponents/probabilistic neural networks for analysis of EEG signals. Expert Systems with Applications, 2010, 37(2): 985-992.
- Joshi V, Pachori R B, Vijesh A, Classification of ictal and seizure-free EEG signals using fractional linear prediction. Biomedical Signal Processing and Control. 2014, 9(0): p. 1-5.
