Classification of Forest Land Information Using Environment Satellite (HJ-1) Data
 Data")
Author: Yanxia Wang, Wanli Huang, Yufeng Liu, Hu Li
Journal: International Journal of Intelligent Systems and Applications(IJISA) @ijisa
Article in issue: 4 vol.3, 2011.
Free access
For researching properties of HJ-1A CCD camera multi-spectral data in performance on extraction of land features information, this paper selected the east area of NiLeke forest farm in the western Tianshan mountain as the study area, and analyzed different accuracies for HJ-1A CCD data in identifying forest land categories using various classification methods. Firstly, maximum-likelihood classifier, Mahalanobis distance classifier, minimum distance classifier and K-means classifier were used to category land use types with two different scales on HJ-1A CCD1 and Landsat5 TM images, and analyzed separately with confusion matrix. Secondly, forest land types were distinguished by texture information and the smallest polygon size using K-NN method based on clustering algorithm. The comparing results show: at first, different classification system have different accuracy. In the first land use classification system, the accuracy of HJ-1A CCD1 images are lower than TM images, but higher in the second land use classification system. Secondly, accuracy result of maximum-likelihood classification is the best method to classify land use types. In the first land use classification system, TM total accuracy is up to 85.1% and Kappa coefficient is 0.8. In the second land use classification system, the result is up to 85.4% and kappa coefficient is 0.74.Thirdly, judgment both from the view of visual interpretation and quantitative accuracy testes, non-supervised method with K-means classifier has low qualities where many land features have characters of scattered distribution and small different spectrum information. Finally, the experiment proved that there were good vector results on HJ-1A remote sensing image in the view of visual judgment, and extracted deferent forest land by the overall accuracy 87% with the supports by those variables’ distribution knowledge, such as conifer, mixed forest, broadleaf, shrubby.
HJ-1A CCD1 data, image classification, different scale, land use features extraction
Short address: https://sciup.org/15010199
IDR: 15010199
Text of the scientific article Classification of Forest Land Information Using Environment Satellite (HJ-1) Data
Published Online June 2011 in MECS
As an advanced land observation system equipped with kinds of remote sensor, such as wide coverage CCD camera, infrared camera, high spectral photographer, synthetic aperture radar (SAR), HJ-1 constellation is composed of those small remote sensors for monitoring environment or forecasting disaster. Currently, it is the almost complicated and advanced system among domestic civil satellite systems. Since HJ-1 optical satellites were launched, they have been playing important roles with scientific foundation in forecasting change trends of ecological environment and disaster, fast disasters estimate, emergency rescue, postdisaster help and reconstruction. As a new satellite system of our country with middle and high resolution, HJ-1 remote sensing images can offset some limits of ground measurement and have great potentiality in water, atmosphere and ecological environment [1] owing to higher spectral resolution and time resolution than Landsat TM. Basing on HJ-1 satellites can observe dynamic forest resource with high speed and wide coverage, the land use classification is fundamental for construction advanced environmental and disaster monitoring system and forecasting system, and also for improving the abilities of environmental monitoring and comprehensive disaster reduction.
Among studies of domestic remote sensing images, many papers have wrote lot of documents about study and application on CBERS images[2], but there are few studies on illustrating quality and accuracy of HJ-1 satellite images in interpreting ground information especially over mountainous area. Yi Ling, et al [3], who studied quality of HJ-1A optical satellite image and used maximum likelihood classifiers, minimum distance classifiers and Mahalanobis distance classifiers to evaluate computer auto-classification accuracy. They argued that the maximum likelihood method had the best accuracy for HJ-1B satellite image, but Mahalanobis distance method had the worst accuracy. Luyan, et al [4], compared HJ-1A/B satellite CCD multi-spectrum data with TM data, and got a conclusion that typical features spectral curve data had good correlation with TM spectrum data which accuracy reached up to 85% more. However, they did not point out suitable classification conditions for the two kinds of remote sensing data and the best classifier. Zhu Haiyong [5] compared HJ-1A/B CCD images with TM data in the terms of
* Foundation item: Civil Defense Industry Special Scientific Research Project of China (2006A01A0200)
band matching, spatial resolving ability and non-supervised classification. One question is that there are no relative radiation correction and matching since TM images were selected as reference dataset. Besides, both are lack of accuracy tests with field measured data.
It is meaningful to study algorithms of how to improve quality in extracting land use information with HJ-1 satellite images based on classification methods and its applied experience of TM images. For remote sensing images with middle spatial resolution, classified technologies of TM images are relatively mature [6] and have been applied in forest resource dynamic monitoring, forest inventory for management [7], coastal windbreaks forest systems construction [8], forest landscapes ecology and ecological tourism [9], city environmental geology information study [10], land use/ land surface variety, land degradation evaluation and forecast. For example, Sichuan province of China in 2000 used TM images to statistic forest resource of WoLong natural reserve areas. In the year of 2004, Guangdong province of China used TM images to complete forest resource inventory for management [7]. Image classification quality is important for remote sensing images applications in the late term. Image properties of HJ-1 optical satellite have a good similar relationship with TM images [1].
This paper presented land use and forest classification with segment polygons and mathematics accuracy of HJ-1 remote sensed data. 1) HJ-1A satellite CCD data and TM were preprocessed using the same well algorithms of geometry correction and spectrum recover. 2) Identification of land use information in different scales with supervised method and non-supervised method. 3) By Comparing and analyzing classified results, the conclusions were illustrated about suitability of HJ-1A CCD data for land use categories with the best scale. 4) With the supporting of forest resource distributing knowledge, classification in forest land area used HJ-1A CCD1 data was done, which combined a cluster algorithm and K-NN classified method.
-
II. Study Area and Data
-
A. Overview of Study Area
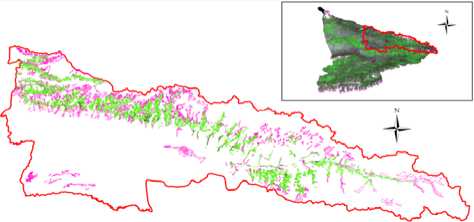
The study area located in the hinterland area of east Ni Le-ke, where is in the northern Tian Shan Mountain, Xinjiang province. Ni Le-ke crosses 81°58'—84°58' of longitude and 43°25'—44°17' of latitude, which contains a state-owned forest farm named Ni Le-ke forest farm. From east area to west area, it is elongated shape with surrounding high mountains that high in northeast, low in southwest, valleys and terraces exist in the middle. The main land type of this area is coniferous forest with shrub as supplement. The tree species is main spruce characterized by slow growth rate and living in shady slope below 2800 meters elevation. According to forest inventory data of 2010 supplied by Xinjiang Autonomous Region Forestry Bureau, land types are composed by bush forest land, coniferous woodland, mixed forest land, waste mountains and land suitable for tree planting, and broad-leaf forest land, just as the graph over Ni Le-ke forest farm in Figure 1. The small image in Fig.1 shows
HJ-1A CCD bands 1, 4, 3 composited image of Yi Li remote sensing images and the experimental area is within the red Ni Le-ke border line.
Bush forest land Coniferous wood land Mixed forest land
Waste mountains and land suitable for Broad-leaf forest land tree planting
-
Figure 1. Land types distribution graph of forest inventory data in Ni Le-ke forest farm
-
B. Data
This paper used DEM of east Ni Le-ke with 30 meters spatial resolution, HJ-1A satellite CCD1 L2-Level image in 25/8/2005 and TM L2-level images in 15/10/1999. Although two images have large time span, this paper considers that the two images are able to be comparable for the reason that forest covers are mainly the original spruce with small annual growth rate.
Comparison blue, green, red, and near infrared bands of HJ-1A CCD camera with Landsat/TM, just as the detailed parameters in TABLE I [11, 12]. They have three characteristics: same spatial resolution, similar wavelength range and higher time resolution.
TABLE I.
Basic load parameters table for visible channel of HJ-1A CCD camera sensor and the TM remote sensor
|
Sensor |
Band |
Wavelength u m) |
Resolution (m) |
Revisit cycle(day) |
|
Blue |
0.43 — 0.52 |
|||
|
HJ-1A |
Green |
0.52—0.60 |
||
|
CCD |
Red |
0.63 — 0.69 |
30 |
4 |
|
camera |
Near infrared |
0.76 — 0.90 |
||
|
Blue |
0.45 — 0.52 |
|||
|
Green |
0.52 — 0.60 |
|||
|
Landsat5 TM |
Red |
0.63 — 0.69 |
30 |
26 |
|
Near infrared |
0.76 — 0.90 |
|||
The blue band that can distinguish soil, vegetation and land use information were selected to quantitatively judge qualities of the two type remote sensing data through information, signal to noise ratio, mean value and other index, as the following TABLE II. Comparing from index values, information expression quality of HJ-1A satellite CCD1 experimental data in band blue is better than TM experimental data in band blue, but its resistance to noise is lower than TM data.
TABLE II.
The evaluation indexes value of the band blue qualities of
EXPERIMENT IMAGES
|
Index |
HJ-1A CCD1 |
Landsat TM |
|
Information Amount |
37.938 |
27.59 |
|
SNR |
0.34991 |
0.42533 |
|
Mean |
14.492 |
52.183 |
|
Variance |
8.708 |
45.192 |
|
Skewness |
0.05494 |
2.56106 |
|
Gradient |
0.7622 |
9.44 |
Ш . Methods
-
A. Supervised Classification
Supervised classification method and unsupervised classification method are used to do land cover classification over none-urban area for HJ-1A CCD1 and TM datum.
Supervised classification used maximum likelihood classifier; Mahalanobis distance classifier and minimum distance classifier, respectively. Non-supervised classification used K-Means classifier. Each result with these classifiers was tested by system evaluation indexes of overall accuracy and Kappa index.
-
(1) Maximum likelihood classifier
Maximum likelihood classifier, also known as Bayesian classifier, is a commonly statistical method for supervised classification [13]. By vesting training samples in the categories with largest index value of belonging probability, classification is carried out [14]. When pixel i exist, its belonging probability is as followed:
G
P ( g / X ) = [ P g f g ( X )]/ X [ P J, ( X )]
i = 1
p
Where, represents prior probability of i class, and i = 1, p (g/X) 2… G;
is belonging probability of pixel X to the g class. The bigger is
p ( g / X )
, the bigger of this belonging probability is. When multiple classes are identified, p (g * / X) = max[P(g / X)] X G g *
if , then .
-
(2) Minimum distance classifier
According with the average distance from each pixel to training samples, Minimum distance classifier, known as the spectral distance criterion rules, uses mean pixel value of each class in each band of training samples to determine which class they should belong. This classifier is suitable when each class has one representing vector.
Produce one representative center vector M , ( i=1,2, ™ ,
n) . n is the sum class number. And then calculate the distance between pixel group x of every class and M . Finally, determine x belongs to the class whic has the smallest distance to x [15].
d ( x , M , ) = | | x - M , | = [( x
^^^^^s
1/2
"1 /2
M , ) ( x - M ) ] = X ( x - m k )
_ k =1 _
-
(3) Mahalanobis distance classifier
Difference of this classifier with minimum distance classifier is their covariance. Assuming that input bands follow Normal distributions, this classifier considers sample correlation and is applicable for classification that has to care about statistical indicators. The main formula is as followed:
D = ( X - M , ) T ^ c X - M)
Where D is Mahalanobis distance; i is one class; X is pixel measured vector; M is the template of average vector of type
i; is the pixel covariance matrix in template of type i; T is transpose function.
-
B. Unsuperv sed Class f cat on
Unsupervised classification is more automated than supervised classification. The application of this method does not require users’ knowledge for study area, but only few parameters setup by users to carry out auto-recognition. Unsupervised classification reduces probability of errors and influence made by subjective factors. By default, the unsupervised classification judge pixels with the same or similar spectral characteristics which should belong to one feature class. Besides, different surface features may have different spectral information. These limitations determine that the results of classification may not satisfy some users’ needs. That is, same land covering types may be categorized into different classes in different images at different periods. And, this method usually results in poor continuity of segmented polygons [16].
This paper selected K-means classifier as the class clustering algorithm of unsupervised classification. K-means classifier algorithm is an indirect clustering method based on similarity of samples. By iteration, class centers are moved successively until the best clustering results were obtained.
J j = XI x - z j (. l +1)II 2
x e Sj( 1) And zj( 1+1)=Xx
N j X E S ( 1 )
J
Where, j is clustering criteria of error sum of squares, Nj is sample number contained by Sj which is the clustering class j, j=1, 2 - K.
-
C. K-NN Classified Method Based on Clustering Algorithm
The K Nearest Neighbors classified method bases one clustering algorithm to select learning sample from the result dataset of cluster and then constructs classifier to classify the whole dataset [17]. It is mainly concluded the following procedures:
-
1) Select one cluster algorithm and cluster the training samples.
-
2) Find the cluster centers.
-
3) Select the representative data as training samples from each class by one method taking for random selection as example.
4) Construct classifying algorithm using training samples. The details of this procedure are as the followed:
i . Build training sample dataset X
n. Set up the original value of K
ш. Select K samples from training samples, which are near by target sample. Supposed that the sample point x belongs to space R n with n dimensions, and then the nearest samples are measured by Euclidian distance. Set the ith sample is x i = ( xj 1 , xj 2 , xj 3 , l xj n ) e R n , which X i represents the lth feature value of the ith sample. The Euclidian distance between xi and xj is defined by:
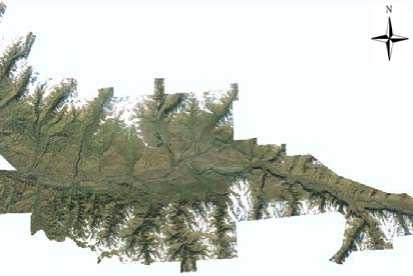
Figure 2. The original anti-visual image of TM sensor
d ( x , x j ) =Ah ( x i - X l ) 2
1 = 1
v. Given that a sample x q is to be classified,
and x 1, L , xk means K samples which are relatively nearest
to sample xq . A discrete target function (that is classifying
problems) is
f : R n ^ v.
, which vi is the feature keys of
the ith class and label set is defined as V = { v 1 , l V , } .
~ k
f ( X q ) = arg max ^ ^ ( V , f ( X . ))
i = 1
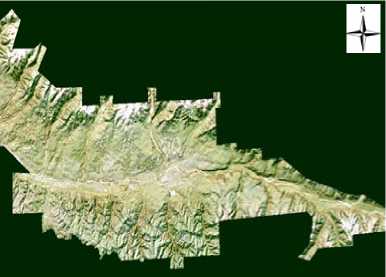
Figure 3. The normal view of HJ-1A satellite spectral CCD camera processed by spectrum recovery operation
where
~
q is the evaluation of x q .
V.
~
f ( xq )
is the final recognized class of target sample xq .
W Results
-
A. Pre-processing
(1)Geometric correction
Geometric correction was done based on terrain features since there seldom road turning points in mountain area [18]. First, ridge lines and valley lines are extracted from 30 meters DEM. Secondly, find apparent turning points from those feature lines and the remote sensing images. Thirdly, construct polynomial function to adjust images. The errors were controlled within one and a half pixels.
-
(2) Spectrum recovery
As the phenomenon that similar land features have different spectrum and different land features have similar spectrum, spectrum recovery must be done to get real landscape gray information. Advanced 6s atmospheric correction model by DEM is used to get rid of problem of DN differences in shady and sunny slope with the same vegetation [19]. With DEM, the flat landscape can be transformed into the real terrain landscape and resolve that phenomenon. Origin TM image is showed as Figure 2. The spectrum recovery result is showed by HJ-1A CCD1 image in Figure 3. This algorithm turned anti-visual images into normal visual images and the results was considered to be good.
-
B. Interpretation Lables Establishment
The interpretation keys used by supervised classification were established at two scales that the first and the second classification scale system. According to “land use classification” issued jointly by General Administration of Quality Supervision, Inspection and Quarantine of The People’s Republic of China and Standardization Administration of The People’s Republic of China, and combined with Nileke forest survey contents, the first scale classification types include forest land, grassland, and arable land. In addition, as there are some snow areas in remote satellite images and fully identification can not be done. So, the first classification system also includes snow covering land. The second scale classification system contains forest land, barren hills and wasteland but suitable for planting, spares forest land, and shrub forest land according to identifiable classes and type settings of forest resources survey project on the land type investigation.
Characteristic feature of forest resources and their site environment at different spatial and temporal scales are different, especially at spatial scale, which determines the two different classification scales have different semantics [20]. Using visual interpretation, image processing, analysis techniques and according to corresponding correlation between remote image features and land surface features, relationship of interpretation factors with their features characters like as color, shape, structure, geographical distribution and site conditions were built with the supporting information. By field survey and indoor analysis, unified understandings and interpretation standards were built by charactering each class features for remote sensing data. Thus, interpretation keys of the two classification system were built as followed:
TABLE III.
distribution area. On the other hand, 1) aggregation degree of TM image recognition is higher. 2) Results of minimum distance classifier for spruce were better. 3) Each classifier to TM data had phenomenon of over-classification that spruce forest spread to sunny slope from shady slope. 4) The maximum classifier was better for spruce, linear land features, and snow covering land.
Interpretation key characters table of the first scale
CLASSIFICATION SYSTEM
|
Semantic items |
Color |
Shape |
Location |
|
Forest land |
Dark green |
sheet or strip Distribution |
Shady slope |
|
Grass land |
Light green |
sheet Distribution |
Sunny slope |
|
Agricultural land |
green |
Cross and regular distribution |
Flat land |
|
Snow covered area |
white |
Sheet distribution |
High altitudes |
TABLE IV.
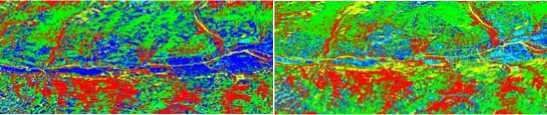
a. maximum likelihood classifier b. mahalanobis distance classifier
c. minimum distance classifier d. K-means classifier
Interpretation key characters table of the second scale
CLASSIFICATION SYSTEM
|
Semantic items |
Color |
Shape |
Grain |
Location or distribution |
|
Forest land |
Dark |
Irregular blocks, flakes |
Granular and stronger texture |
Shady slope Grass land |
|
Suitable land for forest |
Yellow ,deep yellow |
Irregular bulk or ribbon |
Smooth |
within 150m far from coniferous forest edge |
|
Sparse forest land |
Yellow green , light green |
Large irregular blocks or sheets |
Granular and strong texture |
Sunny slope , all slope |
|
Shrubbery |
Yellow green , dark green |
Irregular large bulk or sheet |
Granular and strong texture |
Sunny slope , mesoslope or downgrade |
|
Legend a, b, c |
^^^g |
|||
|
Forest |
Grass |
Farm |
Snow |
|
|
land |
land |
land |
covering land |
|
|
Legend d |
Forest land |
Grass land |
Farm land |
|
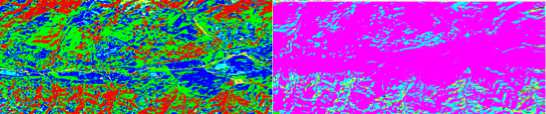
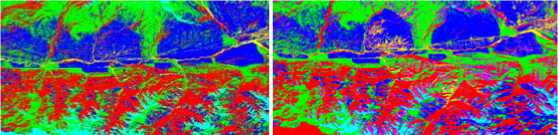
Figure 4. Classification results of HJ-1A CCD composited images
a. maximum likelihood classifier b. mahalanobis distance classifier
C. Evaluation and Comparative Analysis of Classification Results Based on HJ-1A CCD1 Data and TM Data
After extracting categories from the first scale system and selecting certain samples, supervised classification and unsupervised classification were carried over all areas of HJ-1A CCD1 data and TM data. Based on the survey results of forest land type distribution of forest inventory data, forest land area were clipped out and the samples were selected form each type polygon including forest land, sparse forest land, shrubbery land, barren hills and wasteland suitable for planting. Then, the second scale classification was done with each classifier. In this paper, the first level classification results of maximum likelihood classifier, mahalanobis distance classifier; minimum distance classifier and K-means classifier are showed in Figure 4 and Figure 5. On the one hand, fragmentation of classification results for CCD image is greater than TM image, and the ability to identify surface features of the former is stronger than the latter over forest
c. minimum distance classifier d. K-means classifier
Legend a, b, c

Forest Grass land land

Farm Snow land covering land
Legend d

Forest Grass land land
Figure 5. Classification results of TM composited images

Farm land
After remote sensing image classification, results must be checked by quantitative accuracy analysis. Through analysis of accuracy, classification models effectiveness and qualities can be determined. This paper calculated the overall accuracies and Kappa coefficients by the error matrix to evaluate the different sensor images’ results with different
classifier. Overall accuracy, representing the total accuracy level of classification results, was computed by the division that correctly classified pixel number to sum pixel of surface real classes. Kappa coefficient was calculated by Kappa coefficient function by the whole error matrix and assessed classification accuracy from a more comprehensive perspective [16]. Figure 6 compared different remote sensing images’ results by classification methods at different scales using overall accuracy and Kappa coefficient. For attaining directly comparison with HJ-1A CCD1 data and TM data, no more merge, eliminate and dissolve operation were done.
Firstly, at the first scale classification, classification accuracy of HJ-1A CCD1 data is lower than TM data, which means TM data is more suitable for classification at larger scale under the same pre-processing. At the second classification scale, classification accuracy of HJ-1A CCD1 data is higher than TM data. Which means HJ-1A CCD1 data is more suitable for classification at small scale.
Secondly, among classifiers of supervised classification method, maximum likelihood classifier was better than other classifiers. Experiment showed that overall accuracy of TM data with this classifier at first classification system was 85.1% and Kappa coefficient is 0.8. This result was considered to be well. Although HJ-1A CCD1 data has a lower accuracy than TM data, but comparison from each classifier, maximum likelihood classifier still the best suitable method to this type of remote sensing data. At second scale classification, the maximum likelihood classifier has the best result for HJ-1A CCD1 data with overall accuracy of 85.4% and kappa coefficient of 0.74。
Thirdly, comparison supervised classification method with unsupervised classification method at a certain scale, supervised classification is better than unsupervised classification. Unsupervised classification’ Kappa coefficients of the first scale were between 0 and 0.2, which indicated there was low coincidence degree of the two type images. The second scale classification had negative results, which means classification quality is low.
Finally, compared from visual interpretation and measured data, result quality of the two type images at the second scale were lower than results at first scale that there existed the phenomenon of wrong identifying polygons.
For this experiment, land type information and forest land type extraction results showed that TM data have a good result at large scale and HJ-1A CCD1 data have a good result at small scale. Supervised classification has a higher overall accuracy than non-supervised classification method. In the case of absence of prior knowledge, by input few parameters, unsupervised classification is more suitable for a practical operation. If there is a priori knowledge, analyst can manually select sample area, maximum likelihood classifier for supervised classification method is relatively a kind of better classification method.
Comparision of overall accuracy for the first scale classification system
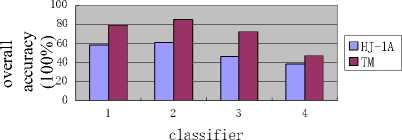
Comparision of overall accuracy for the second scale classification system
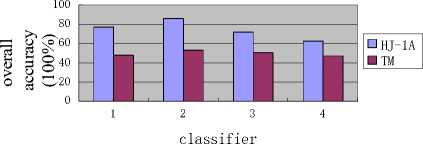
Comparision of Kappa coefficents for the first
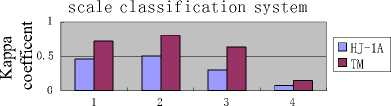
classifier
Comparision of Kappa coefficents for the second scale classification system
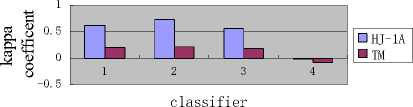
Classifier: 1: Mahalanobis distance classifier 2: Maximum likelihood classifier 3: Minimum distance classifier 4: K-means classifier
Figure 6. Comparison of classification accuracy
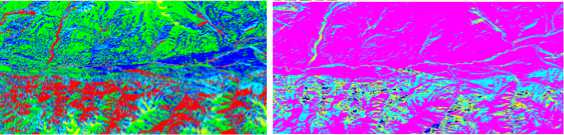
Figure 7. Land use polygons identified by computer automatic algorithm to HJ-1A remote sensing image
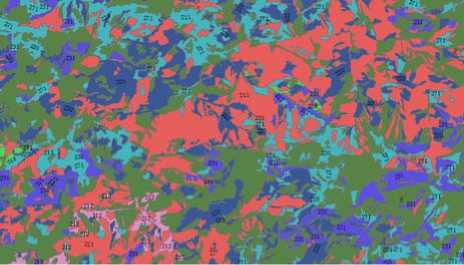
271-waste mountains and lands suitable for afforestation; 220-sparse forest land; 231-national shrubbery; 213-mixed forest; 211-coniferous forest; 212-broadleaf forest; 263-other forest land
Figure 8. Classification resulting map based on knowledge of forest land distribution
D. Classification of HJ-1A for Forestry Land Types Using K-nn Method Basing on Clustering Algorithm
This paper selected clustering algorithm named
ISOCLUSTER and operated non-supervised classification with the predefined class number of seven.
The original K value equaled one and some texture indexes were selected as feature vectors. According with the predefinition and the region-group setup, color patches were
(TABLEV.) shows that the classification could meet the demands of forest application with the overall accuracy of 87.18%.
TABLE V.
Confusion matrix table for testing classification accuracy
merged into land use patches, just as the followed Figure 7:
|
Class ID |
271 |
220 |
231 |
213 |
211 |
212 |
263 |
|
271 |
10 |
1 |
0 |
2 |
0 |
0 |
0 |
|
220 |
1 |
11 |
1 |
0 |
0 |
1 |
0 |
|
231 |
0 |
0 |
17 |
0 |
0 |
0 |
0 |
|
213 |
0 |
1 |
1 |
20 |
2 |
0 |
0 |
|
211 |
0 |
0 |
0 |
0 |
20 |
1 |
1 |
|
212 |
0 |
0 |
0 |
0 |
1 |
9 |
1 |
|
263 |
0 |
0 |
0 |
0 |
1 |
0 |
15 |
Experiment demonstrated that HJ-1A satellite CCD camera data could perform well operation on identifying information of conifer, mixed forest, broadleaf, shrubby, and others. With the supporting of distributing knowledge of those land classes, the accuracy could meet users’ demands. Using advanced K-NN classified method, computer can simulate well with human operation in polygon drawing, which supplies good basic vector patches for the further identification of polygons and class discrimination using HJ-1A satellite CCD camera data. The laws of forest land distribution play an important role in the above procedures.
With little land use information, HJ-1A satellite CCD image was segmented based on color polygons, texture indexes, and distance measurement. In the view of visual judgment, the land use patches could reflect laws of land features distribution and were well conformed to human drawing result. When each forestry land use distribution was documented and mapped based on forest inventory database, the forest categories were interpreted by region grouping and classing to polygons (Figure 8). The confusion matrix
V. Conclusions and Discussions
-
A. Conclusions
By comparing and analyzing land use features at different scales on HJ-1A CCD1 image and TM image with multiple classifiers, some conclusions can be attained:
HJ-1A satellite CCD data have affluent gradations and good readability over mountain area. The geometry correction method using ridge and gorge polylines is suitable for HJ-1A images with low errors in mosaic obvious landmarks. The procedure of this paper was proved to be efficient in interpretation of land use information, which uses spectrum and its texture information as the first step and history inventory database as the auxiliary data for the follow-up steps.
-
B. Discussions
The 6s atmospheric correction model corrected by DEM was a good algorithm to restore HJ-1A CCD1 spectral information, which is suitable for professional application that have high visualization demanding.
This paper also classified HJ-1A CCD1 and TM images using parallelepiped classification algorithm and neural network classification algorithm. However, the two classifiers took a long time, especially neural network algorithm, and both classifiers were unable to identify each surface class at the two scales.
Supervised classification and unsupervised classification base on spectral information, and make land use type discrimination using different gray clustering algorithm. So, both algorithms are difficult to directly make accurate classification results for the reason of error accumulation combined by the algorithms’ limitation and pre-processing operation errors. How to further improve the ability to identify surface features of HJ-1A CCD1 data over non-forest land area, and enhance the accuracy for classification of HJ-1A CCD1 images at small spatial scale to meet the demands of visual interpretation and quantitative analysis is a future work.
References Classification of Forest Land Information Using Environment Satellite (HJ-1) Data
- Wang Qiao, The development and challenge of remote sensing technology in environmental protection area [J]. Environmental Monitoring in China, 2009, 25(4): 53-54.
- Twenty First Century Aerospace Technology Co. Ltd, CBERS-02B image data applied evaluation [EB/OL]. http://www.cresda.com/n16/n1115/n1522/n2149/n9949.files/n11050.pdf 1-2.
- Yi Ling, Wang Xiao, Liu Bin. Researches on HJ-1 satellite image quality and land use classification precision. Remote sensing for land & resources, 2009, (3):74-77.
- Lu Yan, Lu Lixia. Application of HJ-1 multi-spectrum datum in environmental remote sensing evaluation of Liao Dong Island. Liaoning Urban and Rural Environmental Science & Technology. 2009, 29(10):45-47 (in Chinese).
- Zhu Haiyong. Application and evaluation of Moonlet Datum on Environment and Calamity Monitoring Forecast [J]. Arid environmental monitoring, 2010, 24(1): 39-42.
- Yu Xian-chuan, Cao Ting-ting, Yang Chun-ping, et al. Remote sensing image classification based on sparse component analysis [J]. Progress in Geophysics, 2009, 24(6): 2274-2279.
- Fu Qiang, TM image in Forest Resource Inventory Application Research [D]. Nanjing: Nanjing Forest College, 2008.
- Hou Zheng-yang, Study Based on TM Images on Constructive Status Quo of Coastal Shelter System along Sandy Seacoast in Shandong[D].Beijing: Beijing Forest College, 2008.
- Wang Liang, Study on forest landscape assessment and eco-tourism development Guichi of Anhui Province [D]. Hefei: Anhui Agricultural University, 2008.
- Jiang Jin, City environment geology of remote sensing information research of Lijiang city [D], Kunming: Kunming University of Science and Technology, 2008.
- Creation Department, HJ-1-A/B satellite introduction [EB/OL].http://www.cresda.com/n16/n1130/n1582/8384.html, 2009.
- Computer network information center Chinese Academy of sciences. Landsat 4-5 TM bands design [EB/OL]. http://landsat.datamirror.csdb.cn/files/l45tm.jsp.
- RICHARDS J A, JIA X. Remote sensing Digital Image Analysis: An Introduction [M]. Berlin: Springer, 1999.
- STEIN A, MEER F, GORTE B. Spatial Statistics for Remote Sensing [M].New York: Kluwer Academic Publishers, 1999.
- TOTH D, AACH T. Imp roved minimum distance classification with Gaussian outlier detection for industrial inspection [A ]. Italy, 11 th International Conference on Image Analysis and Processing Palermo [C], 2001:584 – 588.
- Zhao Yingshi. The principle and method of analysis of remote sensing application, Beijing: Scientific press, 2008.
- Zhou Zhiyong, Yuan Fang, Liu Haibo. Clustering Based on Clustering-Classification Model [J]. Journal of Guangxi Normal University (Natural science Edition), 2007, 25(2):127-130.
- Ding Kun, Long Xiaomin, Wang Yanxia. Highly accurate geometric correction of satellite images of mountain areas [J].Journal of Remote Sensing, 2010, 14(2):278-282.
- Wu Ruidong. Correcting Satellite Imagery for Topographic Effects [J]. Remote Sensing Information, 2005, (4):31-34.
- Lv Yihe, Fu Bojie. Ecological scale and scaling [J]. Acta Ecological Sinica, 2001, 21(12): 2096-2105.
