Classification of Heart Rate Signals during Meditation using Lyapunov Exponents and Entropy

Author: Ateke Goshvarpour, Atefeh Goshvarpour
Journal: International Journal of Intelligent Systems and Applications(IJISA) @ijisa
Article in issue: 2 vol.4, 2012.
Free access
Meditation is commonly perceived as an alternative medicine method of psychological diseases management tool that assist in alleviating depression and anxiety disorders. The purpose of this study is to evaluate the accuracy of different classifiers on the heart rate signals in a specific psychological state. Two types of heart rate time series (before, and during meditation) of 25 healthy women are collected in the meditation clinic in Mashhad. Nonlinear features such as Lyapunov Exponents and Entropy were extracted. To evaluate performance of the classifiers, the classification accuracies and mean square error (MSE) of the classifiers were examined. Different classifiers were tested and the studies confirmed that for the heart rate signals, Quadratic classifier trained on Lyapunov Exponents and Entropy results in higher classification accuracy. The classification accuracy of the Quadratic classifier is 92.31%. However, the accuracies of Fisher and k-Nearest Neighbor (k-NN) classifiers are encouraging. The classification results demonstrate that the dynamical measures are useful parameters which contain comprehensive information about signals and the Quadratic classifier using nonlinear features can be useful in analyzing the heart rate signals in a specific psychological state.
Classification, Entropy, Heart Rate Variability, Lyapunov Exponents, Meditation
Short address: https://sciup.org/15010098
IDR: 15010098
Text of the scientific article Classification of Heart Rate Signals during Meditation using Lyapunov Exponents and Entropy
Published Online March 2012 in MECS
Meditation, a technique that frees the mind from distractions and allows for communication with the Master Within, can lead to numerous physical, mental and spiritual benefits.
A large number of studies aimed at studying observed effects of meditation and were only able to assess certain general changes of the heart rate signals [1-3]. However, there is no significant effort on classifying biological signals during rest and meditation.
Heart rate classification algorithms can be divided into three steps: pre-processing, feature extraction/ selection, and classification. The techniques developed for heart rate change detection transform the mostly qualitative diagnostic criteria into a more objective quantitative signal feature classification problem [4-6]. For pattern processing problems to be tractable requires the conversion of patterns to features, which are condensed representations of patterns, ideally containing only salient information. Since the dynamics of the cardiac system are chaotic, nonlinear methods have been applied to the analysis of heart rate signals. Two features were used in discrimination of the heart rate signals, i.e., Lyapunov exponents and Entropy. Therefore, the classifiers employing these features were implemented for detection of heart rate signal changes in rest and meditation periods.
In recent years, there has been an increasing interest in applying techniques from the domains of nonlinear analysis and chaos theory in studying the behavior of a dynamical system from an experimental time series such as biological signals [6-8]. The purpose of these studies is to determine whether dynamical measures especially Lyapunov exponents can serve as clinically useful parameters. Estimation of the Lyapunov exponents is more readily interpreted with respect to the presence of chaos. The positive Lyapunov exponents are the hallmark of chaos [8].
A number of different classification algorithms have been proposed in the literature, Maaoui and Pruski [9] for example used Fisher discriminant and SVM to classify emotional states. In this study, four different classification methods are proposed: Fisher classifier, Quadratic classifier, k-Nearest Neighbor (k-NN) and Parzen classifiers.
The outline of this study is as follows. In the next section, we briefly describe the set of heart rate signals (HR) used in our study. Then, the computation of the nonlinear features (Lyapunov exponent and Entropy) of HR signals is explained in order to define the behavior of the signal under study. Next, the description of different classifier models that are considered in this study is presented. Finally, the results of present study are shown and the study is concluded.
-
II. B ACKGROUND
-
A. Data collection
Twenty five subjects took part in the study. Fifteen subjects: eleven meditators (mean age 40.18±7.19, mean meditation experience 5 to 7 years) and four nonmeditators (mean age 25.5±1.91) were asked to do meditation by listening to the guidance of the master. The other ten subjects were asked to do meditation by themselves. They were considered to be at an advanced level of meditation training (mean meditation experience 7 years, mean age 37.8±6.39).
The subjects were in good general health and did not follow any specific heart diseases. The subjects were asked not to eat salty or fat foods before meditation practices or data recording. Informed written consent was obtained from each subject after the experimental procedures had been explained [10].
The experimental procedure was divided into two different stages: Subjects were first instructed to sit quietly for 5 minutes and kept their eyes closed. After that, they performed meditation. Meditation prescribes a certain bodily posture. They sit on a cushion 5 to 10 centimeters thick that is placed on blanket. They cross their legs so that one foot rests on the opposite thigh with the sole of their foot turned up and with their knees touching the blanket (lotus or half-lotus position). The torso should be kept straight, but it should not be strained. The head should be kept high with eyes closed. During this session, the meditators sat quietly, listening to the guidance of the physician and focusing on the breath [10,11].
The electrocardiogram signals (ECG) - lead I- of all subjects were recorded in meditation clinic using 16-channel PowerLab (manufactured by ADInstruments). Heart rate signals were extracted online using Chart5 for Windows software (based on heart rate = 60/RR interval in seconds). The monitoring system hardware filters band passed data in range 0.1-200 Hz for ECG time series. A digital notch filter was applied to the data at 50 Hz to remove any artifacts caused by alternating current line noise. The sampling rate was 400 Hz.
-
B. Feature extraction
The power of features plays an important role in the classification accuracy of a particular classifier applied to the pattern classification problem. For this purpose, nonlinear features, Lyapunov exponents and Entropy, are applied as inputs of the classifiers.
-
1) Lyapunov exponents
Consider two (usually the nearest) neighboring points in phase space at time 0 and at a time t, distances of the points in the i th direction being ||5x i ( 0 )| and ||5x i ( t )| , respectively. The Lyapunov exponent is then defined by the average growth rate λi of the initial distance
5X; (t )| / x
*;' = 2 Xit ( t ^ * )
1 5X1 (t)
^ = lim-log2^-4^ t ^- t 5 x; ( 0 )
An exponential divergence of initially nearby trajectories in phase space coupled with folding of trajectories, ensures that the solutions will remain finite, and is the general mechanism for generating deterministic randomness and unpredictability. Therefore, the existence of a positive λ for almost all initial conditions in a bounded dynamical system is widely used.
To discriminate between chaotic dynamics and periodic signals Lyapunov exponent (λ) is often used. It is a measure of the rate at which the trajectories separate one from other. The trajectories of chaotic signals in phase space follow typical patterns. Closely spaced trajectories converge and diverge exponentially, relative to each other. For dynamical systems, sensitivity to initial conditions is quantified by the Lyapunov exponent (λ). They characterize the average rate of divergence of these neighboring trajectories. A negative exponent implies that the orbits approach a common fixed point. A zero exponent means the orbits maintain their relative positions; they are on a stable attractor. Finally, a positive exponent implies the orbits are on a chaotic attractor [12,13].
-
2) Entropy
There are a number of concepts and analytical techniques directed to quantifying the irregularity of stochastic signals. One such concept is Entropy. Entropy, when considered as a physical concept, is proportional to the logarithm of the number of microstates available to a thermodynamic system, and is thus related to the amount of disorder in the system.
For information theory, Entropy was first defined by Shannon and Weaver in 1949 [14]. In this context,
Entropy describes the irregularity, unpredictability, or complexity characteristics of a signal.
In a simple example, a signal in which sequential values are alternately of one fixed magnitude and then of another fixed magnitude has an entropy value of zero, i.e. the signal is completely regular and totally predictable. A signal in which sequential values are generated by a random number generator has greater complexity and higher entropy.
Entropy is an intuitive parameter in the sense that one can visually distinguish a regular signal from an irregular one. Entropy also has the property that it is independent of absolute scales such as the amplitude or the frequency of the signal: a simple sine wave is perfectly regular whether it is fast or slow.
There are various ways to compute the entropy of a signal. One of them is offered by Shannon [1 5]. Shannon developed a measure to quantity the degree of uncertainty of a probability distribution [15]. Denoting
ShEn as Shannon's Entropy measure, its formal expression in the case of discrete probability distributions is
ShEn = У P i log P i i
where pT = [p 1 , ... , p N ] is a probability distribution (superscript T represents vector/matrix transposition).
-
C. Classification
In this paper, the Lyapunov exponents and Entropy are used as inputs of four different classifiers. The task at hand is to classify the HR epochs of twenty five healthy women as either related to before or to during meditation. The four different classification methods are Fisher classifier, Quadratic classifier, k-NN and Parzen classifiers.
Statistical classifiers fall into two categories; parametric and non-parametric [16]. The linear and Quadratic classifiers are of the parametric type. In this type, the classification rules are based on models of the probability density function of the data. Both Linear and Quadratic classifiers are based on the assumption that classes have multivariate Gaussian distributions.
The k-NN is a nonparametric classification procedure and hence no assumption of the form of the underlying densities is required. This method, however, assumes that there are enough points from each class such that in any small region within the decision space, the number of points occurring in these regions indicates the true nature of each density function.
The description of each classifier models that are considered in this study are presented in the following sections.
-
1) Fisher's discriminant
The terms Fisher's linear discriminant and linear discriminant analysis (LDA) are often used interchangeably, although Fisher's original article [17] actually describes a slightly different discriminant, which does not make some of the assumptions of LDA such as normally distributed classes or equal class covariances.
Suppose two classes of observations have means J-y = 0, Jiy = 1, and covariances Ey = 0, Ey = 1. Then the linear combination of features 5. x will have means 5. J-y=, and variances 5T У 5 for i = 0,1.
Fisher defined the separation between these two distributions to be the ratio of the variance between the classes to the variance within the classes:
^b 2.
between
S = 2
within
( 5 - J i y = 1 - <- . J i y = 0 ) 2
5 T У 5 + 5 T У 5 y = 1 y = 0
( d . ( j y = 1 J y = 0 ))
This measure is, in some sense, a measure of the signal-to-noise ratio for the class labeling. It can be shown that the maximum separation occurs when - fv v - ) (4)
5 У y = 1 + У y = 0 J ( J y = 1 - J y = 0 )
When the assumptions of LDA are satisfied, the above equation is equivalent to LDA.
Be sure to note that the vector 5 is the normal to the discriminant hyperplane. As an example, in a two dimensional problem, the line that best divides the two groups is perpendicular to 5 .
Generally, the data points to be discriminated are projected onto 5 ; then the threshold that best separates the data is chosen from analysis of the one-dimensional distribution.
There is no general rule for the threshold. However, if projections of points from both classes exhibit approximately the same distributions, a good choice would be the hyperplane between projections of the two means, 5 . j y = 0 and 5 . j y = 1 . In this case the parameter c in threshold condition 5 . x < c can be found explicitly: c = 5 . ( j y = 0 + J y = 1)/2 (5)
-
2) Quadratic classifier
A Quadratic classifier is used in machine learning and statistical classification to separate measurements of two or more classes of objects or events by a Quadratic surface. It is a more general version of the linear classifier.
Statistical classification considers a set of vectors of observations x of an object or event, each of which has a known type y. This set is referred to as the training set. The problem is then to determine for a given new observation vector, what the best class should be.
For a quadratic classifier, the correct solution is assumed to be quadratic in the measurements, so y will be decided based on:
-
x Ax + b x + c
In the special case where each observation consists of two measurements, this means that the surfaces separating the classes will be conic sections (i.e. a line, a circle or ellipse, a parabola or a hyperbola).
Quadratic discriminant analysis (QDA) is closely related to LDA, where it is assumed that the measurements from each class are normally distributed. Unlike LDA however, in QDA there is no assumption that the covariance of each of the classes is identical. When the normality assumption is true, the best possible test for the hypothesis that a given measurement is from a given class is the likelihood ratio test.
Suppose there are only two groups, (so y e {0,1}), and the means of each class are defined to be μ y = 0, μ y = 1 and the covariances are defined as Σy = 0, Σy = 1. Then the likelihood ratio will be given by
Likelihoodratio =
2 п У
У ^ у = 1
. / 2 п У
У Z-I у = 0
- -1
I

- М у = 1
I
expl - ~(x - Му=0
т е^ ( х - м у = , ) ) т е ;= о ( ■ - м у = 0 ) )
< t
for some threshold t. After some rearrangement, it can be shown that the resulting separating surface between the classes is a Quadratic. The sample estimates of the mean vector and variance-covariance matrices will substitute the population quantities in this formula.
The nearest neighbor algorithm has some strong consistency results. As the amount of data approaches infinity, the algorithm is guaranteed to yield an error rate no worse than twice the Bayes error rate (the minimum achievable error rate given the distribution of the data) [19].
K-Nearest Neighbor is guaranteed to approach the Bayes error rate, for some value of k (where k increases as a function of the number of data points). Various improvements to k-Nearest Neighbor methods are possible by using proximity graphs [20].
3) K-Nearest Neighbor classifier
In pattern recognition, the k-Nearest Neighbor algorithm (k-NN) is a method for classifying objects based on closest training examples in the feature space. K-NN is a type of instance-based learning, or lazy learning where the function is only approximated locally and all computation is deferred until classification.
The k-Nearest Neighbor algorithm is amongst the simplest of all machine learning algorithms: an object is classified by a majority vote of its neighbors, with the object being assigned to the class most common amongst its k-Nearest Neighbors (k is a positive integer, typically small). If k = 1, then the object is simply assigned to the class of its nearest neighbor.
The same method can be used for regression, by simply assigning the property value for the object to be the average of the values of its k-Nearest Neighbors. It can be useful to weight the contributions of the neighbors, so that the nearer neighbors contribute more to the average than the more distant ones (A common weighting scheme is to give each neighbor a weight of 1/d, where d is the distance to the neighbor. This scheme is a generalization of linear interpolation).
The neighbors are taken from a set of objects for which the correct classification (or, in the case of regression, the value of the property) is known. This can be thought of as the training set for the algorithm, though no explicit training step is required. The k-Nearest Neighbor algorithm is sensitive to the local structure of the data.
Nearest Neighbor rules in effect compute the decision boundary in an implicit manner. It is also possible to compute the decision boundary itself explicitly, and to do so in an efficient manner so that the computational complexity is a function of the boundary complexity [18].
The naive version of the algorithm is easy to implement by computing the distances from the test sample to all stored vectors, but it is computationally intensive, especially when the size of the training set grows. Many nearest neighbor search algorithms have been proposed over the years; these generally seek to reduce the number of distance evaluations actually performed. Using an appropriate nearest neighbor search algorithm makes k-NN computationally tractable even for large data sets.
4) Parzen classifier
The Parzen classifier provides an estimate of the classconditional probability density function (PDF) by, e.g., applying a kernel density estimator to the labeled feature vectors in the training set, while a Gaussian Mixture Model (GMM) classifier estimates class-conditional PDFs using mixtures of multivariate normal PDFs [21].
The Parzen classifier estimates the class densities by the Parzen density estimation and has a built-in optimization for the smoothing parameter.
Parzen-window approach to estimate densities assume that the region Rn is a d-dimensional hypercube. If hn is the length of an edge of that hypercube, then its volume is given by (7).
d (7) ' n nn
An analytic expression for kn can be obtained, the
number of the samples falling in the hypercube, by
defining the following window function:
^ (u) = -
1 h^ 1 i = 1
0 otherwise
d
Thus, ф (и) defines a unit hypercube centered at the origin. It follows that (p((x-x)/hn) is equal to unity if x falls within the hypercube of volume V n centered at x and equal to zero otherwise. The number of samples in this hypercube is therefore given by (9):
i = n / 1 V1 I x - Xi k n = L ^ h i = 1 ^ n
One will have to accept a certain amount of variance in the ratio k/n and a certain amount of
averaging of the density p(x).
Let V n be the volume of R n and p n (x) be the nth
estimate for p(x).
P n ( X ) = kn^
Vn
By substituting kn in equation (10), we obtain the
following estimate: i = n
1 1 I x - Xi I
Pn (x) = -У7Г П "I” I n^Vn I hn I i =1 4 y
This equation suggests a more general approach to estimating density functions [22].
Pn(x) estimates p(x) as an average of functions of x and the samples (x i ) (i = 1,… ,n). These functions ϕ can be general.
-
III. R ESULTS
Features play an important role in classifying systems. Features are selected based on either best representation of a given class of signals or best distinction between classes. High-dimension of feature vectors increased computational complexity and the classifier trained on these feature vectors produced lower accuracy.
In this study, Entropy and maximum Lyapunov Exponents of heart rate signals were calculated. Then the results of analysis of heart rate signals during meditation were compared to before meditation.
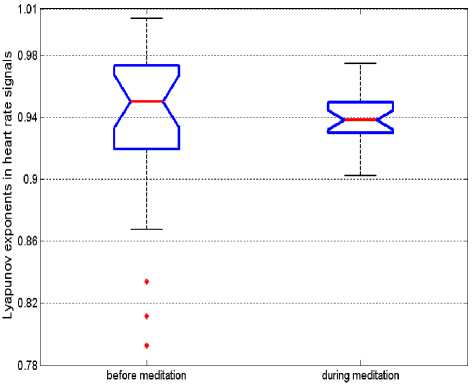
Maximum values of the Lyapunov Exponents are given in Fig.1(a). According to the results, all the Lyapunov Exponents are positive, which confirm the chaotic nature of the heart rate signals recorded before and during meditation. In addition, the average value of the Lyapunov Exponents is about 0.95 before meditation and it is about 0.93 during meditation. The maximum Lyapunov Exponents are decreased during meditation ( p <0.05). It shows that heart rate signals before meditation are more chaotic than that during meditation.
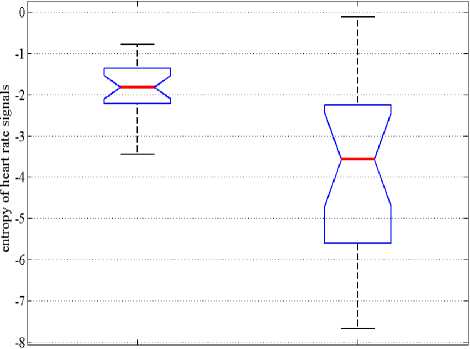
Fig.1(b) depicts the box plot of Entropy of heart rate signals before and during meditation for all subjects. According to Fig.1(b), the average value of Entropy is decreased during meditation ( p <0.05).
Fisher's discriminant, k-NN classifier, Quadratic classifier and Parzen classifier proposed for classification of heart rate signals were implemented by using MATLAB software package (MATLAB with PRTOOLS toolbox).
(a)
xlO7
before meditation during meditation
(b)
Figure 1. Box plot of features of heart rate signals: before meditation and during meditation.
(a) Lyapunov exponents (b) Entropy
The epochs in the data set were randomly divided into two sets: a training set and a testing set. 70% of the epochs are used to train the classifiers while 30% were used to test the performance of each classifier.
The values of classification accuracy, classification error and the central processing unit (CPU) times of training of the four classifiers are presented in Table I.
TABLE I. Classification results.
|
Classifier |
Accuracy (%) |
Error |
Elapsed time(s) |
|
Fisher |
88.46 |
0.0769 |
3.02 |
|
Quadratic |
92.31 |
0.0385 |
5.04 |
|
k-NN |
84.62 |
0.1154 |
2.63 |
|
Parzen |
65.38 |
0.2308 |
3.09 |
The classification results presented in Table I denote that the Quadratic classifier trained on proposed features obtains higher accuracy than that of the others. The total classification accuracy of the Quadratic classifier was 92.31% with 0.0385 classification error. As it can be observed, Fisher and k-Nearest Neighbor classifiers give good results (88.46% and 84.62% respectively).
-
IV. D ISCUSSION
Meditation, a technique that frees the mind from distractions and allows for communication with the Master Within, can lead to numerous physical, mental and spiritual benefits.
This paper presented a new application of classifiers employing nonlinear features, Lyapunov exponents and Entropy, for classification of the heart rate signals during rest and meditation.
Dynamical measures such as Lyapunov exponents and Entropy can serve as clinically useful parameters and contain a significant amount of information about the signal. Therefore, these features are considered in this study.
For all subjects, the Lyapunov Exponents are decreased during meditation, which indicates that signals are less chaotic than that before meditation. This can be due to decreased nonlinear interaction of variables in meditation states and may be related to increased parasympathetic activity and increase of relaxation state.
The lower values of Entropy and positive values of Lyapunov Exponents suggest that all heart rate signals have low dimensional chaos, and the complexity of signals is decreased during meditation. These results were similar to our previous meditation studies [10,11].
Four different classifiers were used to classify two classes of heart rate signals (before and during meditation) when the Lyapunov exponents and Entropy of signals were used as inputs.
The results of the previous section demonstrate that, within the simulation framework and selected training data sets; a large significant difference exists between the performances of classifiers. On the bases of the given simulation results we can say that the Quadratic classifier is more accurate for classifying the patterns of heart rate signals in comparison with the other classifiers (with total classification accuracy of 92.31%.). However, the results from the fisher and k-Nearest Neighbor classifiers are quite encouraging (Table I).
Other studies on heart rate signals have shown similar encouraging results by using the same classifiers. In the study of Maaoui and Pruski [9], Fisher discriminant and SVM method are used and compared for emotional state classification. Their experimental results indicate that the proposed method provides very stable and successful emotional classification performance as 92% over six emotional states.
Malarvili et al [23] applied different classifiers to evaluate their feature selection method. It was found that the k-NN outperformed the other classifiers resulting in a significant reduction in feature dimensionality while achieving high classification performance.
-
V. C ONCLUSION
The results of this research illustrates that in the heart rate signals during meditation, there are features that have explicit difference with rest period features. Although these differences may not be detected by means of simple features, but nonlinear features have far more ability to detect these differences.
The obtained results demonstrate that the Quadratic classifier can be used in classifying the heart rate signals during meditation.
Some future work should also be carried out. For instance, other nonlinear features such as correlation and fractal dimensions can be examined as a classifier inputs. Furthermore, other classification techniques can be used to obtain efficient and accurate results in the future.
A CKNOWLEDGEMENTS
We thank Dr. Minoo Morvarid, the Master of Meditation Clinic in Mashhad, and Ms. Shahla Khoshkholgh for their assistance in collecting the data that were used in the investigations. The authors would also like to thank all the subjects for their good collaborations.
References Classification of Heart Rate Signals during Meditation using Lyapunov Exponents and Entropy
- Cahn B.R., Polich J. (2006). Meditation States and Traits: EEG, ERP, and Neuroimaging Studies. Psychol Bull, 132, 180-211.
- Goshvarpour A., Goshvarpour A., Rahati S. (2011). Analysis of lagged Poincare plots in heart rate signals during meditation, Digital Signal Processing, 21, 208-214.
- Goshvarpour A., Goshvarpour A., Rahati S., Saadatian V., Morvarid M. (2011). Phase space in EEG signals of women referred to meditation clinic. JBiSE, 4, 479-482.
- Guler I., Ubeyli E.D. (2005). An expert system for detection of electrocardiographic changes in patients with partial epilepsy using wavelet-based neural networks, Expert Syst, 22(2), 62–71.
- Sternickel K. (2002). Automatic pattern recognition in ECG time series, Comput Methods Prog Biomed, 68, 109–115.
- Owis M.I., Abou-Zied A.H., Youssef A.-B.M., Kadah Y.M. (2002). Study of features based on nonlinear dynamical modeling in ECG arrhythmia detection and classification, IEEE Trans Biomed Eng, 49(7), 733–736.
- Casaleggio A., Braiotta S. (1997). Estimation of Lyapunov exponents of ECG time series—the influence of parameters, Chaos Solitons Fractals, 8(10), 1591–1599.
- Silipo R., Deco G., Vergassola R., Bartsch H. (1998). Dynamics extraction in multivariate biomedical time series, Biol Cybern, 79, 15–27.
- Maaoui Ch., Pruski A. (2010). Emotion recognition through physiological signals for human-machine communication, Laboratoire d'Automatique humaine et de Sciences Comportementales University of Metz 7 Rue Marconi, 57070 Metz, France. Cutting Edge Robotics. 317-332.
- Goshvarpour A., Rahati S., Saadatian V. (2010). Estimating depth of meditation using electroencephalogram and heart rate signals, [MSc. Thesis] Department of Biomedical Engineering, Islamic Azad University, Mashhad Branch, Iran. [Persian]
- Goshvarpour A., Rahati S., Saadatian V. (2010). Analysis of electroencephalogram and heart rate signals during meditation using Hopfield neural network, [MSc. Thesis] Department of Biomedical Engineering, Islamic Azad University, Mashhad Branch, Iran. [Persian]
- Haykin S., Li X.B. (1995). Detection of signals in chaos, Proc IEEE, 83(1), 95–122.
- Abarbanel H.D.I., Brown R., Kennel M.B. (1991). Lyapunov exponents in chaotic systems: their importance and their evaluation using observed data, Int J Mod Phys B, 5(9),1347–1375.
- Shannon C.E., Weaver W. (1949). The Mathematical Theory of Communication. University of Illinois Press, Chicago, IL, 48-53.
- Shannon C.E. (1948). A mathematical theory of communication. Bell System Technical Journal, 27, 379-423.
- Jain A.K., Duin P.W., Mao J. (2000). Statistical Pattern recognition: A Review, IEEE Transactions on Pattern Analysis and machine Intelligence, 2, 4-37.
- Fisher R.A. (1936). The Use of Multiple Measurements in Taxonomic Problems. Annals of Eugenics, 7(2), 179–188.
- Bremner D., Demaine E., Erickson J., Iacono J., Langerman S., Morin P., Toussaint G. (2005). Outputsensitive algorithms for computing nearest-neighbor decision boundaries. Discrete and Computational Geometry, 33(4), 593–604.
- Cover T.M., Hart P.E. (1967). Nearest neighbor pattern classification. IEEE Transactions on Information Theory, 13(1), 21–27.
- Toussaint G.T. (2005). Geometric proximity graphs for improving nearest neighbor methods in instance-based learning and data mining. International Journal of Computational Geometry and Applications, 15(2), 101–150.
- Allen F.R., Ambikairajah E., Lovell N.H., Celler B.G. (2006) Classification of a known sequence of motions and postures from accelerometry data using adapted Gaussian mixture models. Physiol Meas, 27, 935–951.
- Duda R.O., Hart P.E., Stork D.G. (2000). Pattern Classification. Second edition. John Wiley & Sons, Inc. 1-738
- Malarvili M.B., Mesbah M., Boashash B. (2007). HRV feature selection based on discriminant and redundancy analysis for neonatal seizure detection. IEEE ICICS,1-5.
