Classification of Mammograms into Normal, Benign and Malignant based on Fractal Features

Author: Deepa Sankar, Tessamma Thomas
Journal: International Journal of Image, Graphics and Signal Processing(IJIGSP) @ijigsp
Article in issue: 3 vol.8, 2016.
Free access
Modern life style of women has made them more vulnerable to breast cancer and it is considered as the largest cause of mortality among women. This paper presents a novel method to classify mammograms into normal ones, with benign and malignant microcalcifications, and with malignant and benign tumors using fractal features derived from fractal dimension. Here, three fractal dimension estimation methods such as Differential Box Counting (DBC), Triangular Prism Surface Area (TPSA) and Blanket methods are used for computing the six fractal features utilized for the classification. The new fractal feature f6 obtained using TPSA method is found to be the best with 100% classification accuracy. The average value of f6 is found to be 0.1110, 0.2875, 0.4743, 0.5271 and 0.8558, for normal, benign masses, benign and malignant microcalcifications and malignant masses respectively. The classification performance of the different features was analyzed using the Receiver Operating Characteristics (ROC).
Breast cancer, Benign, Malignant, Masses, Microcalcifications, Fractal dimension, fractal features
Short address: https://sciup.org/15013959
IDR: 15013959
Text of the scientific article Classification of Mammograms into Normal, Benign and Malignant based on Fractal Features
Published Online March 2016 in MECS
-
I. Introduction
Breast cancer is one of the most common cancers occurring worldwide and is the leading cause of cancer death among women. In the United States of America (USA) breast cancer affect one in eight women during their life time and women are more likely to succumb to it than any cancer except lung cancer [1]. It is estimated that there were more than 3.1 million women living in the US with a history of invasive breast cancer as of January 1, 2014, and an additional 232,670 women will be newly diagnosed in 2014 [2]. A study conducted by the International Association of Cancer Research, based in Lyon, France, projected that there would be 2,50,000 cases of breast cancer in India by 2015, a 3% increase per year [3]. But, if the disease is detected and treated at an early stage, the survival rate can be increased substantially.
Most types of cancer cells eventually accumulate to form a lump or mass called a tumor, and are named after the part of the body where the tumor originates. Majority of the masses are benign; that is, they are not cancerous, do not grow uncontrollably or spread, and are not lifethreatening [2].
There are different imaging modalities currently available for the detection of breast cancer. X-ray mammography is the most efficient and reliable imaging technique for diagnosis at an early stage. Analysis of mammograms is an extremely complex and cumbersome task, which demands high expertise for radiologists. While screening, the volume of normal mammograms will be higher compared to the abnormal ones. So, the possibility of identifying cancerous mammograms decreases during the screening process. Therefore, in order to enhance the quality of interpretation, usually dual readings are carried out by two radiologists and lessen the probability of misdiagnosis. [4], [5].
On account of these reasons, several computer aided diagnostic (CAD) systems based on advanced image processing and pattern recognition techniques are developed to locate and classify the possible lesions. These CAD systems can provide a “second opinion” to the radiologist during diagnosis and prevent misinterpretation.
Microcalcifications are tiny calcium deposits that occur in the breast tissue. These are considered to be early indication of breast cancer. Also, microcalcifications are very small in size ranging from 0.1-1.0mm and the average diameter is about 0.3mm. They usually appear in an inhomogeneous background, which may be brighter than the calcifications in the case of dense breasts [6]. Benign calcifications are typically larger, coarser, round with smooth margins and have a scattered or diffused distribution. Malignant calcifications are typically grouped or clustered, pleomorphic, fine with linear branching [7]. Breast tumors and masses usually appear in the form of dense regions in mammograms. Benign masses generally possess smooth, round and well circumscribed boundaries, while the malignant tumors are usually having spiculated, rough and blurry boundaries.
Also, there is only slight texture difference observed between benign masses and malignant tumors [8].
Different image processing techniques have been proposed to help radiologists in avoiding misinterpretations during the analysis of mammograms [9-12].
More techniques are developed to improve the classification performance of different types of mammograms by incorporating different textural features derived from radiological characteristics in the analysis of breast masses. Oktem and Jouny used two classifiers namely two stage back propagation neural network and self-organizing map in conjunction with fractal analysis and spatial moment distributions to distinguish between benign and malignant mammograms in [13]. Guo et al [14] has also explored the use of fractal and lacunarity analysis for the characterization and classification of both tumor lesions and normal breast parenchyma.
Mandelbrot in 1982 has pioneered the use of fractals to describe objects that possess self similarity at all scales and levels of magnification [15]. Fractal objects have irregular shapes and complex structures that cannot be represented adequately by the traditional Euclidian dimension. For an object with topological dimension DT, its fractal dimension falls between DT and DT+1. Fractal dimension (FD) assigns non integer dimension values to objects that do not suit the traditional Euclidean space of objects. The fractal dimension has been used in image classification to measure surface roughness where different natural scenes, such as mountains, clouds, trees, and deserts, generate different fractal dimensions.
It is observed that microcalcifications and masses are visible as objects which appear to be added to the mammographic breast background. Some of them are bright, some are faint. But compared with breast background tissue, they have less structure. The mammographic parenchymal and ductal patterns in mammograms possess structures with high local selfsimilarity which is the basic property of fractal objects. As shown in [6] fractal method can be applied effectively for the modeling of mammograms. In [16] the background structures in mammograms were modeled using fractal methods and the microcalcification present in the mammograms were detected/enhanced by subtracting the modeled mammogram from the original one having microcalcification. Therefore fractal method can be applied effectively for the classification of different kinds of breast tissue.
Normal mammograms usually have a regular structure. But the complexity increases in cancerous ones due to the presence of the abnormal tissues.
-
II. M ATERIALS A ND M ETHODS
The simplest method to compute fractal dimension is the box counting method, which is based on the concept of self-similarity. The box counting method was modified and made suitable to be applied to gray level images by Sarkar and Chaudhuri in [17]. The second method to measure fractal dimension used in this paper is the
Triangular Prism Surface Area (TPSA) method proposed by Clarke [18]. Peleg et al [19] used the blanket method approach of measuring fractal dimension, in which, an image can be viewed as a hilly terrain surface whose height from the normal ground is proportional to the image gray value.
-
III. Fractal Features
The main problem with the fractal dimension approach is that fractal dimension cannot uniquely characterize the texture pattern. Different textures may have the same fractal dimension. This may be due to combined differences in coarseness and directionality i.e. dominant orientation and degree of anisotropy. Therefore, to improve the classification performance, five features utilized in [21] and a new feature; based on fractal dimension were used in this paper. They are the FD of the original image, high gray valued image, low gray valued image, horizontally smoothed image and vertically smoothed image. The new fractal feature was derived from the average of four pixels of the image.
-
A. Feature1 (f1)
The FD of the original image is computed on overlapping windows of size ( 2W + 1 )x( 2 W + 1 ) . Thus, at point ( i , j ) the first feature value F ( i , j ) is defined as
F ( i , j ) = FD { 1 1 ( i + l , j + k ); — W < , k < W } (1)
where FD is fractal dimension computed using any of the methods described in section 2. Since the fractal dimension is greater than the topological dimension, the value of F is between 2 and 3. The normalized feature is defined as f = F ( i , j ) — 2, such that
0 < f < 1 .Thus all the normalized fractal features have values between 0 and 1.
-
B. Features 2 and 3( f and f )
The two modified images called high and low grayvalued images I , and I , respectively are defined as:
I (z ) = / 1 1 ( i , j ) — L 1 ,if 1 1 ( i , j ) > L 1
-
2 , J | 0 otherwise
1 3 ( i , j ) =
Г255 — L 2, if f (i , j ) > ( 255 — L 2)
[ f (i , j ) otherwise
where
L 1 = g min + av 2; (4a)
L 2 = g max — av! 2 ; (4b)
with g g and av denoting the maximum, max , min minimum and average gray value in the original image I , respectively. If two images I and J have a same fractal dimension, their high gray-valued images I and J may not have an identical roughness and so their FDs would be different. The same holds for I and J . The normalized fractal features f and f are computed from I and I similar to the computation of f from I .
-
c. f eatures 4 and 5( f 4 and f 5 )
Roughness of an image is directly related to its fractal dimension and therefore its value will be reduced by gray value smoothening. If the texture is smoothed along the direction of its dominant orientation the FD will be affected least for a highly oriented texture. But when the smoothing direction is perpendicular, the FD will be considerably reduced. A texture having a low degree of anisotropy will show an identical effect on the FD, irrespective of the smoothing direction.
Images can be smoothed in the horizontal and vertical direction as:
W
I 4 ( i , J ) = 2jr । i 2 I ( i , j + k ) (5)
2W + 1 k =- W
W
-
1 5 ( • j * -V 2 1(1 + k . J ) (6)
-
2W + 1 k -- W
The normalized FD features f and f are computed similar to that of f .
-
D. Feature 6 ( f )
A new fractal feature is derived from the smoothened image obtained by computing the average of four neighboring pixels. The new image is given by:
-
1 6 ( i • J ) = 1 22 1 ( i • J ) (7)
-
4 i - 1 j - 1
The fractal feature f is calculated similar to the previous cases. The use of different fractal features for mammogram analysis was explored in [22].
The mammograms used for this research are obtained from the Mammographic Image Analysis Society (MIAS) Digital Mammogram online Database [23]. The size of all images is 1024 × 1024 with a resolution of 50microns per pixel. Each pixel is represented using 8 bits with 256 gray levels. According to [24], the subtlety of the mammograms is given a rating 1 to 5. A subtlety rating of 1 indicates that tumor is difficult to recognize while a subtlety of 5 indicates that it is obvious. The mammograms in the database are found to be with ratings 1, 2 and 3 which show that the lesions are detectable by an expert mammographer, likely to be detected by an expert and likely to be detected by an observer with good mammographic training respectively.
-
IV. Results And Discussions
110 normal mammograms and the available 39 malignant and 54 benign masses, and 28 mammograms with microcalcifications (13 benign and 15 malignant) from the MIAS database, thus a total of 231 mammograms were used for this study. Different Regions of Interest (ROI) viz. 64 x 64. 128 x 128. 256 x 256. were chosen from the mammogram, depending on the radius of the cancerous region present in the image. In the normal mammograms these regions of interest were chosen arbitrarily. Sample of ROI of different classes of mammograms viz. mammogram with malignant and benign mass, malignant and benign microcalcifications and normal. of size 64 x 64 are given in fig. 1
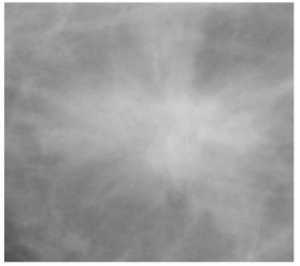
Fig. 1a
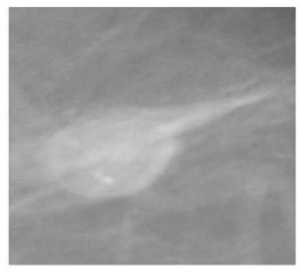
Fig. 1b
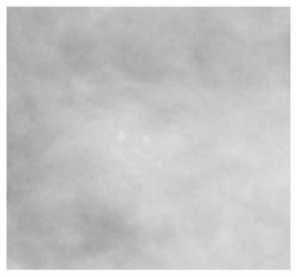
Fig. 1c
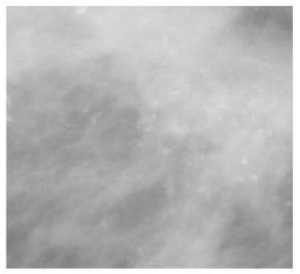
Fig. 1d
Fig.1e
Fig.1. (a)-(e) . Different classes of mammograms (a) Mammogram with Malignant mass (b) Mammogram with Benign Mass (c) Mammogram with Benign microcalcifications (d) Mammogram with Malignant microcalcifications (e) Normal mammogram
The fractal dimensions of the images were calculated using the Triangular Prism Surface Area method (TPSA), Differential Box Counting (DBC) method and the blanket method. In the TPSA method [18] and the DBC methods [17] an overlapping grid size of 1 to M (for an ROI of M x M) were considered. For the blanket method [19], blanket size ε was varied from 0 to 20.The results obtained are given in table 1.
The presence of breast cancer increases the irregularity in the breast tissue. As normal mammograms have a homogeneous structure when compared to the diseased ones, its fractal dimension (FD) should be less. In all the three FD computation methods, the FD of the normal mammograms was found to be the least. The next higher FD was for the benign masses.
When microcalcifications are present in the mammograms, the irregularity again increases and so does the FD. The malignant tumors have the highest irregularity in their structure so they should have the highest fractal dimension. In the TPSA method, the range of FD values of masses and microcalcifications were overlapping, so these categories cannot be correctly classified. While the ranges of these values for all the classes were found to overlap with the adjacent classes in the DBC and blanket methods of fractal dimension computation.
The classification accuracy is the ratio of the number mammograms which are correctly classified to the total number of mammograms considered; both normal and cancerous. In the TPSA method, the ranges of individual FD values were not overlapping for normal and benign and malignant masses. Therefore it was possible to correctly classify these categories with 100% accuracy. But the range of FD values for benign and malignant microcalcifications were overlapping with the other categories and only 3 benign and 2 malignant microcalcifications were correctly classified. Thus the overall classification accuracy becomes 208/231=90.04%. In the DBC method, the range of FD for normal mammograms (2.01-2.362) was falling within the range of benign masses (2.067-2.397). Also, the ranges of benign and malignant microcalcifications were found to be 2.08 - 2.193 and 2.116 - 2.215 respectively, which were also coming under other classes. Only 6 malignant masses were classified correctly using DBCM. Thus a mere classification accuracy of 2.59% was obtained. Similar was the case with blanket method. Here also only 6 malignant masses could be accurately classified and the classification accuracy obtained was again 2.59%.
In the TPSA method, four experimental points, as in ref. [18], are considered at a time, forming a quadruple. This quadruple are covered by four triangles with mean elevation of four vertices as the common central point. When smaller triangular tiles are considered, they are not in simple relation with the cross section of the base of the prism, but also depend on the properties of the surface itself. Thus TPSA method can provide an accurate measurement of fractal dimension compared to the DBCM and blanket method. The latter two methods are similar, with the difference of the gray level surface is been considered for computing the fractal dimension.
It was found in [25] that, the FD obtained using the TPSA method classified mammograms into normal, benign and malignant masses and with microcalcifications, but with fewer numbers of mammograms (10 numbers each). The fractal dimension values obtained by DBC and blanket method for the different classes of mammograms were overlapping with the other classes. In the TPSA method, the malignant and benign calcifications values were overlapping and therefore those classes could not be distinguished. Therefore the six fractal features, f1 - f6 described in section 3 were calculated and were found to provide better classification accuracy for the three methods.
The new fractal feature f 6 was developed from the average of four pixels as mentioned in (7).
Four pixels in the image were replaced with a single pixel. Thus the size of the image will be reduced by 4 (i.e. M×M image is reduced to M/2×M/2). The difference between the minimum and maximum gray levels is reduced which in turn reduces the variance of the gray levels in the prism, so when the area of the triangles formed from the prism is calculated in the TPSA method
Table 1. Comparison of the fractal dimensions obtained by TPSA, DBC and Blanket method
|
Mammo grams |
Fractal Dimension Computed Using |
|||||||||
|
TPSA Method |
DBC Method |
Blanket Method |
||||||||
|
Mean |
Std Dev |
Range of values |
Mean |
Std Dev |
Range of values |
Mean |
Std Dev |
Range of values |
||
|
Normal |
2.1177 |
0.0961 |
2.027 2.176 |
2.1214 |
0.0697 |
2.01 2.362 |
2.1920 |
0.1136 |
2.0201 2.3641 |
|
|
Masses |
Benign |
2.3269 |
0.0926 |
2.179 2.476 |
2.1972 |
0.0799 |
2.067 2.397 |
2.235 |
0.1187 |
2.0752 2.487 |
|
Malignant |
2.7783 |
0.0679 |
2.713 2.986 |
2.3394 |
0.128 |
2.129 2.635 |
2.4923 |
0.1765 |
2.1426 2.6995 |
|
|
Microcal cifications |
Benign |
2.6005 |
0.0634 |
2.482 2.688 |
2.1529 |
0.0405 |
2.08 2.193 |
2.552 |
0.1120 |
2.3563 2.5798 |
|
Malignant |
2.6075 |
0.0663 |
2.502 2.764 |
2.172 |
0.0439 |
2.116 2.215 |
2.3902 |
0.1506 |
2.1125 2.5777 |
|
|
Classification Accuracy % |
90.04 |
2.59 |
2.59 |
|||||||
which is used for evaluating f 6 , the area will be reduced. This means that the spread of the area will be reduced while considering regions of mammogram containing normal and cancerous tissues.
Thus, when the feature f6 is calculated, the overlap between the values for the different categories can be avoided. This was the difficulty with all the fractal features from f 1 to f 6 (overlapping of feature values among the different categories). So when regions containing normal and cancerous tissue are considered, the spread of the gray levels is reduced and hence when the feature f 6 value is calculated, it will not overlap with the values in the normal category. It was found that, rather than finding the difference between the minimum and maximum gray level, in the DBC[17] method, and finding the volume of the blanket in the blanket method [19], the area of the triangles formed by the height difference in the gray levels gave better classification accuracy than the other two methods. This feature could classify the different types of mammograms more effectively and efficiently as shown in table 2.
The results show that, for the mammograms used in the study, there was a large separation between the f6 values of different classes obtained by TPSA method, and 100% classification was possible. For DBC method the individual values are overlapping, but the mean values are different for different class of mammograms. 58 normal and 3 benign microcalcifications were classified correctly giving a percentage accuracy of 26.4%. In the blanket method 47 normal and 2 benign microcalcifications were distinguished and the percentage accuracy becomes 21.2%. Thus it was found that fractal feature f6 obtained by the TPSA method is the best feature for classifying the different classes of mammograms. But the range of f6 between benign and malignant microcalcifications was less and so other feature may be added for better estimation if needed.
Statistical analysis
In order to evaluate and compare the discriminative power of these fractal features, in distinguishing abnormality from normal breast parenchyma, Receiver Operating Characteristic (ROC) analysis [26-29] was conducted. A ROC curve is a plot of the true positive rate (sensitivity) against the false positive rate (1-specificity). The Area Under the Curve (AUC) can be used to compare the performance of the features. Comparison of the ROC curves for the fractal dimension obtained in the three methods is shown in figure 2.
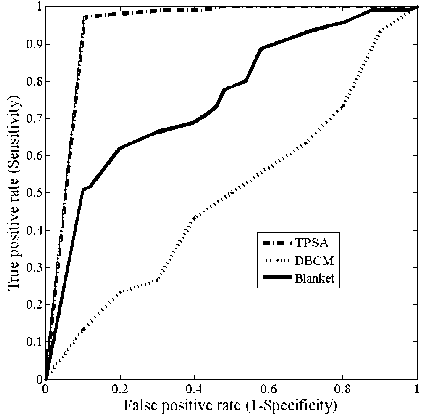
Fig.2. ROC curves of Fractal dimension obtained using TPSA, DBCM and Blanket method respectively.
Table 2. Comparison of the fractal feature f 6 obtained using TPSA, DBC and Blanket Methods
|
Mammo grams |
Fractal feature f 6 computed using |
|||||||||
|
TPSA |
DBC |
Blanket |
||||||||
|
Range of values |
Mean |
Std Dev |
Range of values |
Mean |
Std Dev |
Range of values |
Mean |
Std Dev |
||
|
Normal |
0.0370.139 |
0.111 |
0.0821 |
0.00.388 |
0.1537 |
0.0938 |
0.0508 0.3646 |
0.1773 |
0.1232 |
|
|
Masses |
Benign |
0.219 0.375 |
0.2875 |
0.0770 |
0.204 0.408 |
0.3161 |
0.0456 |
0.1029 0.4471 |
0.2078 |
0.1036 |
|
Malignant |
0.7130.986 |
0.8558 |
0.071 |
0.20400.367 |
0.2991 |
0.0473 |
0.126 0.5258 |
0.0777 |
0.6612 |
|
|
Microcalcif ications |
Benign |
0.409 0.514 |
0.4743 |
0.0751 |
0.31 0.591 |
0.4838 |
0.0857 |
0.1603 0.5778 |
0.2930 |
0.1731 |
|
Malignant |
0.522 0.602 |
0.5271 |
0.0566 |
0.345 0.539 |
0.4636 |
0.0982 |
0.1678 0.2918 |
0.2311 |
0.0616 |
|
|
Classification Accuracy % |
100% |
26.4 |
21.2 |
|||||||
The ROC curves obtained for the different fractal features using the three different methods are shown in figs.3 (a)-(f)
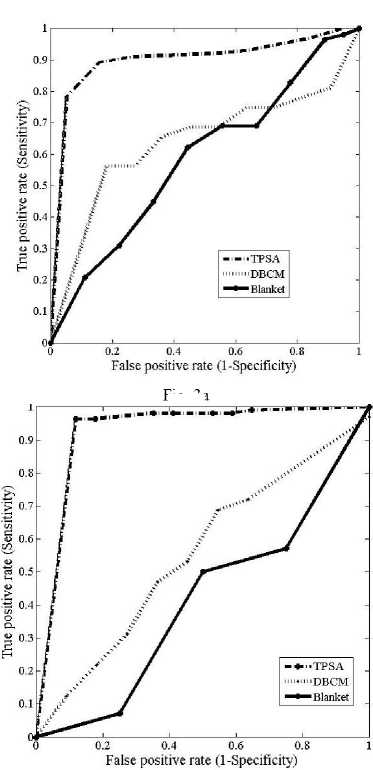
Fig. 3a
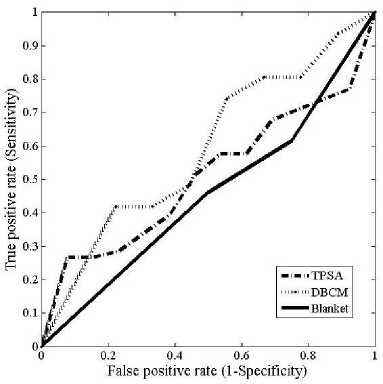
Fig. 3c
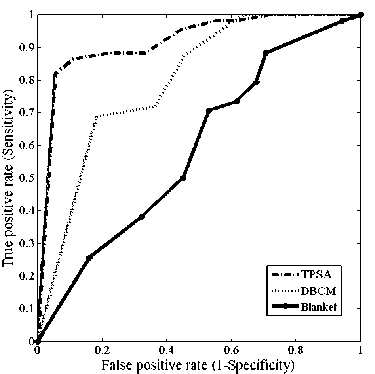
Fig. 3d
Fig. 3b
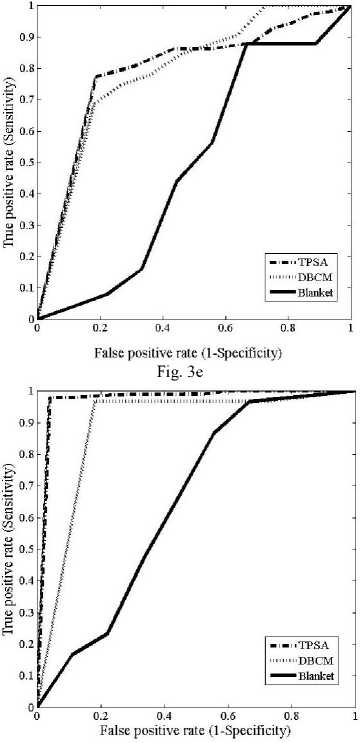
Fig. 3f
Fig.3. Comparison of ROC curves obtained for the different fractal features (a) ROC curves for fractal feature f 1 (b) ROC curves for fractal feature f 2 (c) ROC curves for fractal feature f 3 (d) ROC curves for fractal feature f 4 ( e) ROC curves for fractal feature f 5 (f) ROC curves for fractal feature f 6
The Area under the ROC curve (AUC), standard error (SE) and 95% confidence interval for the FD and different fractal features computed using TPSA, DBCM and Blanket methods are shown in table 3.
The values of z statistics obtained between TPSA and DBC methods in computing fractal dimension was 6.014, while that between TPSA and DBC was 4.318. Between DBCM and blanket the z statistics was 0.778.The area under the curve (AUC) is the minimum for the blanket method for all the features. For feature f1, the DBC and blanket method had a tendency to misclassify with a lesser amount of Area under the ROC curves (AUC). Due to the differential nature between the minimum and maximum gray levels, DBC method, gave a better classification than blanket method. With feature f2, the blanket method had the lowest AUC and cannot classify the different mammograms. It is again observed that TPSA was more suitable than the other two methods. The feature images obtained for estimating f3 did not contain any information regarding the type of mammogram since there was less variation in the gray level intensity.6. The AUC for feature f3 was found to be less than 0.5 which is an indication of a poor classifier. Therefore the classification accuracy of this feature using different FD estimation methods was also poor. The highest AUC was obtained for the blanket method, 0.829 and the lowest was for DBCM 0.598. TPSA gave an intermediate AUC of 0.604 with feature f3.The 95% confidence intervals for these methods are [0.517, 0.687], [0.438, 0.744] and [0.674, 0.93] respectively.
The z statistics obtained between the TPSA and DBCM, TPSA and blanket and DBCM and Blanket methods with feature f4were 1.345, 3.411,-2.5 respectively. With feature f5, the AUCs were less compared to the other features for TPSA method. 0.86, 0.866 and 0.524 were the values obtained with TPSA, DBCM and blanket methods. For feature f 5 , 95% confidence interval of 0.787 to 0.916 was obtained with TPSA and 0.728 to 0.951 was obtained with DBCM. The blanket method had this interval in the range [0.347, 0.698].
The new fractal feature f 6 obtained using the TPSA method gave the highest classification accuracy of 100% as shown in table 3 . The TPSA method had an AUC of 0.987 with a confidence interval of the mean to be [0.936, 0.995]. For DBCM, these values were 0.973 and 0.871 to 0.999 respectively. AUC of 0.678 with a 95% CI was obtained for the blanket method. The z statistics between TPSA and DBCM, TPSA and Blanket and DBCM and blanket methods were obtained to be 0.148, 2.421 and 2.351 respectively. The ROC also indicates that the feature f 6 computed from the TPSA method is best compared to the other two methods. As seen from the figure, (ROC) the AUC was also the maximum for this method. The blanket method again fails with the least AUC. But f6 obtained from the blanket method was having a better classification accuracy than the other features computed using this method.
-
V. Conclusions
This paper presents a novel method to classify mammograms, into normal, benign and malignant masses, microcalcifications; benign and malignant based on the different fractal features which are derived from the fractal dimensions. These fractal features are based on the fractal dimension calculated using three methods, viz. Triangular Prism Surface Area (TPSA) method, Differential Box Counting (DBC) method and blanket method. Of the three methods, TPSA method gave 100% classification accuracy with fractal feature f6. Malignant masses gave the highest f6 value in the range 0.713-0.986 and the least feature values of 0.037 - 0.139 were obtained for the normal mammograms as expected. 0.219 - 0.375 is the range of f6 values obtained for the benign masses while the range of benign and malignant microcalcifications is obtained are 0.409 - 0.514 and 0.522 - 0.602 respectively. Only for these two classes: benign and malignant microcalcification, the range of values are less but for other classes there is sufficient variation in feature values. The classification performances of these features were compared using Receiver Operating Characteristics (ROC) analysis
Table 3. Statistical Analysis of the different fractal dimension and fractal features estimated using TPSA, DBC and Blanket methods
|
Method |
Para meters |
FD |
Fractal features |
|||||
|
f 1 |
f 2 |
f 3 |
f 4 |
f 5 |
f 6 |
|||
|
TPSA |
AUC |
0.98 |
0.9656 |
0.9858 |
0.5314 |
0.945 |
0.86 |
0.987 |
|
SE |
0.0070 |
0.0228 |
0.0088 |
0.0835 |
0.0197 |
0.0382 |
0.0101 |
|
|
95% CI |
0.9570.99 |
0.9213-1.00 |
0.9686 1.00 |
0.3679.695 |
0.9062 0.9837 |
0.785 0.935 |
0.9953-9989 |
|
|
DBCM |
AUC |
0.5267 |
0.7046 |
0.5468 |
0.656 |
0.8665 |
0.866 |
0.973 |
|
SE |
0.1056 |
0.0849 |
0.999 |
0.979 |
0.0553 |
0.0548 |
0.0224 |
|
|
95% CI |
0.3197 0.7337 |
0.538-0.871 |
0.351 0.743 |
0.464 0.8478 |
0.7582 0.9748 |
0.7280.951 |
0.9290 -0.99 |
|
|
Blanket |
AUC |
0.7781 |
0.636 |
0.5 |
0.4615 |
0.547 |
0.533 |
0.6778 |
|
SE |
0.0359 |
0.1014 |
0.1682 |
0.1714 |
0.115 |
0.1124 |
0.0956 |
|
|
95% CI |
0.70778485 |
0.43740.835 |
0.17040.829 |
0.12560.797 |
0.367 0.717 |
0.313 0.754 |
0.4904-0.865 |
|
shows that f6 has the highest Area Under ROC curve (AUC) of 0.99 and was able to discriminate between different classes of mammograms efficiently. Thus, fractal feature f6 computed using TPSA method is found to be an effective and promising way to distinguish different types of digital mammograms.
Regular screening with mammograms has been made compulsory in many European countries for women above 40 years old. So radiologists are struggling hard to differentiate normal mammograms and ones with potential breast cancer. In this scenario, radiologists are looking for a more accurate and efficient diagnostic method for detecting cancer cells at an early stage. This study demonstrates a new technique for the efficient classification of mammograms using fractal features.
References Classification of Mammograms into Normal, Benign and Malignant based on Fractal Features
- http://www.nlm.nih.gov/medlineplus/breastcancer.html (Accessed on 15 July 2015)
- Cancer Treatment & Survivorship Facts & Figures 2014-2015. http://www.cancer.org /acs/groups/content/@epidemiologysurveilnce/documents/document/acspc-033876.pdf (Accessed on 15 July May 2015)
- http://www.ncbi.nlm.nih.gov/pmc/articles/PMC2464467/ (Accessed on 15 July 2015)
- E. L. Thurfjell, K. A. Lernevall and A. A. Taube, "Benefit of independent double reading in a Population-based mammography screening program", Radiology, 191: 241–244, 1994
- Ton M Tonita, Joanne P Hillis and Chong-Ha Lim, "Medical Radiologic Technologist Review: Effects on a population based Breast cancer screening program", Radiology, 211: 529-533, 1999
- H. Li, K.J. Liu, and S.C. Lo, "Fractal Modeling and Segmentation for the Enhancement of Microcalcifications in Digital Mammograms", IEEE Trans. on Med Imaging, 16(6):785-798, 1997
- Muttarak M, Konmebhol P and Sukhamwang N, "Breast Calcifications: which are malignant?", Singapore Med Journal, 50(9): 907-914, 2009
- Tingting Mu, Asoke K. Nandi and Rangaraj M. Rangayyan, "Classification of Breast Masses Using Selected Shape, Edge-sharpness and Texture Features with Linear and Kernel-based Classifiers", J of Digital Imaging, 21( 2):153-169, 2008
- William Mark Morrow, Raman Bhalachandra Paranjape, Rangaraj M. Rangayyan and Joseph Edward Leo Desautels, "Region-Based Contrast Enhancement of Mammograms", IEEE Trans on Med Imaging, 11( 3):392-406, 1992
- R. Ramani , N.Suthanthira Vanitha , S. Valarmathy "The Pre-Processing Techniques for Breast Cancer Detection in Mammography Images", I.J. Image, Graphics and Signal Processing, 2013, 5, 47-54.
- Robin N. Strickland and Hee II Hahn, "Wavelet Transforms for Detecting Microcalcifications in Mammograms", IEEE Trans. on Med. Imaging, 15( 2): 218-229, 1996
- Bhagwati Charan Patel , G. R. Sinha ,"Energy and Region based Detection and Segmentation of Breast Cancer Mammographic Images",I.J. Image, Graphics and Signal Processing, 2012, 6, 44-51
- V. Oktem and I. Jouny, "Automatic Detection of Malignant Tumors in Mammograms", Proc. of the 26th Annual Int. Conf. of the IEEE EMBS, San Francisco CA,USA, 1770-1773, 2004
- Qi Guo, Jiaqing Shao and Virginie F. Ruiz, "Characterization and Classification of tumor lesions using computerized fractal-based texture analysis and support vector machines in digital mammograms", Intl J. of Computer Assisted Radiology and Surgery, 4:11–25, 2009.
- Mandelbrot B B, "The Fractal Geometry of Nature", Freeman San Francisco CA, 1982
- Deepa Sankar and Tessamma Thomas, "A New Fast Fractal Modeling Approach for the Detection of Microcalcifications in Mammograms", J. of Digital Imaging, Springer, New York, 23(5): 538-546, 2010
- Nirupam Sarkar and B. B. Chaudhuri, " An Efficient Differential Box-Counting Approach to Compute Fractal Dimension of Image", IEEE Trans. on Systems, Man and Cybernetics, 24(1): 115-120, 1994
- Keith C.Clarke, "Computation of the fractal dimension of topographic surfaces using the triangular prism surface area method", Computers & Geosciences, 12(5): 713-722, 1986
- S.Peleg, Joseph Naor, Ralph Hartley and David Avnir, "Multiple Resolution Texture Analysis and Classification", IEEE Trans. on Pat. Analy and Mach. Intelligence, 6(4):518-523, 1984
- Yu Tao, Ernest C. M. Lam and Yuan Y. Tang, "Extraction of Fractal Feature for Pattern Recognition", Proc of IEEE Int'l Conf. on Pattern Recognition, 2: 527-530,2000
- B. B Chaudhuri and Nirupam Sarkar, " Texture Segmentation Using Fractal Dimension", IEEE Trans on Pat. Analy. and Machine Intelligence, 17(1): 72- 77, 1995
- Deepa Sankar and Tessamma Thomas, "Fractal Features based on Differential Box Counting Method for the Categorization of Digital Mammograms", Intl J of Computer Information Systems and Industrial Management (IJCISIM), 2: pp.011-019, 2010 ISSN: 2150-7988
- J Suckling et al: The Mammographic Image Analysis Society Digital Mammogram Database Exerpta Medica. International Congress Series 1069 ,375-78,1994
- Pisano Etta D , Breast Imaging, IOS Press,1998
- Deepa Sankar and Tessamma Thomas, "Fractal Dimension for the Description of Digital Mammograms using Triangular Prism Surface Area Method", Proc. of the AMSE Intl Conf. on Modeling and Simulation (MS 09) Trivandrum, India, pp-197-200, 2009.
- Wendy L. Martinez and Angel R. Martinez, "Computational Statistics Handbook with Matlab", 2nd ed. ,Taylor and Francis Group, New York, 2008
- Tom Fawcett, "An Introduction to ROC Analysis, Pattern Recognition Letters", Elsevier, 27:861-674, 2006.
- James A Hanely and Barbara J McNeil , "The meaning and Use of the Area Under a receiver Operating Characteristics (ROC) Curve", Radiology, 143:29-36, 1982
- Nancy A Obuchowski, "Fundamentals of Clinical research for Radiologists", Amer. Roentgen Ray Soc., 184:364-372, 2005.
