Classification of SAR Images Based on Entropy

Author: Debabrata Samanta, Goutam Sanyal
Journal: International Journal of Information Technology and Computer Science(IJITCS) @ijitcs
Article in issue: 12 Vol. 4, 2012.
Free access
SAR image classification is the progression of separating or grouping an image into different parts. The good feat of recognition algorithms based on the quality of classified image. The good recital of recognition algorithms depend on the quality of classified image. The proposed classification method is hierarchical: classes which are difficult to distinguish are grouped.An important problem in SAR image application is accurate classification. In this paper, we developed a new methodology of SAR image Classification by Entropy. The severance between different groups or classes is based on logistic and multi-nominal regression, which finds the best combination of features to make the separation and at the same time perform a feature selection depending on Grouped –Entropy value.
Entropy, SAR Image, Multi-Nominal Region, Grouped–Entropy value
Short address: https://sciup.org/15011795
IDR: 15011795
Text of the scientific article Classification of SAR Images Based on Entropy
Published Online November 2012 in MECS DOI: 10.5815/ijitcs.2012.12.09
This critique presents a novel methodology for supervised classification of SAR images. The method was applied to a project on compassionate demining. Synthetic Aperture Radar (SAR) is a space borne radar which gains a “photograph” of the ground below using transmission and reception of electromagnetic energy. A SAR system fabricates a two-dimensional image of the electromagnetic scatters within a scene wherein each pixel in the image has corresponding assortment and cross-range values. SAR images are that the quality of image does not depend on specification or light conditions and images can be taken at any part of the day and in any specification. The major applications of SAR imaging is in military surveillance for the recognition of military (geometrically region) targets.
In this paper, we developed a new methodology of SAR image Classification by Entropy. The severance between different groups or classes is based on logistic and multi-nominal regression, which finds the best combination of features to make the separation and at the same time perform a feature selection depending on Grouped –Entropy value.
-
II. Related Work
The problem related to extract the different classes of SAR images is depending on the intensity correlation. There are many scholastic researches, who have paved their ways for SAR images classification. Anthony Tung Shuen Ho, Eliza Steve Seumahu, Siu Chung Tam, Teck Wei Chin, Hock Seng Lim investigates various SAR digital filtering techniques to remove speckles for image classification using fused SAR and SPOT XS image[1]. Mar´ıa Elena Buemi, Marta Mejail, Julio Jacobo and Juliana Gambini proposed SAR Image Classification depending on adaptive stack filters [2]. Gabriele Moser, Vladimir Krylov, Sebastiano B. Serpico, Josiane Zerubia classified SAR images using Markov random fields model and finite mixtures [3]. Lorenzo Bruzzone, Mattia Marconcini, Urs Wegmüller, Andreas Wiesmann used RBF neural networks to classify the SAR data [4]. Lalit Gupta, Shivani G. Rao, Sukhendu Das proposed Gabor filter for the energy measure and the Fuzzy C-means classifier for SAR data classification [5]. Yeong-Sun Song, Hong-Gyoo Sohn, and Choung-Hwan Park extract the water area using coefficients of the shadow area in high relief regions [6]. SUN Xiao-xia, ZHANG Ji-xian, LIU Zheng-jun and ZHAO zheng used SAR classification frame of two main aspects. First Information enhancement and second is Object-oriented classification based on fuzzy logic [7]. Roger Fjørtoft, Franck S´ery Danielle Ducrot , Armand Lop`es, Cedric Lemar´echal, Christelle Fortier, Philippe Marthon, Eliane Cubero-Castan classified the speckled SAR images based on estimations performed on fixed size sliding windows using the Bayesian approach [8]. Uma S. Ranjan, Akash Narayana classified SAR data based on scaling information is naturally invariant to speckle and clutter [9]. Dirk Borghys, Yann Yvinec, Christiaan Perneel, Aleksandra Pizurica and Wilfried Philips developed a method for supervised classification of multi-channel SAR data [10].
In order to improve the developed method, in this paper we introduce a Entropy based classification: classes that are easily discriminated are detected first. Multi-nominal regression takes into account constraints between all classes involved in the classification step and gives better results. The severance between different groups or classes is based on logistic and multi-nominal regression, which finds the best combination of features to make the separation and at the same time perform a feature selection depending on Grouped –Entropy value.
fSAR : {0,1} m ^ {0,1} where m is the length of the input image vectors.
III. Preprocessing Technique
The pre-processing procedures espoused in our system are the typical methods used in the literature for SAR data processing of multi temporal scenes. The related correction factors stay behind the same across all images and therefore do not affect the backscatter temporal variability used in the classification. We introduced the adopted filter function given below:
IV. Multi-nominal Regression
Multi-nominal regression is very comparable to logistic regression. With the aim at usability It can be categorized into more than two classes. In the multi-nominal regression all classes are considered at the same time. If the SAR data consider as F , then
V
SAR
F
SAR
m
I i
E d
—
—
—
exp[% m + EE Fsar (n, m Y.n, m ]
K _ =--------M^---(2)
’ 1 + exP[n0, m + EE FSAR (0, m X m ]
Where dn is the filtered output for the nth input image I and F is the estimate of the local mean backscattering coefficient of that SAR image.
A boolean SAR image function
Where the sum in the denominator is over all classes, except the baseline class.
Then the SAR data converted for combining the input parameters into a non-linear function.
R„ ( k„,\T ) =
expl»,,.+ EE FSAR (0, m X m ]
nm
1 + exp[nm +EE Fsar(., m)nn m]
—
—(3)
nm
R ( K | T ) is the conditional probability that a pixel (n,m) belongs to the considered class (target class) given the vector of input features ( T ) at the given pixel.
-
V. Entropy
Entropy means to consider the neighborhood of the pixel of an image. Entropy is a measure of disorder, or more precisely unpredictability. The probability of a SAR images intensity occurring at particular pixel in ’n’, where ’n’ is the set of all pixels in a SAR image, is defined as R ( n )log( R { n }) .The sum of all of these probability makes the Entropy of ’R’, So,
V (k) = —E R (.) Iog(R{.})———(4)
n e k
Where R{n} is the probability mass function of particular pixel in ’n’. As its magnitude increases more uncertainty and thus more information is associated with the source. In this paper probability image has been taken as an input image to find entropy. Here it becomes necessary to select analyzing window size to find entropy for neighborhood of each pixel in the input image. After that 3x3 and 5x5 window sizes were used to find entropy. By moving analyzing window on complete image, calculating entropy for each window, new entropy image was formed by replacing the central pixel of the particular window by Grouped –Entropy value and displayed as entropy image.
-
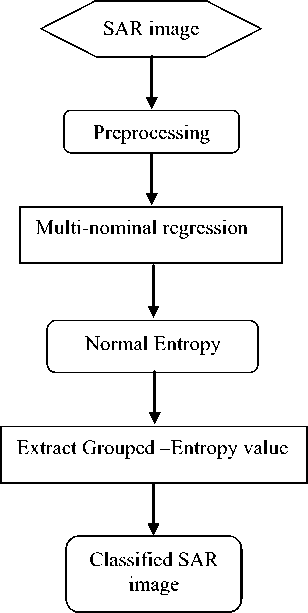
VI. Proposed Algorithem
-
• Input: SAR Images of variable size.
-
• Output: Classification of SAR image.
-
1) Start.
-
2) Taken a SAR images.
-
3) Consider a 5X5 window.
-
4) calculate the multi-nominal regression of that SAR Images.
-
5) Classification is obtained using Grouped – Entropy value.
-
6) Stop.
VII.Proposed Work Flow Diagram
-
VIII. Experiment and Analysis
In this thesis work, we have considered synthetic aperture radar images. The SAR images are classified by using Entropy.
The figure (Fig 1 to Fig 2) shows the original SAR images and corresponding histograms and the figure (Fig 1(a) to Fig 2(a)) shows the histograms of Entropy based classified SAR images.
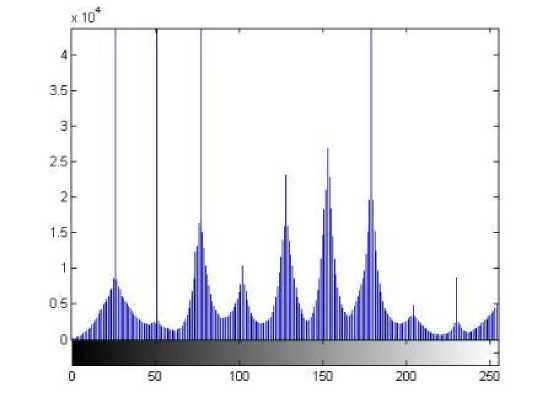
Fig. 1a: Entropy based classified Histogram
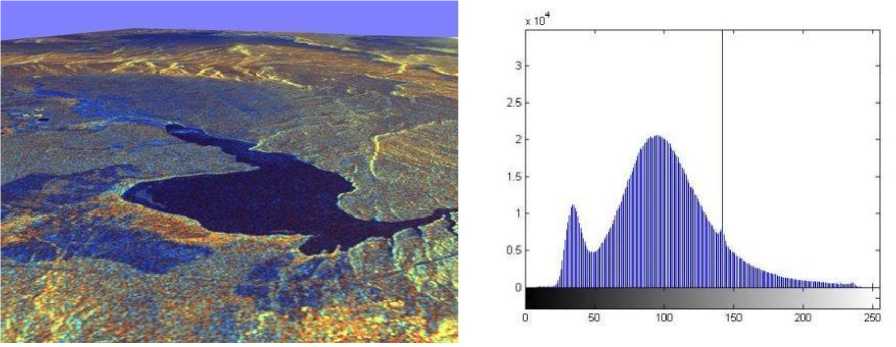
Fig. 1: SAR image1 and Histogram
Fig. 2: SAR image2 and Histogram
If we taking the pick values we get the no. of class are 4.
After using our methodology we get the Histogram given below:
If we taking the pick values we get the no. of class are 10.
If we taking the pick values we get the no. of class are 3.
After using our methodology we get the Histogram given below:
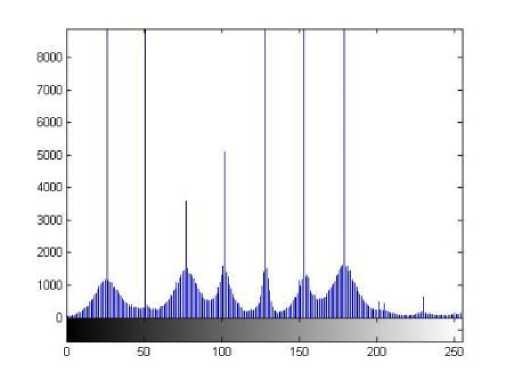
Fig.2a: Entropy based classified Histogram
If we taking the pick values we get the no. of class are 9.
Table1: Class Table of SAR images
|
SAR IMAGE |
CLASS BASED ON |
|
|
NORMAL HISTOGRAM |
ENTROPY HISTOGRAM |
|
|
Image1 |
4 |
10 |
|
Image2 |
3 |
9 |
-
IX. Conclusion
In this paper, a novel algorithm based on the Entropy for classification of SAR images is proposed. This technique is based on considering a 5X5 window and calculates successively the corresponding first, multi-nominal regression of the SAR Images. Here it becomes necessary to select analyzing window size to find entropy for neighborhood of each pixel in the input image. After that 3x3 and 5x5 window sizes were used to find entropy. By moving analyzing window on complete image, calculating entropy for each window, new entropy image was formed by replacing the central pixel of the particular window by Grouped –Entropy value and displayed as entropy image. The results from this preliminary study indicated that the proposed strategy was effective.
References Classification of SAR Images Based on Entropy
- Anthony Tung Shuen Ho, Eliza Steve Seumahu, Siu Chung Tam, Teck Wei Chin, Hock Seng Lim , “Improving SAR Image classification In Tropical Region Through Fusion With SPOT Data”. pp 1596-1598. 0-7803-4403-0/98/$10.00 0 1998 IEEE.
- Mar´ıa Elena Buemi, Marta Mejail, Julio Jacobo and Juliana Gambini, “Improvement in SAR Image Classification using Adaptive Stack Filters”.
- Gabriele Moser, Vladimir Krylov, Sebastiano B. Serpico, Josiane Zerubia , “High resolution SAR-image classification by Markov random fields and finite mixtures” , IS&T/SPIE Electronic Imaging 2010.
- Lorenzo Bruzzone, Mattia Marconcini, Urs Wegmüller, Andreas Wiesmann , “An Advanced System for the Automatic Classification of Multitemporal SAR Images” , IEEE transactions on geosciences and remote sensing, VOL. 42, NO. 6, JUNE 2004.
- Lalit Gupta, Shivani G. Rao, Sukhendu Das, “classification of textures in sar images using multi-channel multi-resolution filters”.
- Yeong-Sun Song, Hong-Gyoo Sohn, and Choung-Hwan Park , “Efficient Water Area Classification Using Radarsat-1 SAR Imagery in a High Relief Mountainous Environment” , Photogrammetric Engineering & Remote Sensing ,Vol. 73, No. 3, March 2007, pp. 285–296.
- SUN Xiao-xia, ZHANG Ji-xian, LIU Zheng-jun and ZHAO zheng, “Classification from airborne SAR data enhanced by optical image using an object-oriented approach”.
- Roger Fjørtoft, Franck S´ery Danielle Ducrot , Armand Lop`es, Cedric Lemar´echal, Christelle Fortier, Philippe Marthon, Eliane Cubero-Castan , “Segmentation, filtering and classification of SAR images”, LIMA/ENSEEIHT and CESBIO under contracts 833/CNES/94/1022/00 and 833/CNES/96/0574/00.
- Uma S. Ranjan, Akash Narayana , “Classification of objects in SAR images using scaling features”.
- Dirk Borghys, Yann Yvinec, Christiaan Perneel, Aleksandra Pizurica and Wilfried Philips, “Hierarchical Supervised Classification of Multi-Channel SAR Images”, pp. 1-5.
- L. Bruzzone, F. Roli, and S. B. Serpico, “Structured neural networks for signal classification,” Signal Process. vol. 64, no. 3, pp. 271–290, Feb.1998.
- S. B. Serpico, L. Bruzzone, and F. Roli, “An experimental comparison of neural and statistical nonparametric algorithms for supervised classification of remote-sensing images,” Pattern Recognit. Lett., vol. 17, no. 13, pp. 1331–1341, 1996.
- S. Quegan, T. Le Toan, J. J. Yu, F. Ribbes, and N. Floury, “Multitemporal ERS SAR analysis applied to forest mapping,” IEEE Trans. Remote Sensing, vol. 38, pp. 741–753, Mar. 2000.
- U.Wegmüller, A.Wiesmann, T. Strozzi, and C. L.Werner, “Forest mapping with multitemporal SAR,” in Proc. ForestSAT’02 Conf., Edinburgh, U.K., Aug. 5–9, 2002.
- T. Le Toan, S. Quegan, M. Davidson, and J. M. Martinez, “Radar remote sensing of forests. Applications using existing satellite SAR data,” in Proc. 8th Int. Symp. Physical Measurements Signatures Remote Sensing, 2001, pp. 33–40.
- Krylov, V. and Zerubia, J., High resolution SAR image classi_cation," Research Report 7108, INRIA (2009).
- Besag, J., On the statistical analysis of dirty pictures," Journal of the Royal Statistical Society B 48, 259{302 (1986).
- Geman, S. and Geman, D., Stochastic relaxation, Gibbs distributions, and the Bayesian restoration of images," IEEE Trans. Patt. Anal. Mach. Intell. 6, 721{741 (1984).
- Yu, Y. and Cheng, Q., MRF parameter estimation by an accelerated method," Pattern Recognit. Lett. 24(9-10), 1251{1259 (2003).
- Kato, Z., Zerubia, J., and Berthod, M., Satellite image classi_cation using a modi_ed Metropolis dynam-ics," in [Proceedings of ICASSP], 573{576 (1992).
