Classification of the fire station requirement with using machine learning algorithms

Author: Can Aydın
Journal: International Journal of Information Technology and Computer Science @ijitcs
Article in issue: 1 Vol. 11, 2019.
Free access
In crowded cities, selection of the suitable location for fire stations within the town is a vital issue in terms of rapid response to fires and minimizing loss of life and property. For the selection of the suitable fire station location, at first it is necessary to divide the whole city into certain zones and the need for a fire station service should be questioned for each zone. In this study, based on existing fire stations service area, classification of fire station requirement by zones was carried out using machine learning classification algorithms. In order to estimate fire station requirement according to the zones, a classification study was conducted by using some data such as the travel time of the fire engines to zone from closed fire stations, population density of the zone, the mean number of main and assistant vehicles travelling to the zone from closed fire stations, and the fire station existence data in the zone. The purpose of this study was to determine the most successful classification algorithm for the classification of the fire station requirement of 808 zones determined by Izmir Metropolitan Municipality. As a result of the analysis of fire records between 2015 and 2017, it was found that for the classification of the zones, the most successful algorithm was Random Forest algorithm with 93.84% accuracy rate. Experimental evaluation of the study; according to the 5-minute access distance of the existing fire stations, the fire station requirements of the regions and the fire station needs of the regions covered by the machine learning algorithm classification results were found to be 85.43% similar.
Machine Learning, Selection of Location, Geographical Information Systems, Management Information System
Short address: https://sciup.org/15016328
IDR: 15016328 | DOI: 10.5815/ijitcs.2019.01.03
Text of the scientific article Classification of the fire station requirement with using machine learning algorithms
Published Online January 2019 in MECS
In recent years, urban population has been increasing rapidly due to the high birth rates and increased external migration. Since there is not enough infrastructure in the cities, the increasing population causes the municipality services as fire service to not be provided at the desired level. In cities where population density is high and which are not planned, due to the result of the lack of resource management, malfunctions experienced in fire services result in the failure of fire engines to catch fire event in time. Resource management includes the proper distribution of the stations so that fire engines can arrive at the scene as quickly as possible. During this distribution of the stations, the boundary of the fire service has been accepted as the service boundary of the metropolitan municipality defined as the provincial border. Service boundaries have been divided into 808 zones in total in this study. In order to examine whether these zones receive fire service from the fire stations, the current situation has been first determined. When the current situation is examined, it is seen that there are 50 fire stations connected to the Fire Department of the Izmir Metropolitan Municipality. According to the world standards, fire stations need to respond (intervene) to the events occurring in close vicinity within 5 minutes. Within the scope of this bindingness, in line with the buffer zone analysis conducted through considering the current traffic density of fire stations in Izmir province, it is observed that the stations could not provide enough service to 482 of the 808 zones (Fig. 1).
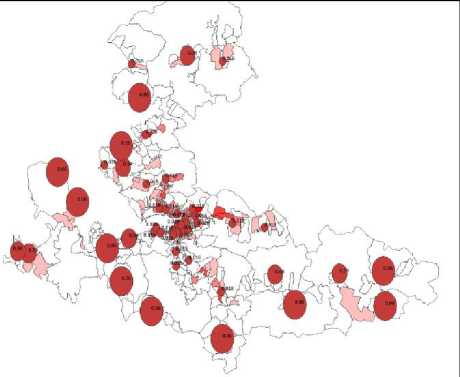
Fig.1. Service coverage of the fire stations
In this context, the new fire stations should be proposed in order to provide services to the zones that do not receive adequate fire service in line with the abovementioned standards. In order to determine which zones the new fire stations should be established, first a classification study was carried out according to the fire station needs of the zones by using machine learning methods ([1], [2], [3], [4]). The classification process with machine learning algorithm was carried out in two stages: pre-processing of the data, classification of the model [5]. Pre-processing of the data aims to compile the existing data into a representative array of inputs, to correct and convert them, or create a subset, and it also makes possible to prepare data to include information about the requested application ([6], [7]). In this stage the capabilities of geographic information systems have been utilized in order to obtain and preprocess the data in the data set to be used for classification. Spatial data was obtained by analyzing and querying by using ArcGIS Pro, which is one of the tools of geographic information systems. Naive Bayes, KNN, Decision Tree, SVM, Random Forest, Gradient Boosting Trees (Logit Boost) algorithms are selected for comparing accuracy results. For the classification of the training and performance data, techniques such as k-fold (K=10) and cross-validation are used. The performance of the trained classification model is usually determined by taking the sum or arithmetic mean of the k-fold results. The results of the analyzed data were evaluated by Kappa and accuracy analysis.
-
II. Related Work
Many different studies have been encountered when the literature on the selection of the fire station locations and the prediction of fires were examined. In 2017, Connor and his colleagues used the boosted regression tree (BRT), which is a machine learning method, to determine fire stations' locations within the framework of fire management [8]. The BRT method is a flexible nonparametric machine learning approach that automatically identifies and modulates the variable interactions and that can overcome sharp discontinuities that are less common than the generalized linear or generalized additive models of candidate variables ([9], [10]). In another study, a fire prediction model was carried out by using artificial neural networks method and the determined zones were classified in four categories with an accuracy of 0.789 [11]. In order to predict in which regions the forest fires would occur in a long-term, high and low fire risk areas were classified by using fuzzy machine learning methods [12]. In another study conducted for the estimation of the forest fires, prediction was carried out by using meteorological data and data mining methods. In that study, support vector machines and random forest algorithms were used. In the classification algorithm, temperature, humidity, rain and wind data were used [13]. In 2006, Amatulli and his colleagues carried out a long-term fire risk assessment by using decision trees method [14]. Song (2017) compared the spatial econometric models with the random forest algorithm for the fire occurrence model. In the scope of that study, it was determined that in terms of determining the location of fire stations, the machine learning methods gave better results [15]. In a study conducted in 2017, by using the genetic algorithm approach, the optimum locations of the airport fire stations were estimated. That study was carried out in two parts: first was the determination of the required fire station and second was
the determination of the optimum locations [16]. As well as it is used in many different areas, machine learning algorithms are also used for the classification of satellite images. For example, machine learning algorithms were used to detect oil leaks [17]. In 2014, machine learning algorithms were also used to make geological maps by using satellite images [5]. The study also compared the results of Naive Bayes, nearest neighbor analysis, random forest, supporting vector machines and artificial neural networks algorithms. When the results of the study were examined, it was found that the algorithm giving the best result was the random forest algorithm. The aim of the fire stations location selection problem is to ensure that all fire stations provide optimum service. When the studies on this subject are examined, it is observed that the probability of the fire outbreak has been calculated by using some criteria such as service area, population density, accessibility, traffic density, number of incidents [18]. In the selection of location of the fire stations, there are some purposes such as to provide services to the zones from which the most request come according to the number of events, to minimize the longest distance used to go (travel) from the station to the scene, and to minimize the average travel time from the station. In line with these purposes, some methods such as linear programming or coverage models, which are among optimization methods, have been used in the solution of this problem until now.
On the other side, in this study, the needs of fire stations were estimated by using the classification method with machine learning methods. For classification, the arrival time of the fire engines to that zone, population density, the average number of main and assistant vehicles going to the zone, and the availability of fire station in the region were used. The data set used for classification was obtained by using geographic information system tools in accordance with a specific model. For example, the data for population density was obtained using thematic mapping method. The total numbers of fires of the zones were obtained with SUM function and were spatially revealed. The aim of the study was to determine the fire station needs of the zones so that all the zones could receive service within five minutes. Innovativeness of this study is using machine learning techniques with spatial data which analyzed from geographical information system tools. Spatial data mining usage increased accuracy of determining fire station locations rather than the other studies.
-
III. Materials and Methods
-
A. Data Collection
The data used within the scope of the study was obtained by digitalizing the fire reports which were kept within the Directorate of Fire Department of the Metropolitan Municipality of Izmir. Between 2015 and 2017, 5400 fire reports were digitalized and they were marked spatially on the map in the environment of geographic information systems. Based on the
information in the fire reports, the average arrival times of fire engines (trucks) to fires were calculated by zones. Besides, the number of fire engines of the main team and the number of fire engines of the assistant team were calculated. The numbers of fire engines of main and assistant teams are directly related to the size and scope of the fire. In this context, the high number means that the fire is big. In addition to this information, the population density of the zones and whether there was a fire station in the zone were also achieved. While calculating population density, a new population data was obtained by summing the student population, employmentpopulation, and the Izmir Metropolitan Municipality’s projection population data belonging to the year of 2030 according to the regions. The reason why student and employment data were added to the future population data when calculating population data was the idea that since the fire could occur any time of day and night, it would be incomplete to consider only the housing population when calculating the population data (Table 1). Therefore, population data was calculated by summing the population of the zones, employment-population and the number of students in the university districts.
Table 1. The data set used for classification
|
Data Types |
Source |
|
Population density by zones |
Layer of zones - spatial |
|
Number of fires by zones |
Layer of fires - spatial |
|
Number of fire engines of the main team by zones |
Event table – attribute |
|
Number of fire engines of the assistant team by zones |
Event table – attribute |
|
Travel time of fire engines by zones |
Event table –attribute |
|
Fire station status by zones |
Layer of fire station – spatial (class) |
-
B. Data preprocessing
Data collected and digitalized from fire reports were filtered from 2014-2017 those from İzmir. Population density by zones, number of fires by zones and layer of fire station status data are obtained from spatial data with using spatial queries and analysis. Determining fire station status by zones, there is need data preprocessing because of coverage problem occurs with this data. According to the world standards five-minute access duration standard are used for determining fire station status by zones in line with the buffer zone analysis conducted through considering the current traffic density of fire stations in Izmir province, it is observed that the stations could not provide enough service to 279 of the 808 zones. The determination of whether or not there is any fire station within the boundaries of the zones was also carried out by spatial join (Fig. 2).
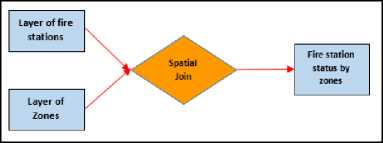
Fig.2. Availability of the fire stations by region
In this context, it was accepted that all the zones touching to the buffer zone assigned to fire stations were receiving service. Regarding this service status, the value of 1 was given to the zones receiving service and the value of 0 was given to all other zones that did not receive service (Fig. 3).
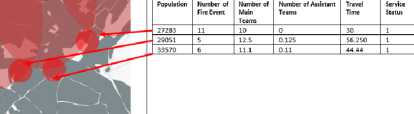
Fig.3. The coverage problem of the service status assigned to the zones
During the problem definition of the study, it was detected that some mistakes had been made in this conducted analysis study. Examining the details of the error, it was seen that when the value of 1 was directly given to only the zones touching to the buffer zone assigned to the fire stations, the coverage area error was performed (Fig. 3). The reason for this is that in some zones, the residential spots may be located on the side of the zone that do not touch to the buffer zone. Therefore, another analysis study was carried out and the residential spots of the zones were determined. This time, our criterion for the analysis of the buffer zone assigned to the fire stations were changed as touching to the residential spot as well as touching to the buffer zone. In this way, the value of service status given to the zones has been changed. The condition in which the assigned buffer zone touch to the residential spot has been determined as the value of 1 and the other condition has been determined as the value of 0 (Fig. 4). As a result of the analysis of the buffer zone assigned to the fire stations, it has been seen that the stations cannot provide adequate service for 482 of the 808 zones. This obtained result makes possible to obtain better results for the data used for defining the problem and machine learning algorithm.

Fig.4. The service status assigned to the zones
Second data preprocessing operation, the capabilities of geographic information systems have been utilized in order to obtain and preprocess the data in the data set to be used for classification. Spatial data was obtained by analyzing and querying by using ArcGIS Pro, which is one of the tools of geographic information systems. For example, for the population data of the zones, the number of students in the zones, the number of employment in the region and the population estimate of 2030 were summed and then it was imported in Comma Separated Value (CSV) format by matching the unique value (ID) of each zone. Then, SPATIAL JOIN process was carried out for the layer of fires and the layer of zones, and the numbers of fires within the boundaries of the zones were obtained using the SUM function (Fig. 5).
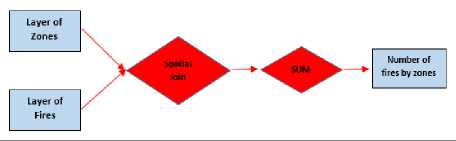
Fig.5. The number of fires by zones
Again, based on the event table, the travel times were calculated by taking the differences between the exit times of fire engines from the stations and their arrival time to the scene. The numbers of fire engines of the main and assistant teams were also obtained from the database. The classification table has been created by combining all data with the specified ID column for the events (Fig. 6).
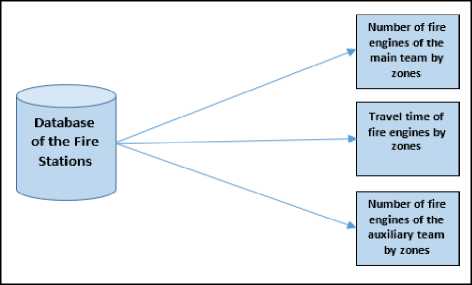
Fig.6. The numbers of fire engines of the main and assistant teams by zones
-
C. Selection of the Algorithm
In the context of this study, Naive Bayes (NB), Support Vector Machines (SVM), Decision Tree (J48), k-Nearest Neighbors (KNN), Random Forest (RF), Gradient Boosted Trees (GBT) classification algorithms were used.
Naive Bayes (NB) is a well-known statistical learning algorithm proposed as a basic level classifier for comparison with other algorithms. NB predicts the probability of a class condition neutrally by assuming that entries for a particular class are independent of each other. NB reduces the problem of separator classes in order to find conditional marginal density of the classes; this represents the probability of becoming one of the possible target classes for a particular instance (Molina et al., 1994). NB performs well against other algorithms unless it contains inputs associated with each other [7].
k-Nearest Neighbors (KNN) is an algorithm in which the proximity of the new object, which is wanted to be classified, to the K in previous objects is [19]. During classification, test samples and training samples are compared with each other. For the neighborhood distance, the Euclidean distance is used. The estimations are based on the majority vote of the neighbor objects. It is necessary to be careful because there is a tendency to overreact with high k values [3].
Decision Tree: In this algorithm, a tree structure is created, class tags are expressed at the level of the leaves of the tree, and the operations on the properties are expressed with the arms that are coming from the beginning and going to the leaves [20]. Decision tree is one of the basic algorithms and the random forest and gradient boosted tree have been derived from the structure of this algorithm. The algorithm is simple to understand and interpret. It can be used for processing both numeric and class data.
Support Vector Machines (SVM): This algorithm is capable of identifying nonlinear decision boundaries in a high-dimensional variable space by solving the second order optimization problem [21]. The basic SVM theory states that for a set of data that contains points from two classes and can be disjointed in a nonlinear manner, there is an infinite number of lines dividing the classes. The selection of a line that best separates two classes (i.e. the decision boundary) is achieved by using only a subset of the training samples known as support vectors. The maximum boundary distance between the support vectors is taken to represent the optimal decision boundary. For the problems where classes cannot be parsed linearly, SVM uses an implicit transformation of input variables by using the kernel function. Kernel functions allow SVM to separate non-linear separable support vectors using a linear plane [22]. For most applications, a suitable kernel function and kernel width must be selected to optimize performance [21].
Random Forest is an algorithm that increases the classification rate by producing multiple decision trees during the classification process. Randomly selected decision trees come together and they form the decision forest. For many datasets, this algorithm produces more accurate results than Support Vector Machines. It gives good results in datasets that contain a categorical variable with a large number of variables and class labels that have missing data, or that exhibit an uneven distribution.
Gradient Boosting Trees is an algorithm, similar to the random forest algorithm, works with decision trees. The main difference is that the final estimate is a linear sum of all trees, and the purpose of each tree is to minimize the residual error of the previous trees. The XGBoost, that is, the gradient boost trees algorithm, ensures efficiently implementation of this algorithm, which can be scaled in all scenarios [23].
-
IV. Experiments and Evaluation
-
A. Prediction Evaluation
When determining the most successful algorithm, the performances of the algorithms were measured with the Accuracy Ratio, Mean Absolute Error (MAE), Root Mean Square Error (RMSE) and Kappa values. While 66% of the dataset was determined as training data, 33% of it was determined as test data.
Accuracy rate; the most commonly used method to measure the success of the model is the accuracy rate measurement [24]. The accuracy ratio is the ratio of the data, which has been correctly classified, to all data. Accuracy Rate is calculated as follows (1):
л (Тр + Т))А с сиг асу = —--------—(Тр + Ер+ F) + Т))
-
(1) Accuracy Rate
In this equation, Tp+Tn is the number of data classified correctly and Fp+Fn is the number of data classified incorrectly.
Mean Absolute Error (MAE); it measures the average size of errors in a series of estimates. The mean absolute error refers to the mean of the validation sample of absolute values of the differences between the predicted and observed (2).
МАЕ =-У |%£-%л£| t=i
-
(2) Calculation of mean absolute error
Root Mean Square Error (RMSE); this is a second-degree scoring rule that measures the average size of the error. The sum of the squares of the differences between the predicted and observed values is taken and then averaged on the sample. Both evaluation tools can be used together to identify the variation of errors in a series of estimates. RMSE will always be greater than or equal to MAE. The greater the difference between them, the greater the variance of the individual errors in the sample. The formula of RMSE is shown in the equation 3.
RMSE = 0#
-
(3) Calculation of RMSE
Kappa test is a statistical method that measures the reliability of the agreement between two or more observers. The Kappa coefficient varies between -1 and +1. If the observed agreement is bigger or equal than the agreement by chance, then K≥0. If the observed agreement is less than the agreement by chance, then K<0. The interpretable range of kappa coefficient is between 0 and +1 and the negative values (k <0) do not make any sense in terms of the reliability. If the Kappa score is above 0.4, it is considered a reasonable value. The Kappa value is calculated as follows (4):
(Ро-Рв )
(1-Р е )
-
(4) Calculation of Kappa
where Po is relative observed agreement among observers and Pe is the hypothetical probability of chance agreement.
In this section, the results of five different machine learning algorithms were compared. The results have provided the classification of zones’ status of receiving service from the fire stations. When the results of the algorithms were compared, it was observed that the Random Forest algorithm performed a classification with accuracy of 93.8402% (Table 2) and the results related to the zones’ status of receiving service were marked as spatial on the map. After marking the test data on the map, buffer zones were drawn for the proposed stations by taking into account the fire stations’ 5-minutes travel distance, and the coverage areas were compared (Figure 7).
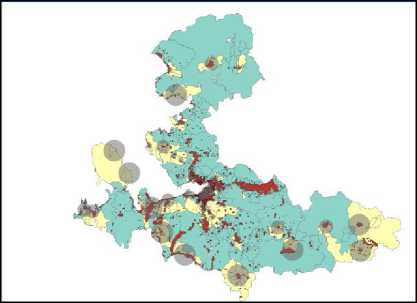
Fig.7. 5-minutes travel distance map of the classified fire stations
Table 2. Comparison of the results of the algorithms
|
Algorithms |
Accuracy Classification Rate |
Kappa Statistic |
Mean Absolute Error (MAE), |
Root Mean Square Error (RMSE) |
Relative Absolute Error |
Relative Square Root Error |
|
Naive Bayes |
87.3606 |
0.0055 |
0.1731 |
0.3267 |
%147.558 |
%135.5245 |
|
KNN |
87.8563 |
-0.0071 |
0.1225 |
0.348 |
%104.4204 |
%144.3503 |
|
Decision Tree |
93.8042 |
0 |
0.1162 |
0.2411 |
%99.1015 |
%99.9988 |
|
SVM |
93.8042 |
0 |
0.062 |
0.2489 |
%52.8235 |
%103.2484 |
|
Random Forest |
93.8042 |
0 |
0.1154 |
0.2479 |
%98.3982 |
%102.831 |
|
Gradient Boosting Trees |
93.6803 |
-0.0024 |
0.1137 |
0.2428 |
%96.9376 |
%100.6932 |
-
V. Conclusion
This study proposed classification of fire station requirement by zones was carried out using machine learning classification algorithms. For this purpose, population density by zones, number of fires by zones, number of fire engines of the main and assistant teams by zones, travel time of fire engines by zones and fire station status by zones were collected from fire reports with using spatial query and analysis. In the data preparation phase of the study, the coverage problem of fire stations was analyzed and solved, then the data set was prepared. During the preprocessing phase of the data, the spatial data was prepared in the appropriate format by using geographic information systems in the preparation of data for analysis. Then, the data were tested by using five different machine learning algorithms and the results were compared. Experimental evaluation of the study; according to the 5-minute access distance of the existing fire stations, the fire station requirements of the regions and the fire station needs of the regions covered by the machine learning algorithm classification results were found to be 85.43% similar. To contribution of this study can be summarized as;
To the best our knowledge this is the first study that machine learning algorithm is used for fire station requirement classification.
Population calculation consist sum of day and night population in which
New population data calculation technique application was obtained by summing the student population, employment-population, and the projection population data belonging to the year according to the regions with choosing suitable fire station location.
Fire engines situation data, fire statistics were combined as variables for classification.
In future studies, in order to obtain better results, some variables such as traffic density and road width can be added to the variables determined for the machine learning algorithm. In the present study, historical data obtained from archive records were used. If the current data will obtained with a certain systematic system, the algorithm can be continuously trained with new data and get better classification results. When a new zone is added to the system, it can be predicting with using a trained data set whether the region needs a fire service or not.
Acknowledgment
This work was supported in part by a grant from XYZ.
References Classification of the fire station requirement with using machine learning algorithms
- Alonso-Betanzos, A., Fontenla-Romero, O., Guijarro-Berdiñas, B., Hernández-Pereira, E., Andrade, M. I. P., Jiménez, E., ... & Carballas, T. (2003). An intelligent system for forest fire risk prediction and fire fighting management in Galicia. Expert systems with applications, 25(4), 545-554.
- Amatulli, G., Rodrigues, M. J., Trombetti, M., & Lovreglio, R. (2006). Assessing long‐term fire risk at local scale by means of decision tree technique. Journal of Geophysical Research: Biogeosciences, 11
- Song, C., Kwan, M. P., Song, W., & Zhu, J. (2017). A comparison between spatial econometric models and random forest for modeling fire occurrence. Sustainability, 9(5), 819.1(G4).
- Chen, T., & Guestrin, C. (2016, August). Xgboost: A scalable tree boosting system. In Proceedings of the 22nd acm sigkdd international conference on knowledge discovery and data mining (pp. 785-794). ACM.
- Cortez, P., & Morais, A. D. J. R. (2007). A data mining approach to predict forest fires using meteorological data.
- Congalton, R.G., Green, K., 1998. Assessing the Accuracy of Remotely Sensed Data: Principles and Practices, first edn. Lewis Publications, Boca Raton p. 137.
- Cover, T., Hart, P., 1967. Nearest neighbor pattern classification. IEEE Trans. Inf. Theory 13, 21–27.
- Cracknell, M. J., & Reading, A. M. (2014). Geological mapping using remote sensing data: A comparison of five machine learning algorithms, their response to variations in the spatial distribution of training data and the use of explicit spatial information. Computers & Geosciences, 63, 22-33.
- De’ath G (2007) Boosted trees for ecological modeling and prediction. Ecology 88, 243–251. doi:10.1890/0012-9658(2007)88[243:BTFEMA] 2.0.CO;2
- Elith J, Phillips SJ, Hastie T, Dudı´k M, Chee YE, Yates CJ (2011) A statistical explanation of MaxEnt for ecologists. Diversity & Distributions 17, 43–57. doi:10.1111/J.1472-4642.2010.00725.X
- Guyon, I., 2008. Practical feature selection: from correlation to causality. In: Fogelman-Soulié, F., Perrotta, D., Piskorski, J., Steinberger, R. (Eds.), Mining Massive Data Sets for Security – Advances in Data Mining, Search, Social Networks and Text Mining, and their Applications to Security. IOS Press, Amsterdam, pp. 27–43.
- Guyon, I., 2009. A practical guide to model selection. In: Marie, J. (Ed.), Proceedings of the Machine Learning Summer School. Canberra, Australia, January 26 - February 6, Springer Text in Statistics, Springer p.37.
- Hastie, T., Tibshirani, R., Friedman, J.H., 2009. The elements of statistical learning: data mining, Inference and Prediction, 2nd edn. Springer, New York, USA p. 533.
- Hsu, C.-W., Chang, C.-C., Lin, C.-J., 2010. A Practical Guide to Support Vector ClassificationDepartment of Computer Science, National Taiwan University, Taipei, Taiwan16.
- Hastie, T., Tibshirani, R., Friedman, J.H., 2009. The elements of statistical learning: data mining, Inference and Prediction, 2nd edn. Springer, New York, USA p. 533.
- O’Connor, C. D., Calkin, D. E., & Thompson, M. P. (2017). An empirical machine learning method for predicting potential fire control locations for pre-fire planning and operational fire management. International journal of wildland fire, 26(7), 587-597.
- Kubat, M., Holte, R. C., & Matwin, S. (1998). Machine learning for the detection of oil spills in satellite radar images. Machine learning, 30(2-3), 195-215.
- Kuncheva, L., 2004. Combining Pattern Classifiers: Methods and Algorithms. John Wiley & Sons p. 376.
- Lu, D., Weng, Q., 2007. A survey of image classification methods and techniques for improving classification performance. Int. J. Remote Sens. 28, 823–870
- Marsland, S., 2009. Machine Learning: An Algorithmic Perspective. Chapman & Hall/CRC (406 pp.)
- Molina, R., P´erez de la Blanca, N., Taylor, C.C., 1994. Modern statistical techniques. In: Michie, D., Spiegelhalter, D.J., Taylor, C.C. (Eds.), Machine Learning. Neural and Statistical Classification. Ellis Horwood, New York, pp. 29–49.
- Iliadis, L. S. (2005). A decision support system applying an integrated fuzzy model for long-term forest fire risk estimation. Environmental Modelling & Software, 20(5), 613-621.
- Song, C., Kwan, M.-P., Song, W., & Zhu, J. (2017). A Comparison between Spatial Econometric Models and Random Forest for Modeling Fire Occurrence. Sustainability, 9(5), 819.
- Şeker Ş. E. (2012). Karar Ağacı Öğrenmesi. Bilgisayar kavramları internet sitesi: http://bilgisayarkavramlari.sadievrenseker.com/2012/04/11/karar-agaci-ogrenmesi-decision-tree-learning/
- Tzeng, G. H., & Chen, Y. W. (1999). The optimal location of airport fire stations: a fuzzy multi‐objective programming and revised genetic algorithm approach. Transportation Planning and Technology, 23(1), 37-55.
- Witten, I.H., Frank, E., 2005. Data Mining: Practical Machine Learning Tools and Techniques, 2nd edn. Elsevier/Morgan Kaufman, San Fransisco, USA p. 525
- Valinski D. 1955. “A Determination of the Optimum Location of Fire-Fighting Units in New York City,” Journal of Operations Research Society of America, 3(4) 494-512.
- Yu, L., Porwal, A., Holden, E.J., Dentith, M.C., 2012. Towards automatic lithological classification from remote sensing data using support vector machines. Comput. Geosci. 45, 229–239.
