Clustering of Faculty by Evaluating their Appraisal Performance by using Feed Forward Neural Network Approach

Author: C.Bhanuprakash, Y.S. Nijagunarya, M.A. Jayaram
Journal: International Journal of Intelligent Systems and Applications(IJISA) @ijisa
Article in issue: 3 vol.9, 2017.
Free access
Clustering is the process of grouping a set of data objects into multiple groups or clusters with high similarities and dissimilarities. Dissimilarities and Similarities are assessed on the attribute values describing the objects and often involve distance measures. Clustering acts as a data mining tool by having its roots in many application areas such as biology, security, business intelligence, web search etc. Our Institute is currently using a software application with a name "Merit System", which evaluates the performance of the staff members regarding their level of teaching by considering various factors. It computes the performance level by collecting feedback from every student. It gives the appraisal result in the form of 30 points earned to every staff member. It acts as a tool for the management of our college to gauge the performance level of the teacher which in turn helps them in assessing annual increments and other promotions. The main drawback of this system is its inability in grouping of staff members like Group-A, Group-B, Group-C etc. Because, many of the staff members have scored the performance points in the range of 21 to 30 which will creates lot of ambiguities to the management to make clusters of staff members to these groups. This issue is the prime concern of this paper and it was given with an approach to solve this problem by considering possible optimum soft computing technique that includes Feed Forward Neural Network approach.
Clustering, Fuzzy Grouping, Fuzzy partitions, Range of values, Similarities, Neural networks, Hidden layers, feedback
Short address: https://sciup.org/15010911
IDR: 15010911
Text of the scientific article Clustering of Faculty by Evaluating their Appraisal Performance by using Feed Forward Neural Network Approach
Published Online March 2017 in MECS
On the last week of every semester, it is mandatory to every student to give their feedback on all the appeared subjects. For this purpose, Merit system has given an interface to every student with a separate username and password. It also ensures lot of liberty, freeness and confidentiality to the students to rate the teaching skill of their teachers by considering varied 15 factors. It computes appraisal result in the form of 30 points. Almost every staff in each of the department has scored points in the range of 20 to 30 which is a herculean task for the management to make them in to proper groups. Because, a staff with a points 24.9 belongs to Group-B, and a staff with a points 25.0 belongs to Group-A which creates lot of psychological imbalances among the staff members if we follow this type of traditional grouping procedure. This is the prime concern of this paper. Instead, of following conventional grouping methods, why don’t we follow fuzzy grouping so that the staffs with points 24.9 and 25.0 belongs to same group. This is the main theme of this paper. Here, it has been used the datasets which are freely available from our college web application MERIT SYSTEM, which consists of nearly 330 staff members who are handling nearly 500 + subjects in each of the semesters. On every semester, it collects the feedback and stores in a database which creates nearly 500+ records. Clustering has been done based on these records to make clusters among staff members.
Preprocessing of data is required at this stage, because, it is not possible to work any of the tools like Mat-Lab, R-tool directly with this software application. It needs extraction of this data and stores it separately in a separate database. For this purpose, a separate database was created along with a frontend application named as “Staff Appraisal System”. This application consists of many interfaces through which it accepts the feedback data manually from MERIT SYSTEM. Later, it generates the appraisal points of staff members in excel format on which we run mat-lab tools. Lastly, there has been comparison between the manually made groups with groups obtained from neural network techniques. It was found that the accuracy of the groupings obtained from neural network method yields more accurate than manual groupings. This reduces psychological imbalances among staff members regarding their clusters.
-
II. Related Work
There have been many approaches made by experts in the field of clustering techniques. An Effective Data mining using Incremental learning Neural Networks is presented [15]. Here, it has been used with a symbolic method by considering hoard objects and synthetic objects for clustering process applying on employee data set. They focused on some of the attributes like employee salary, commission, age, E-level, zip code, etc. Even, they worked on university dataset by including many related attributes like Noofstudents, Student Faculty ratio, Expenses, Financial Aid, No.of.Applications, Percentage of Enrollment, Academic scale, Location of the university etc. Here, the resource allocation network has been trained with the sample data set. At the end of training resource allocation, network learns complex data set for the respective function. The network has been tested with patterns from test set. It has been found that network produces perfect classification results. This research has contributed to the investigation on generating classification rules for symbolic type of data through an incremental learning neural network. Optimal Clustering Algorithms for Data Mining [7] is presented. In this paper, authors have shown that; the enhancement using the gradient decent, and the proximity graph, improves the support vector clustering time by decreasing its computational complexity to O(nlogn) instead of O(n2d), where; the practical total time for improvement support vector clustering (iSVC) labeling method is better than the other methods that improve SVC (Support Vector Clustering). The main findings show that SVC is better than the k-mean, fuzzy c-mean and SOM, because; it doesn’t depend on either number or shape of clusters, and it dealing with outlier and overlapping. Determining Contribution of features in Clustering Multi-dimensional Data using Neural Network [11] is presented. In this paper, Mrs. Sunitha Chittineni and Ravindra Babu Bhogapathi suggested Exhaustive search and Heuristic search techniques to determine the features that contribute to cluster data. Here, experiments are conducted to predict the network's ability to extract important factors and comparisons are made between two search methods. Hybridization of Fuzzy Clustering and Neural Networks for Intrusion Detection [16]. In this paper, Saeed Khazaee, Karim Faez proposed a hybrid classifier using fuzzy clustering and several neural networks. With using the fuzzy C-means algorithm, training samples will be clustered and the inappropriate data will be detected and moved to another dataset and used differently in the classification phase.
-
III. Methodology
The methodology adopted in this work is shown in following steps. The steps are briefed in the following paragraphs.
-
A. Steps:
A.1 Collection of features / attributes for staff appraisal
A.2 Extraction of data set from college Merit system
Updating the collected data in to Staff Appraisal System database.
A.3 developing an interface to collect dataset for all the identified features/attributes
A.4 preprocessing the data for cluster analysis by generating data into excel format
A.5 Transpose the given attribute data set
A.6 Manual making of convenient number of groups by taking suitable range of values
A.7 By using tools (Mat lab, R tool), run the data set and compare the result with manual grouping set.
-
B . Collection of Features/attributes considered for staff appraisal
The college MERIT system is computing the staff appraisal points by considering following features.
-
B.1 Regularity in engaging classes
-
a) Very regular b) Regular c) Not regular
-
B.2 Presentation of lecture
-
a) Highly effective b) Effective c) Not effective
-
B.3 Coverage of syllabus
-
a) 95% and above b) 85 – 95 % c) Less than 85 %
-
B.4 Opportunity for questions and discussion in the class
-
a) Highly encouraging b) Encouraging c)
Discouraging
-
B.5 Availability of teacher for consultation beyond class hours
-
a) Mostly b) Occasionally c) Never
-
B.6 Organization of course activities
-
a) Excellent b) Good c) Poor
-
B.7 Punctuality
-
a) Punctual b) Fairly punctual c) Not punctual
-
B.8 Teacher attempts to create interest in the subject
-
a) Always b) Occasionally c) Never
-
B.9 Pace of coverage of syllabus
-
a) Normal b) Fast / Slow c) Too fast / Too slow
-
B.10 Encourages critical thinking
-
a) Always b) Occasionally c) Never
-
B.11 . Tests and other evaluations reflect the course content:
-
a) Always b) Occasionally c) Never
-
B.12 . Quality of evaluation
-
a) Good b) Fair c) Poor
-
B.13 . Utilization of class time
-
a) Very effective b) Effective c) Not effective
-
B.14 . Subject knowledge of the teacher
-
a) Excellent b) Good c) Not satisfactory
-
B.15 . Depth of subject taught
-
a) More than adequate b) Adequate c) Inadequate
For the above factors, feedback will be collected from every student at the end of each semester. Depending on the feedback, it computes appraisal to 30 points.
-
C. Collection of dataset
The dataset of staff appraisal collected manually by giving proper username/password from the existing Merit system. Here, the dataset is obtained from a database to which we don’t have any access rights and moreover, it is difficult to apply mat-lab tools directly on this dataset. This needs proper preprocessing of the data.
-
D. Updating collected dataset into the Staff appraisal system
For this purpose, it has been created special application with a name “Staff Appraisal system “along with a separate database. This consists of many interfaces thru which entry of dataset was done manually from the user. Here is the one such interface shown in Fig-1 which will accept the feedback from students for 15 varied features of staff appraisal.
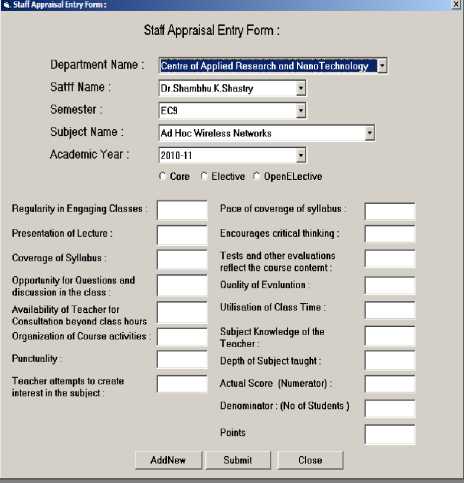
Fig.1. Interface form to enter staff Appraisal
-
E. Generate dataset in Excel format
Staff Appraisal system gives final dataset of all the staff members in department wise and academic year wise by using interface shown in Fig-2.
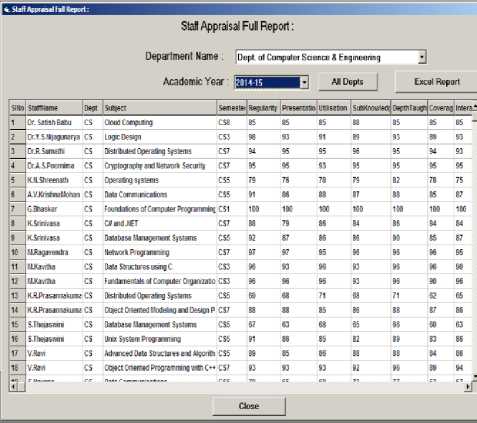
Fig.2. Full report of a staff Appraisal:
With this dataset, it is impossible to run any of the matlab tools directly. This needs further preprocessing of the data. It was generating excel format shown in the Fig-3.
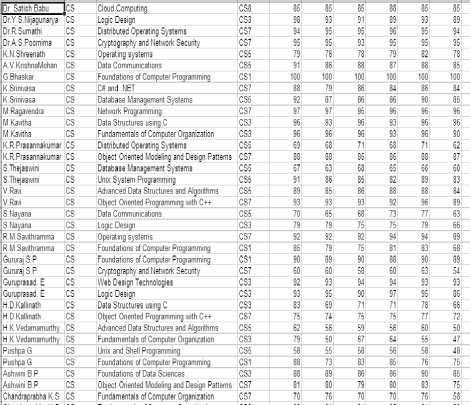
Fig.3. Generation of data set into excel format :
-
F. Transpose of columns into rows:
It is necessary to transpose the attribute values from columns into rows. Because, mat-lab tools will consider the dataset row wise rather than column wise. This is shown in the Fig-4.
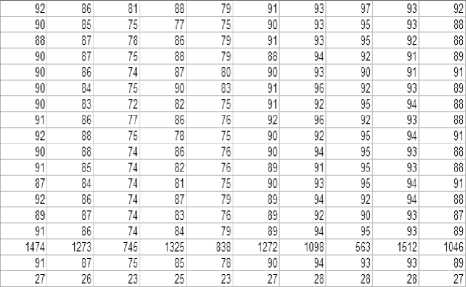
Fig.4. Transpose of columns into rows:
-
G. Manual grouping :( Supervised grouping)
It is necessary to make manual groups by taking range of values in conventional way. By assuming 3 groups, it has been done by using following range of values.
-
I .e. Group-1 is in the range of 21.0 to 23.0,
Group-2 is in the range of 24.0 to 26.0,
Group-3 is in the range of 27.0 to 30.0.
This is to be done in excel sheet by using the equation: = If (A2=1, 1, 0)
Here, A2 -> is the cell number.
-
1,1, 0 ^ If the appraisal points is in the range of 21.0 to 23.0, then it indicates that appraisal point belongs to Group-1 and 1 will be filled in the cell A2, otherwise it is filled with 0.
-
= If (A2=2, 1, 0) to fill the cell 1 if it belongs to Group-2,
-
2,1, 0 ^ If the appraisal points is in the range of 24.0 to 26.0, then it indicates that appraisal point belongs to Group-2 and 1 will be filled in the cell A2, otherwise it is filled with 0.
=If (A2=3, 1, 0) to fill the cell 1 if it belongs to Group-3,
-
3,1, 0 ^ If the appraisal points is in the range of 27.0 to 30.0, then it indicates that appraisal point belongs to Group-3 and 1 will be filled in the cell A2, otherwise it is filled with 0. This is shown in Fig-5.
|
A |
в |
C |
D |
||
|
1 |
G1 |
G2 |
G3 |
||
|
2 |
3 |
0 |
0 |
1 |
|
|
Tl |
2 |
0 |
1 |
0 |
|
|
4 |
1 |
1 |
0 |
0 |
|
|
5 |
2 |
0 |
1 |
0 |
|
|
6 |
1 |
1 |
0 |
0 |
|
|
7 |
3 |
0 |
0 |
1 |
|
|
8 |
3 |
0 |
0 |
1 |
|
|
9 |
3 |
0 |
0 |
1 |
|
|
10 |
3 |
0 |
0 |
1 |
|
|
11 |
3 |
0 |
0 |
1 |
|
Fig.5. Manual grouping with a formation of Identity matrix
Then it is necessary to make transpose of the above matrix values. i. e. columns into rows which is shown in Fig-6.
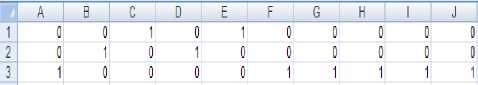
Fig.6. Transpose of an Identity matrix:
-
H. Use Mat-lab tool:
This is the stage where it can be used with mat-lab tools on the preprocessed dataset. The Mat-lab tools can be applied by considering 3 parameters. i) Input ii) Train the network by specifying number of hidden layers iii) target
H.1 Input:
Here, the preprocessed dataset will be given to the tool for clustering process. This can be achieved by copying the dataset from excel sheet and paste them in the matrix cells provided by mat-lab tool called as Workspace cum Variable editor.
H.2 Number of Hidden Layers:
Here, the number of hidden layers will be mentioned depending on the number of features / attributes considered to train the network for clustering process. Since it is considered here are (15 + 3) = 18 features, it is necessary to mention 2 times more than 18 features. That is minimum of 36 and above. It was given as 40.
H.3 Target:
Here, it has been already taken the decision regarding number of staff groups (i.e. number of clusters). It is 3. The values of the excel sheet which are in the form of transposed matrix will be copied and paste it in to the target workspace.
-
I. Execution of the neural network
Then it needs to run the tool and see the performance analysis by using neural network approach.
-
I.1 Validation and Test data:
Here, it is necessary to fix number of samples for training, validation and testing purposes. Generally, 70% of the samples will be given to train the network (i.e. it is 6 samples out of 10), 15% of the samples will be given for validation (i.e. it is 2 samples) and another 15% of the samples will be given to testing (i.e. it is also with 2 samples).
This approach will evaluate the performance level by giving its result in the form of
-
i) Pattern Recognition Neural network: (architecture view).
-
ii) Performance curve with number of iterations.
-
iii) Training state.
-
iv) Error Histogram.
-
v) Confusion matrix (Training, Validation and Test).
-
I.2 Pattern Recognition Neural network architecture view:
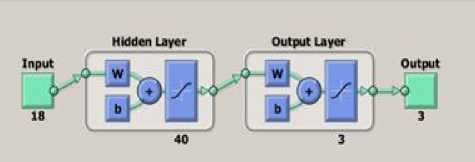
Fig.7. Feed Forward Neural Network architecture
Here, For the Input, it was given with 18 features, so it is 18.
Hidden Layer: The number of hidden layers are double than 18 features.
Here, it was given as 18 X 2 = 36 + 4 = 40.
Output layer (Target): Target is the number of groups it considers. Here it was 3.
-
I.3 Performance Curve with number of Epochs (Iterations) :
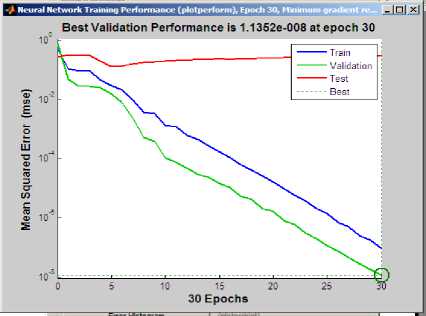
Fig.8. Performance curve with number of iterations
Performance Plot shows that mean square error dynamics for all the datasets in logarithmic scale. Training MSE (Mean Square Error) is always decreasing. This plot shows a perfect training. The property training indicates the 30th iteration at which the validation performance reached a minimum.
-
I.4 Training State:
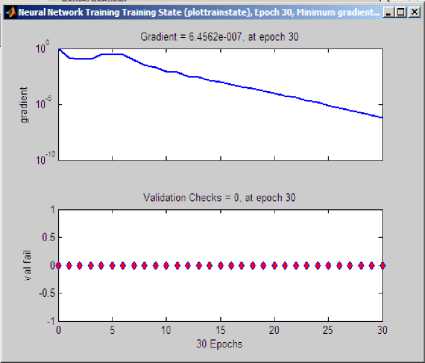
Fig.9. Training state diagram with number of iterations
-
I.5 Error Histogram:
A histogram is a graphical representation of the distribution of numerical data. It is an estimate of the probability distribution of a continuous variable. In a histogram, “bin” is the range of values, that is, divide the entire range of values into a series of intervals, and then count how many values fall into each interval. The bins are usually specified as consecutive, nonoverlapping intervals of a variable. The bins (intervals) must be adjacent, and are usually equal size.
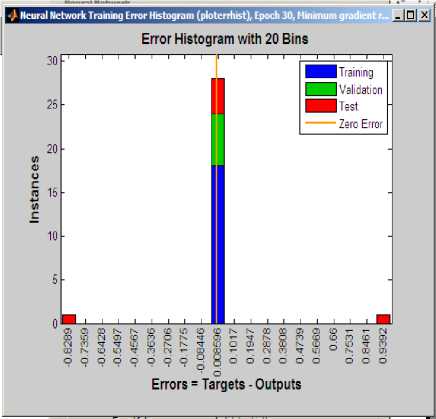
Fig.10. Error Histogram with number of Bins
-
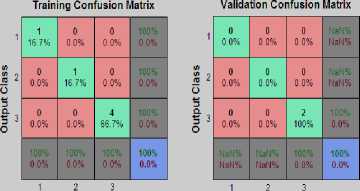
I.6 Confusion matrix (Training, Validation and Test)
A confusion matrix is a contingency table of correct and incorrect classifications used to evaluate the performance of a classification algorithm in machine learning.
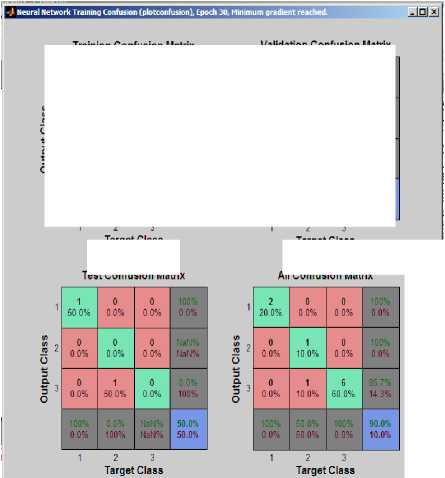
Fig.11. Confusion Matrix with number of iterations
Target Class
Target Class
Test Confusion Matrix
All Confusion Matrix
It can be also known as an error matrix, is a specific table layout that allows visualization of the performance of an algorithm, typically a supervised learning one. Each column of the matrix represents the instances in a predicted class while each row represents the instances in an actual class (or vice-versa) [2].
In this case it is 90% accurate. Green cells represent correct answers and red cells represent all types of incorrect answers.
-
I.7 Result after comparison:
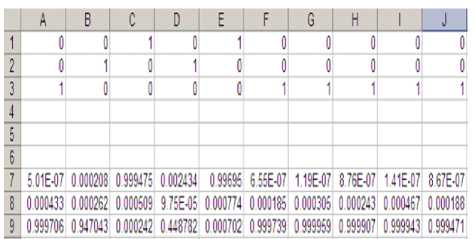
Fig.12. Comparison of the results :
From the Fig-11, it is found that, the groups obtained from the tool is almost similar to the groups which were done manually earlier. This can be confirmed by checking the occurrence of 1 in each of the groups in their corresponding cells A, B, C… etc (Here, 1 will be is in the form of 0.99976, 0.9476, 0.99475, and 0 will be in the form of 0.00028, 6.5E-07, 8.6E-07).
-
IV. Conclusion
In this paper, it has been introduced a Feed Forward Neural Network approach to cluster a group of staff members in an institution. Sometimes it is a very tedious task to make them a group for their annual appraisal by using conventional methods where it considers accuracy within the range of certain values. This results psychological imbalances among the staff members, because this matters a lot during their annual increments and other promotions. In order to avoid this, the above approach helps the management to go with a proper method to make them in a suitable group. This is a small attempt made on this criteria by taking the dataset of few staff members, but still there will be a lot of scope to improve this approach by working it on the appraisal points of all the staff members of the institution so that there will be chances of getting more accurate groups along with lot of satisfaction among the staff members.
References Clustering of Faculty by Evaluating their Appraisal Performance by using Feed Forward Neural Network Approach
- R.B.V.Subramanyam and A.Goswami. "A Fuzzy Data Mining Algorithm for Incremental Mining of Quantitative Sequential Patterns "International Journal of Uncertainty, Fuzziness and Knowledge-Based systems, Vol-13, No-6, 2005, 633-652
- Powers, David M W (2011). "Evaluation: From Precision, Recall and F-Measure to ROC, Informedness, Markedness & Correlation" (PDF). Journal of Machine Learning Technologies 2 (1): 37–63.
- Jiabin Deng, JuanLi Hu, Hehua Chi. "An Improved Fuzzy Clustering Method for Text Mining "–2nd International Conference on Network Security, Wireless Communications and Trusted Computing", 978-0-7695-4011-5/10 @ 2010 IEEE
- Timothy C.Havens, James C.Bezdek, Marimuthu Palaniswami. "Fuzzy c-Means Algorithms for Very Large Data "IEEE Transactions on Fuzzy Systems, Vol.20, No.6, December 2012.
- Junli Lu, Lizhen Wang, Yaobo Li. "A Fuzzy Clustering Method Based on Domain Knowledge" – 8th ACIS International Conference on Artificial Intelligence. 0-7695-2909-7/07 IEEE
- Saeed. R. Aghabozorgi, the Ying Wah. "Using Incremental Fuzzy clustering to Web Usage Mining", International Conference of Soft Computing and Pattern Recognition, 2009
- Omar.Y.Alshamesh, Ismail M.Romi. "Optimal Clustering Algorithms for Data Mining "International Journal Information Engineering and Electronic Business, 2013, vol-2, Pages 17 – 22.
- Mohammed Abubakar, Wesam Ashour. "Efficient Data Clustering Algorithms, Improvements over K-means", IJISA, Vol .5, No.3, February 2013.
- Deepali Aneja, Tarun kumar Rawat. "Fuzzy Clustering Algorithms for Efficient Medical Image Segmentation", IJISA, Vol.5, No.11, October 2013.
- Shashank Sharma, Megha Goel, Projhot kumar. "Performance Comparison of Various Robust Data Clustering Algorithms", IJISA, Vol.5, No.7, June 2013.
- Sunitha Chittineni, Raveendra Babu Bhogapathi. "Determining Contribution of Features in Clustering Multi – Dimensional Data Using Neural Network", IJITCS, Vol.4, No.10, September 2012.
- Raed T. Aldahdooh, Weson Ashour. "Distance based Initialization Method for K-Means Clustering Algorithm", IJISA, Vol.5, No.2, January 2013.
- Suvendu Kanungo, Somya Jaiswal. "A Framework for Mining Coherent Patterns Using Particle Swarm Optimization based Biclustering", IJISA, Vol.7, No.11, October 2015.
- Yugal kumar, G. Sahoo. "A Review on Gravitational Search Algorithm and its Applications to Data Clustering & Classification", IJISA, Vol.6, No.6, May 2014.
- T.N.Nagabhushana, Y.S. Nijagunaryao."An Effective Data mining in Symbolic data Using Incremental learning Neural Networks", Elsevier Science, June 2005.
- Saeed Khazaee, Karim Faez. "A Novel Classification Method Using Hybridization of Fuzzy Clustering and Neural Networks for Intrusion Detection", IJMECS Vol. 6, No. 11, November 2014.
