Comparative analysis of Bayes net classifier, naive Bayes classifier and combination of both classifiers using WEKA

Author: Abhilasha Nakra, Manoj Duhan
Journal: International Journal of Information Technology and Computer Science @ijitcs
Article in issue: 3 Vol. 11, 2019.
Free access
Authors here tried to use the WEKA tool to evaluate the performance of various classifiers on a dataset to come out with the optimum classifier, for a particular application. A Classifier is an important part of any machine learning application. It is required to classify various classes and get to know whether the predicted class lies in the true class. There are various performance analysis measures to judge the efficiency of a classifier and there are many tools which provide oodles of classifiers. In the present investigation, Bayes Net, Naive Bayes and their combination have been implemented using WEKA. It has been concluded that the combination of Bayes Net and Naive Bayes provides the maximum classification efficiency out of these three classifiers. Such a hybridization approach will always motivate for combining different classifiers to get the best results.
Bayes Net, Naive Bayes, WEKA, Classifiers, Supervised, Unsupervised
Short address: https://sciup.org/15016343
IDR: 15016343 | DOI: 10.5815/ijitcs.2019.03.04
Text of the scientific article Comparative analysis of Bayes net classifier, naive Bayes classifier and combination of both classifiers using WEKA
Published Online March 2019 in MECS
Classification is the method to organize the data in the efficient and effective way so that it can be used with ease. In this, data is arranged in the homogenous groups or classes. For example, a data available in a school, each student is classified according to class, name, roll number. It is easy to retrieve the data when it is arranged with proper classification. The concept of classification includes Unsupervised, Semi-Supervised and Supervised learning problems. Unsupervised learning relies upon the unlabeled information while in Supervised learning every datum input question is assigned a class mark. (Unsupervised learning depends on the unlabeled data whereas in Supervised learning each data input object is assigned a class label.) In Semi-Supervised learning problems, both labeled and unlabeled instances are available and might be of absolute significance for computation of more strong decision functions in some situations. The main objective of supervised classification is to divide the classes as wide as possible. If the variable has two values, it is known as binary classification, but if the variable has more than two values it is known as multiclass classification [1]. In this paper, data mining and machine learning tool WEKA is used for classification of data. WEKA is the data mining tool which consists of various algorithms for preprocessing, classification, clustering etc. It is funded by the New Zealand government from 1993. It is an open source and Java based software. It is used in both academic and business field. It not only provides a toolbox for already generated algorithms but also provides the platform to build new algorithms.
Here in this paper, we compare Bayes network classifier, Naive Bayes classifier and their combination using WEKA tool on the basis of correctly classified instances and numerous other parameters.
The rest of the paper organizes as follows: In section II brief review over work done in this field is presented. Section III comprises the brief review of WEKA tool. Functionalities of WEKA are explained in section IV. Dataset used for the experimental analysis is explained in the section V. Section VI enlightened about the analytical representation of the diabetic data. Section VII comprises the method of classification used in the paper. Performance evaluation measures of classifiers are explained in section VIII. In section IX result analysis for the proposed techniques is done and the comparison of the techniques is presented. Section X concludes the paper with future scope of this work.
-
II. Related Work
Robu and Hora [2] classified the four medical datasets obtained from the UCI Machine Learning Repository using data mining tool, WEKA. These are Ljubriana Breast Cancer, Heart ailment, Dermatology, and Diabetes. They have utilized the Naive Bayes, Random Forest and
ID3 as classifiers. They have given changes to the user interface which is utilization for the classification of the information and the expectations are made with the assistance of the one of a new kind of interfaces that were added to WEKA. The forecasts are tried with the engineered models and with the assistance of the customized program. The final results are good.
Duriqi R., Raca V. and Cico B., [3] have worked on three different datasets and showed which classification algorithm is best suited for the particular datasets. The classification algorithms are implemented on the WEKA tool. The first dataset is of diabetic female patients of age over 21 years and it is taken from UCI ML repository. The second dataset is spam based which is also taken from UCI ML repository. The spam could be generated by the marketing of the product, different web services, pornography etc. The third dataset is Credit approval dataset which is economical and financial in nature. It asks for if the credit request in the bank is endorsed or not. The classification algorithms used for these datasets are Naive Bayes, Random forest and K* Algorithm. After applying all three algorithms on different datasets it is concluded that the performance of a classifier depends on the number of attributes used in the dataset.
Gunasekara M. C., R.P.T.H Wijegunasekara and N. G. .Dias [5] have analyzed the four different clustering algorithms on five different datasets using WEKA tool to find out the most suitable algorithm. The four major clustering algorithms analyzed are K-means, Expectation Maximization (EM), make density based (mDB) and Hierarchical (H) clustering algorithm. The datasets used are Breast-cancer, Mushroom, Diabetics, Iris and Glass datasets. After the study of 20 results obtained it is easy to conclude that there are both advantages and disadvantages among algorithms. For large datasets, K-means or make Density Based algorithm should be used. For noisy data, a hierarchical clustering algorithm should be used. The make density-based algorithm is used for low variance data. EM algorithm is an extension of the K-means algorithm by maximizing the expectation using more iteration.
Kumar N. and Khatri S. et. al. [6] have compared completely different classification techniques and their prediction accuracy for chronic renal disorder dataset. They have analyzed J48, Naive Bayes, Random forest, SVM and K-NN classifiers by utilizing parameters, for example, ROC, Kappa statistics, RMSE, MAE, TP Rate, FP Rate, Precision, Recall and F-Measure utilizing WEKA tool. Exploratory outcomes have demonstrated that the classification accuracy of the Random Forest Algorithm is superior to other classification algorithms for chronic renal disorder dataset.
Ramzan M. [7] has analyzed the medical data using various classification algorithm to find the best algorithm for medical data using a data mining tool WEKA. The classification algorithms used are J48, Naive Bayes and Random forest. Results are compared on the basis of the time taken to build the model and its accuracy. This work shows Random Forest is the best classifier for medical data classification because it works efficiently on large datasets.
Jovic A., Brkic K. and Bogunovic N. [8] describe the six most used data mining tools that are available today. These are Rapid Miner, R, WEKA, KNIME, Orange, and scikit-learn. The comparison is done on the basis of all the parameters of data mining i.e. classification, clustering, regression, evaluation criterion, associative rules, feature selection, visualization etc. Comparing on the basis of various attributes such as developer, Programming language, license, Current version, GUI, Main reason and community support it is inferred that there is no single best tool. Each tool has its quality and shortcoming. However, RapidMiner, R, Weka, and KNIME have the greater part of the coveted attributes most for data mining.
Mitrpanont J., Sawangphol W., Vithantirawat T., and Paengkaew S. [9] have processed dialysis dataset using machine learning techniques such as KNN and Naive Bayes using WEKA and Python tools. They set three queries i.e. blood disorder, liver enzyme and dyslipidemia regarding this dataset to measure and compare the performance between Python and Weka using totally different machine learning algorithms. After analyzing the result on the basis of the number of correct/incorrect instances, precision, and Recall, it has been found out that the Python has the most effective performance. The only disadvantage of Python is large execution time.
Kaur P., Singh M. and Singh G. [10] have worked on educational data mining field and identified the slow learners among students. Dataset of 152 students is taken from a high school which is tried and applied on numerous classification algorithms like Multilayer Perception, Naive Bayes, SMO, J48 ,and REPTree by utilizing WEKA a data mining and open source tool. These classification algorithms are compared and knowledge flow model is also shown for these five classifiers. MLP (Multilayer Perception) works best in the terms of accuracy and F-measure.
Han P. ,Wang D., and Zhao Q. [11] have done an experiment on Chinese document clustering using Weka tool. The algorithm used for clustering is K-means and parameters used for evaluating the experiment are Recall, Precision, and F-measure. They have perceived out a few inadequacies of WEKA like not fit for dealing with huge information and slower speed in framework process. However, from the research point of view, WEKA is an excellent data mining tool.
Sharma A. and Kaur B. [12] have performed an experiment with two completely unique datasets by utilizing WEKA tool in view of six parameters. Authors have given some findings which can be used for future reference.
Nookala G. K. M., Pottumuthu B. K., Orsu N., and Mudunuri S. B. [13] have done a comparative analysis of 14 different classification algorithms on 3 different cancer datasets. They have found out that the accuracy of algorithms varies on the basis of the dataset used and one should not rely on the particular algorithm and try different algorithms for their dataset and select the best suited.
Mayilvaganan M.et. al. [14] have compared classification techniques to analyze the performance of students. It demonstrates the comparative analysis of C4.5 algorithm, AODE, Naive Bayes, Multi label K-Nearest Neighbor algorithm to find the accuracy using WEKA tool. They have analyzed after studying the results that the Multi-labeled K-nearest neighbor has the best accuracy. They have additionally recognized the proportion of the students who learn slowly to distinguish the negligence early and make a move to enhance the performance of the feeble student.
Verma D. and Mishra N. [15] have applied the data mining technique in the field of healthcare. They have used the different data mining techniques to identify the numerous diseases like heart disease, stroke, cancer, hypothyroid, stoke etc.. They have used the two malady datasets i.e breast cancer and diabetes from the UCI machine learning store. Naive Bayes, MLP, SMO, REP Tree, and J48 are utilized to classify diabetes and breast cancer dataset using WEKA interface. They have inferred after analyzing the outcome that the J48 is the best classification algorithm for breast cancer dataset and SMO is the best for diabetes dataset.
Priyadharshini, J. M. H., Kavitha S., and Bharathi B. [16] have studied the physical activity monitoring data which comprises 18 day to day activities with 54 occurrences that incorporate lying, sitting, standing, car driving, ironing, playing soccer and so forth. Out of these 54 activities, 5 are selected for the analysis. Classification is finished by utilizing information mining tool WEKA with the help of algorithms including J48, Naive Bayes and Random Forest. The analysis of results shows that Random Forest performs perfectly for PAMAP2 data.
-
III. Weka Tool
WEKA is a machine learning tool which consists of various implementation algorithms for data mining, preprocessing, classification and clustering along with graphical user interface. It is written in JAVA. It supports ARFF file format ,as well as various other file formats like CSV, Matlab, ASCII files and also, provides database connectivity through JDBC [17].
-
IV. Functionalities of Weka
-
A. Preprocessing
WEKA provides various supervised and unsupervised filters for preprocessing of data which remove particular attributes and also provide some advanced operations such as principal component analysis [17].
-
B. Classification
It contains more than 100 classification methods. These are Bayesian method, function-based learners, lazy method, meta method, miscellaneous methods, rule-based methods, meta-classifiers, multiple instance classifiers [17].
-
• Bayesian method: Algorithms that use Bayes Theorem like Bayesnet, Naive Bayes, Naive Bayes Simple, Naive Bayes Updateable [18].
-
• Function-based learners: Algorithms that estimate the function like LibSVM, Logistic, Multilayer Perceptron, RBF Network, Simple Logistic, SMO, SPegasos, voted perceptron.
-
• Lazy Method: Algorithms that use lazy learning like IB1, IBK, KStar, and LWL.
-
• Meta Method: Algorithms that use or combine multiple algorithms like AdaBoostM1, Attribute Selected Classifier, Bagging, Grid Search, Metacast etc.
-
• Miscellaneous Method: Implementations that do not fit into the other groups like Hyperpipes, Serialized Classifier
-
• Rules-based Method: Algorithms that use rules like Conjunctive Rule, Decision table, Ridor, ZeroR [18].
-
C. Clustering
Unsupervised learning is supported by various Clustering Schemes including cobweb, DBSCAN, EM, FarthestFirst, Filtered Clustering, Hierarchical Clustering, Make Density-based Clusterer, Optics, Simple k Means. In clustering, there is an easy way to discard undesired attributes.
-
D. Attribute Selection
Various attribute selection methods are available in WEKA CfsSubsetEval, ChiSquaredAttributeEval, and ClassifierSubsetEval etc.
-
E. Data Visualisation
Data can be analyzed visually by plotting various attributes.
-
V. Dataset
The experiment is performed on datasets available in WEKA tool itself. The main owner of this data is the National Institute of Diabetes and Digestive and kidney diseases. There are few limitations to this data. Each patient is female of at least 21 years old. The numbers of instances are 768 [19].
Attributes taken are explained below in Table 1. [19]. Table 1. consists of various attributes of data and their explanation. There are two Class distributions (Class 0 and Class 1). Class 0 is used to denote “when a patient is tested negative” and Class 1 as “when a patient is tested positive” [19].
Table 1. Attributes and their explanation
|
Serial No. |
Attribute Name |
Attribute Explanation |
|
A |
Preg |
No. of times patient gets pregnant |
|
B |
Plas |
Plasma glucose focus level |
|
C |
Pres |
Circulatory strain for diastolic(in mm hg) |
|
D |
Skin |
The thickness of triceps skin overlap(in mm) |
|
E |
Insu |
2-hour serum insulin( mU/ml) |
|
F |
Mass |
BMI- Body Mass Index((weight in kg)/(tallness in m^2)) |
|
G |
Pedi |
Function for diabetes pedigree |
|
H |
Age |
Age (in years) |
|
I |
Class |
Class variable (0 or 1) |
Table 2. consists of class distributions and number of instances for each class. Class 0 has 500 instances whereas class 1 has 268 instances.
Table 2. Class distributions and Number of instances
|
Class Value |
Number of instances |
|
0 |
500 |
|
1 |
268 |
-
VI. Analytical Representation of Diabetic Data
Analytical representation consists of mean and standard deviation. Here in this research, we are using diabetic data present in WEKA tool. Table 3. shows the attribute and their statistical analysis which comprises mean and standard deviation for various attributes.
Table 3. Statistical Analysis of Diabetic Data [19].
|
Attribute Number |
Mean |
Standard Deviation |
|
1. Preg |
3.8 |
3.4 |
|
2. Plas |
120.9 |
32.0 |
|
3. Pres |
69.1 |
19.4 |
|
4. Skin |
20.5 |
16.0 |
|
5.Insu |
79.8 |
115.2 |
|
6. Mass |
32.0 |
7.9 |
|
7. Pedi |
0.5 |
0.3 |
|
8.Age |
33.2 |
11.8 |
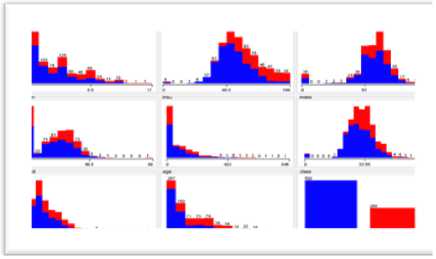
Fig.1, shows the statistical analysis of data in graphical form which leads to the easy comparison of mean and standard deviation values of various attributes.
-
VII. Classification
Classification is used for data mining that allow items in the classes. It comes under the predictive method. The principal aim of this process is to predict the aimed class for all the cases of information. The most simple classification problem is the binary classification in which aimed attribute has two possible values whereas multiclass targets have more than two values. Classification power of a system is how well it can distinguish one feature from the other. So there is a need to classify features using Classifiers so the classification power of the classifiers is well known. In this paper, Bayesian Classifier, Naive Bayes Classifier and their combination have been discussed and analyzed which one will give better classification results.
-
A. Bayesian Classifier
It provides structured, a graphical representation of probabilistic relationships between several random variables.
It is based on the Bayes theorem. Bayes theorem is a technique to find out the probability of a hypothetical data based on its already given probability, the probability of observing the data and the data itself [20].
B p ()
p (-) = p ( A ) A (1)
B p ( B )
p(A) = prior probability of hypothesis A.
p(B) = prior probability of training data B.
A
p( ) = probability of A when B is given.
p( ) = probability of B when A is given.
A
Here A is data and B is hypothesis
Fig.2, shows the values of classifier output for Bayes Net classifier. It classifies 78.5441% of the correct instances and 21.4559% of the incorrect instances.
-
B. Bayesian Networks (BNs)
Let the set of variables is defined as
A = { У1,У2,У 3............ Ут } , m - 1. (2)
Fig.1. Statistical Analysis of Data.
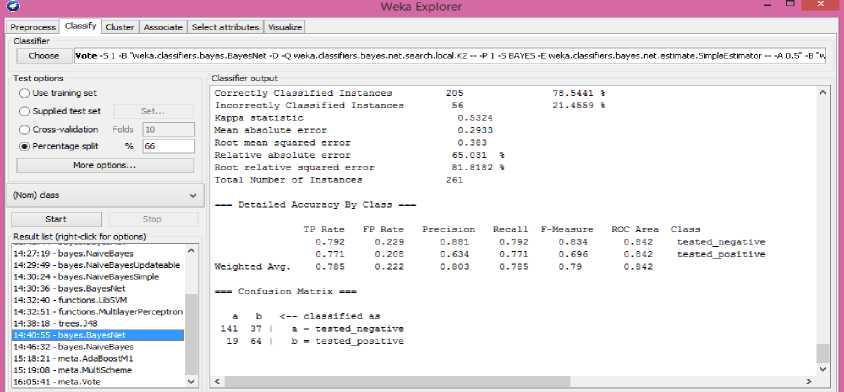
Fig.2. Classification of Data using the Bayes Net Classifier
Bayesian Networks (BNs) over a set of variables A is a network structure b$ , which is a directed acyclic graph over A [21].
BNs are useful for:
-
1. Prediction
-
2. Classification
-
3. Decision-making
Fig.3, shows the network structure of Bayesian classifier which is a probabilistic graphical model that represents a set of variables and their conditional dependencies. This can be seen in Weka classifier graph visualizer.
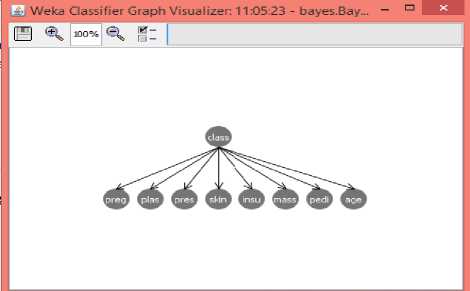
Fig.3. Network structure of Bayesian
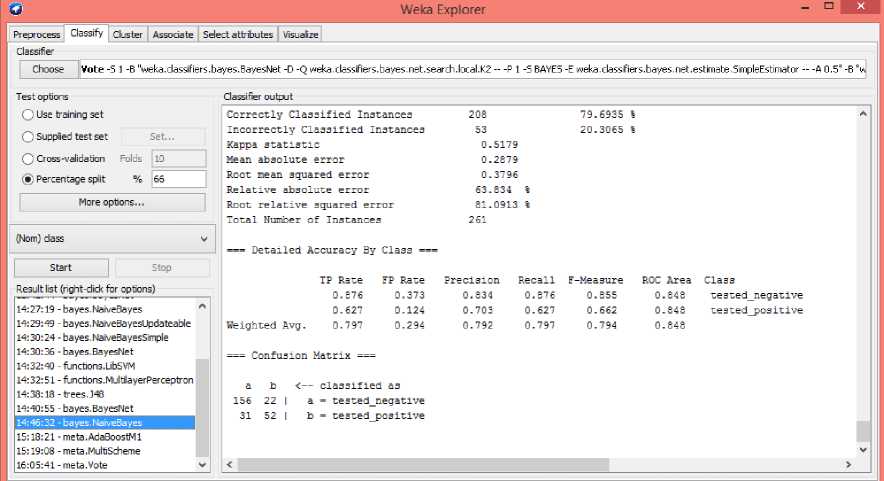
Fig.4. Classification of data using Naive Bayes Classifier
-
C. Naive Bayes Classifier
Bayesian theorem, which is discussed in above section, is the base for the Naive Bayes Classifier. These are normally used when the input dimensions are high.
Method of maximum likelihood is used as the parameter estimation method in this technique. It is mostly required in complex real-world situations. The size of data used for training and to estimate the parameters is small [20].
Fig.4, shows the values of classifier output for Naive Bayes classifier. It classifies 79.6935% of the correct instances and the 20.3065% of the incorrect instances.
-
D. Combination of Bayes Net and Naive Bayes Classifiers
can be combined using voting technique under the meta tab in classifiers.
Fig. 5, shows classification output of data using combination of Bayes Net and Naive Bayes classifiers. It
Classifies 81.2261% of correct instances and 18.7739% of incorrect instances.
In WEKA, two or more classifiers can be combined
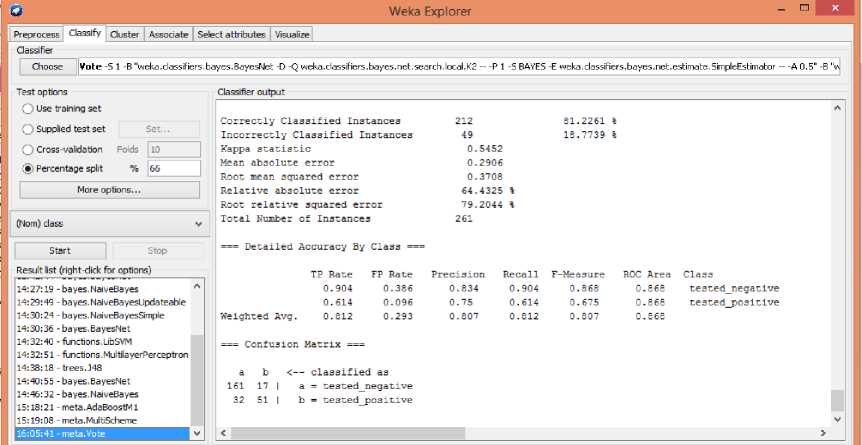
Fig.5. Classification using combination of Bayes Net and Naive Bayes classifier
-
VIII. Performance Evaluation
There are various performance evaluation measures which can be used to analyze the performance of classifiers. These measures are explained below:
-
A. TP Rate
TP rate is defined as the true positive rate [21].
Correctly Predicted cases of low weight Total Positive cases
-
B. FP Rate
FP Rate is a false positive rate. It consists of those instances which are classified as class A but does not belong to class A [21].
-
C. Precision
It comprises the objects that generally have class A among all those which were classified as class A.
Diagonal element
Precision =
Sum over the relevant column in confusion matrix
-
D. F-Measure
It is a combined measure of precision and recall [21].
2 x Recall x Precision
F-Measure = (5)
(Recall+Precision)
-
E. Confusion Matrix
Another name for the confusion matrix is the contingency table. If there are two classes, 2*2 matrixes is generated. The correctly classified instances are denoted by the sum of diagonals, all others are incorrectly classified.
-
F. ROC curve
It stands for the Receiver Operating Characteristic curve. It is a graph between true positive rate and false positive rate. Y-axis is used for plotting TP rate and X-axis is used for plotting FP rate. It shows the error tradeoffs of a given classifier [22].
-
IX. Result
In this experiment, Cross Validation method is used for the analysis of the data. During this work, dataset used is tested and analyzed with Bayesnet, Naive Bayes and combination of both on the basis of a) True Positive rate b) False Positive rate c) Precision d) Recall e) F-Measure f) Region of Convergence and all the statistical results are provided in table 2. All data available is a weighted average. In this work, analysis of classifiers is also done on the basis of the number of instances classified correctly. Table 4. shows the values of classifiers’ performance evaluation measures for Bayes net, Naive Bayes and their combination.
Table 4. Statistical analysis of classifiers with Cross-validation
|
Classifiers |
TP Rate |
FPRate |
Precision |
Recall |
F-Measure |
ROCArea |
|
Bayes Net |
0.785 |
0.222 |
0.803 |
0.785 |
0.79 |
0.842 |
|
Naive Bayes |
0.797 |
0.294 |
0.792 |
0.797 |
0.794 |
0.848 |
|
Combination of Bayes Net & Naive Bayes |
0.812 |
0.293 |
0.807 |
0.812 |
0.804 |
0.868 |
Table 5. shows the analysis of the percentage of the correct and incorrect classified instances. More the correctly classified instances, better the classifier is.
Table 5. Analysis of the percentage of classified instances of three classifiers
|
Bayes Net Classifier (in percentage) |
Naive Bayes Classifier( in percentage) |
Combination of Bayes Net and Naive Bayes Classifier(in percentage) |
|
|
Correctly Classified Instances |
78.5441 |
79.6935 |
81.2261 |
|
Incorrect Classified Instances |
21.4559 |
20.3065 |
18.7739 |
From the above table, we can conclude that the combination of Bayes net and Naive Bayes Classifier provides maximum classified instances. Therefore, combination of Bayes Net and Naive Bayes provides the best result out of these three classifiers.
Fig.6, shows the graphical representation of above table using which analysis can be done easily.
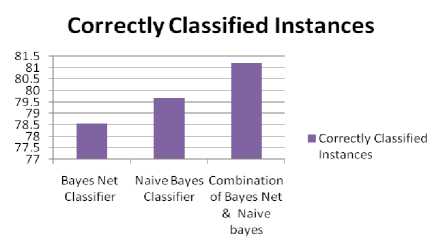
Fig.6. Comparison of Classifiers on the basis of properly Classified instances.
From the above figure, we can analyze that the combination of the Bayes Net and Naive Bayes classifier provides maximum classified instances.
-
X. Conclusion
This work performed a comparative analysis of Bayes Net, Naive Bayes and combination of these two classifiers to see which one will give the best result using the diabetic patients’ data available in WEKA tool only.
The result shows that the combination of Bayes Net and Naive Bayes provides the better result than using these classifiers individually. Thereby, proposing a framework to choose the better classifier. However, further work can be carried out on different datasets and using different classifiers in WEKA tool or other data mining tool. We can use this combination in data mining which is mostly required in medical, banking, stock market and various other areas.
References Comparative analysis of Bayes net classifier, naive Bayes classifier and combination of both classifiers using WEKA
- M. Pérez-ortiz, S. Jiménez-fernández, and P. A. Gutiérrez, “A Review of Classification Problems and Algorithms,” https://doi.org/10.3390/en9080607, vol. 9 MDPI Ene, pp. 1–27, 2016.
- R. Robu and C. Hora, “Medical Data Mining with extended WEKA,” in INES 2012 - IEEE 16th International Conference on Intelligent Engineering Systems, Proceedings, 2012, pp. 347–350, https://doi.org/10.1109/INES.2012.6249857
- R. Duriqi, V. Raca, and B. Cico, “Comparative Analysis of Classification Algorithms on Three Different Datasets using WEKA,” 2016, http://dx.doi.org/10.1109/MECO.2016.7525775
- A. K. Pandey and D. S. Rajpoot, “A Comparative Study of Classification Techniques by utilizing WEKA,” IEEE, pp. 219–224, 2016, https://doi.org/10.1109/ICSPCom.2016.7980579
- M. C. Gunasekara, R.P.T.H Wijegunasekara and N. G. . Dias, “Comparison of Major Clustering Algorithms Using Weka Tool,” in International Conferences on Advances in ICT for Emerging Regions, 2014, p. 1, 10.1109/ICTER.2014.7083930
- N. Kumar and S. Khatri, “Implementing WEKA for Medical Data Classification and Early Disease Prediction,” IEEE Int. Conf. "Computational Intell. Commun. Technol., vol. 3rd, pp. 1–6, 2017, https://doi.org/10.1109/CIACT.2017.7977277.
- M. Ramzan, “Comparing and Evaluating the Performance of WEKA Classifiers on Critical Diseases,” IEEE, pp. 1–4, 2016, https://doi.org/10.1109/IICIP.2016.7975309
- A. Jovic, K. Brkic, and N. Bogunovic, “An Overview of Free Software Tools for General Data Mining,” MIPRO, no. May, pp. 1112–1117, 2014, https://doi.org/10.1109/MIPRO.2014.6859735.
- J. Mitrpanont, W. Sawangphol, T. Vithantirawat, and S. Paengkaew, “A Study on Using Python vs Weka on Dialysis Data Analysis,” Int. Conf. Inf. Technol., vol. 2nd, pp. 0–5, 2017, https://doi.org/10.1109/INCIT.2017.8257883.
- P. Kaur, M. Singh, and G. Singh, “Classification and Prediction based Data Mining Algorithms to Predict Slow Learners in Education Sector,” Elsevier IRCTC, vol. 57, pp. 500–508, 2015.
- P. Han, D. Wang, and Q. Zhao, “The Research on Chinese Document Clustering based on Weka,” Int. Conf. Mach. Learn. Cybern., pp. 10–13, 2011.
- A. Sharma and B. Kaur, “A Research Review on Comparative Analysis of Data Mining Tools , Techniques and Parameters,” Int. J. Adv. Res. Comput. Sci., vol. 8, no. 7, pp. 523–529, 2017, http://dx.doi.org/10.26483/ijarcs.v8i7.4255.
- G. K. M. Nookala, B. K. Pottumuthu, N. Orsu, and S. B. Mudunuri, “Performance Analysis and Evaluation of Different Data Mining Algorithms used for Cancer Classification,” Int. J. Adv. Res. Artif. Intell., vol. 2, no. 5, pp. 49–55, 2013, https://doi.org/10.14569/ijarai.2013.020508
- M. Mayilvaganan and D.Kalpanadevi, “Comparison of Classification Techniques for Predicting the Performance of Students Academic Environment,” Int. Conf. Commun. Netw. Technol., pp. 113–118, 2014, http://dx.doi.org/10.1109/CNT.2014.7062736
- V. Deepika. and N. Mishra, “Analysis and Prediction of Breast Cancer and Diabetes Disease Datasets using Data Mining Classification Techniques,” 2017 Int. Conf. Intell. Sustain. Syst., no. Iciss, pp. 533–538, 2017, https://doi.org/10.1109/iss1.2017.8389229
- J. M. H. Priyadharshini, S. Kavitha, and B. Bharathi, “Classification and Analysis of Human Activities,” Int. Conf. Commun. Signal Process., pp. 1207–1211, 2017, https://doi.org/10.1109/iccsp.2017.8286571
- R. R. Bouckaert et al., “WEKA Manual for Version 3-7-8,” Univ. WAIKATO, pp. 1–327, 2013, papers3://publication/uuid/24E005A2-AA1B-4614-BAF5-4D92C4F37413,
- J. Brownlee, “How to Use Machine Learning Algorithms in Weka,” 2016. [Online]. Available: https://machinelearningmastery.com/use-machine-learning-algorithms-weka/,2:30pm,14th May 2018
- “http://storm.cis.fordham.edu/~gweiss/data-mining/weka-data/diabetes.arff,” 1990. [Online]. Available: http://storm.cis.fordham.edu/~gweiss/data-mining/weka-data/diabetes.arff,2:30 pm 14thMay2018
- K. Chai, H. T. Hn, and H. L. Cheiu, “Naive-Bayes Classification Algorithm,” Bayesian Online Classif. Text Classif. Filter., pp. 97–104, 2002.
- R. R. Bouckaert et al., “WEKA - Experiences with a Java Open Source Project,” J. Mach. Learn. Res., vol. 11, pp. 2533–2541, 2010.
- J. M. David and K. Balakrishnan, “Significance of Classification Techniques in Prediction of Learning Disabilities,” vol. 2576253, p. 10, 2010, https://doi.org/10.5121/ijaia.2010.1409
