Comparative analysis of characteristics of electrodes to estimate accuracy in recording long-term ECG signal parameters

Author: Altay Yeldos A., Kremlev Artem S., Nuralinov Omirbek M., Vlasov Sergei M., Penskoi Aleksandr V., Zimenko Konstantin A., Margun Alexey A.
Journal: Cardiometry @cardiometry
Section: Original research
Article in issue: 15, 2019.
Free access
This paper presents some results of a comparative analysis of characteristics of electrodes to estimate the accuracy of recording long-term ECG signal parameters. To obtain the characteristics of the analyzed electrodes of various types, the resistance values of the contact conductive substance of each of them were measured. The relationship of the measured characteristics of the electrodes is analyzed, and the accuracy of recording ECG signal parameters, using the basics of statistical decisions, is estimated. The analysis results show that the harder the contact conductive substance of the electrodes, the more accurately recorded ECG signal parameters.
Long term ecg signal monitoring, ecg signal parameter analysis, statistical data processing, ecg electrodes
Short address: https://sciup.org/148311456
IDR: 148311456 | DOI: 10.12710/cardiometry.2019.15.6372
Text of the scientific article Comparative analysis of characteristics of electrodes to estimate accuracy in recording long-term ECG signal parameters
Yeldos A. Altay, Artem S. Kremlev, Omirbek M. Nuralinov, Sergei M. Vlasov, Aleksandr V. Penskoi, Konstantin A. Zimenko, Alexey A. Margun. Comparative analysis of characteristics of electrodes to estimate accuracy in recording long-term ECG signal parameters. Cardiometry; Issue 15; November 2019; p.63-72; DOI: 10.12710/ cardiometry.2019.15.6372; Available from:
Long-term ECG signal parameter monitoring is used today as the main method for detecting sudden and hidden forms of disturbances in the normal functioning of the heart rhythm [1-3]. This method allows recording the heart bioelectric activity for 12 and 24 hours, in some cases it is used to record the heart activity even for 72 hours [1-3]. An analysis of long-term recordings of ECG signals is carried out by measuring its amplitude-time parameters using computerized algorithms for primary and secondary data processing [4-6]. As a rule, the veracity of these algorithms is highly dependent on the quality and the quantity of the electrodes used, which are responsible for the ECG signal formation against the background of interference. It is known that during recording, in acquisition of the ECG signals, additive interference of various origin and intensities occurs, the analysis of which is well described in [7,8].
Our survey of the scientific literature [9-17] made it possible to classify the electrodes of long-term recording of ECG signals into three types: dry, capacitive, and wet. The listed types of electrodes differ among themselves in some features. We briefly review that the dry and capacitive electrodes of the ECG signals are very susceptible to causing their own interference, similar to motor disturbances (interference, artifacts) [12-15]. The presence of such interference can lead to difficulties in recognizing motor interference during the selection of a specific algorithm for the primary processing (filtering) of long-term recording data. In addition, the capacitive sensor circuit is based on a high-pass filter, which, recording the information signal by itself, can distort it at low frequencies, which may require additional correction of ECG signal parameters [9, 10, 15]. Such a distortion of the recorded signal can be interpreted as variations in frequency response of the recording channel. At the same time, it was noted in [13–15] that the degree of development and introduction of dry electrodes is not very high due to the need for additional studies to identify the significance of their practical use.
According to numerous studies, capacitive electrodes, unlike dry electrodes, are attached to certain specific human clothing while recording long-term ECG signals, since they have high sensitivity. The results of using capacitive electrodes for recording long-term ECG signals are presented in more detail in [16, 17].
Issue 15. November 2019 | Cardiometry | 63
The wet electrodes are deprived of the above listed features of the dry and capacitive electrodes. Due to their good adhesive ability and wet contact conductive substance (CCS), they are widely used at present. However, the veracity of long-term recording ECG signals [2,3] also depends on their quality, which confirms their relevance for our analysis.
Our survey of the earlier reference literature [18] allows us to note that to improve the quality of recording long-term ECG signals, a layer of special paste can be placed on top of wet electrodes to reduce the interelectrode resistance, including the resistance of the skin-electrode transitions. This technology, however, during long recordings, strongly distorts the signals parameter due to the formation of a double electric layer at the electrode surface. On this basis, in [19], to measure the resistance of the skin-electrode transitions, it was proposed to use a circuit diagram, where, for the synthesis of parameters, it is necessary to take into account the actual thickness of a layer of the human skin. With this estimation, the greatest difficulty is the assessment of the actual thickness of the skin layer, which is individual in each human subject. At the same time, in [20], tendencies to the use of wet electrodes were noted and introductory remarks were made on their use for long-term recording of ECG signals. Also, in the same work, a method for estimating the quality of suction cup metal electrodes for short-term recording of ECG signals is proposed. The quality assessment of suction cup electrodes in the work was determined with the use of specialized physicochemical solutions, where the electrodes were submerged in the isotonic solution followed by measuring their resistance with a multimeter to obtain the required characteristics. More detailed results of this study are presented in [20].
Thus, our survey of the above works reveals that a quantitative assessment of the quality for wet electrodes in long-term recording ECG signals in the reference literature has not been adequately addressed. Therefore, this article is devoted to an analysis of their characteristics. Here we analyze the results of measurements of the resistance of contact conductive substance (CCS) of the wet electrodes and their relationship with veracity of ECG signal parameter recording.
Aim
We have formulated our aim hereof as follows: a comparison of the characteristics of the electrodes to 64 | Cardiometry | Issue 15. November 2019
estimate the accuracy of the recording parameters of long-term ECG signals.
Materials and methods
In the study, to assess the accuracy of the recording, 4 different types of wet electrodes were included, which differed from each other in CCS. To estimate the recording quality, we selected the following widely used wet electrode models: “H92SG”, “H99SG”, “MS-GLT-05MGRT” and “M2202A”. Our analysis of the CCS characteristics of the wet electrodes was carried out after measuring the resistance values, using a digital multimeter (10 electrodes of each of the above models). To achieve the aim of the study, the analysis of the characteristics of the electrodes was carried out in 3 stages, as designed below.
Stage 1. To estimate the drying time of the contact conductive substance electrodes after opening. Evaluation of the CCS drying time was carried out by measuring the electrical resistance of each of the 10 electrodes used for half an hour at an interval of every 10 minutes.
Stage 2. Estimate contact conductive substance electrodes with long contact with the skin. At this stage, wet electrodes, which are most resistant to drying after opening, are analyzed (according to the results from stage 1). The stage offers an analysis of CCS of the selected electrodes upon 12 and 24 hours of their activity on the surface of the human skin. At this stage, quantitative characteristics have been collected from 20 electrodes from each of the two manufacturers. These electrodes were separated into two groups, 10 pieces in each, to assess their 12- and 24-hour activity. The total number covered 40 electrodes. The reference value of the resistance of the CCS electrodes before their attachment to the surface of the human skin was measured with a multimeter and then was compared with the resistance identified upon their 12- and 24-hour activity on the skin surface. The measurements of the values and the attachment procedures of the electrodes were performed under the same conditions in the absence of any extraneous factors, which might affect the experiment conducted.
Statistical processing of measurement data
Statistical processing of the measured resistance values obtained in stages 1 and 2 was carried out at a confidence level of P=0.95 with a significance level α=0.05. This significance level was chosen taking into account the fact that in engineering systems and biomedical measurements these values are in most common use, for example [21-25]. The results of resistance measurements for the selected confidence probability P=0.95 were recorded by calculating the following statistical indicators [21-23]:
— x 1 + x 2 + x 3 + ... + x n
X =------------ n
n
^ x = T Е ( x- X )2,
V n - 1 7 =1
n
Е x i=1
, n
■■ = л Е ( x - X )2, (3)
n = 1
A x ( P ) = ± a x • t a = 0-05 , „ - 1 , (4)
where: x – measured values, X – mean value measurement result, n – the number of measurements, σ – mean square error of measurement, σx – mean square error of arithmetic mean value X , Δx(P) – confidence interval for random measurement error, tα=0,05 – Student's quantile of distribution at (n-1) for confidence probability P=0,95. Similarly to the above formulas (1) – (4), for the resistance values of 10 electrodes, the following is obtained:
R
R = R1 + R 2 + R з + ... + Ню Е
10 10 ’
I ( r - R )2 + ( R - R )2 + ... + ( r10 - R )2
^ =\ —:----------------------
R V 9
CT R =
( R 1 - R )2 + ( R 2 - R )2 + ... + ( R 10 - R )2 710
A R ( P ) 0,5 - ^ • 2,26, _ (8) where R – measured resistance values, R – mean value resistance, n – measurement numbers, σ R – mean square error measurements R , σ R – standard deviation arithmetic mean value R, Δ x(P) – confidence interval for random measurement error resistance, t α=0,05 = 2,26 – the table value of the quantile of the Student distribution at (n-1) for t α=0,05 at P=0,95 [21, 22].
Stage 3. To estimate of the probability of accurate recording of parameters of long-term ECG signals. A comparative analysis of the probabilistic estimates of the accurate recording of ECG signal parameters was carried out using 4 types of selected wet electrodes at the experimental level. To obtain an adequate and more reliable estimate of recording of long-term ECG signals, the 12-lead INCART Holter Monitor was used. The long-term 12 lead-recording of the signals, using the selected monitor, allows us to reliably record low-amplitude portions due to a multi-bit ana-log-to-digital converter with a sampling frequency of 1000 Hz [26.27].
Long-term ECG signals were recorded in a human individual in an upright position in the absence of physical activity. For an extended estimate of the accuracy of recording ECG signals, the number of reliably and erroneously recorded signal parameters was calculated relative to the total number of records. The P-waves, the T-waves, and the QRS complexes of the ECG signals were taken in consideration as the recorded parameters for the purpose of the calculation. For the probabilistic estimate of the recording accuracy of the above listed parameters, the following statistical indicators were used [28]:
P = NL - 100% T N
P = NF- - 100% F
where NT – the number of true recorded signal parameters, NF – the number of false recorded signal parameters, N — the total number of analyzed signal parameters.
A graphical representation of the measured and calculated data, namely, in the form of a box plot for the resistance values, a histogram of true and false signal recording, and the construction of the violin plot of P waves were completed utilizing the Python Graphing Library, Plotly [29].
Results and Discussion
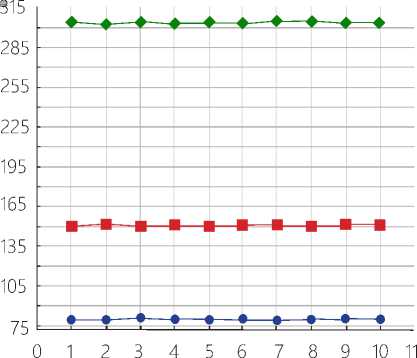
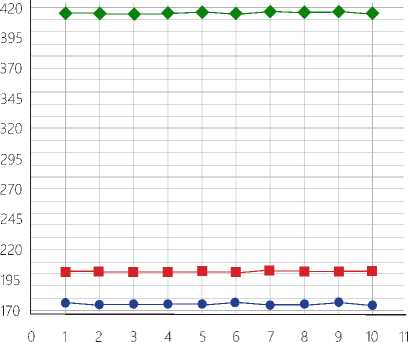
The results of measuring the resistance values, when estimating the drying time of the CCS electrodes, were obtained by the direct measurement method. Figures 1 and 2 herein show the CCS resistance of wet electrodes of selected types; the numbers from 1 to 3 indicate the measurement results 10, 20 and 30 minutes after opening, respectively. Statistical processing of the obtained numerical values for the selected confidence probability is presented in Table 1 herein.
An analysis of the results allows us to put forward our proposition that the values of the CCS resistance between the measurements of wet electrodes “H92SG” and “H99SG” have a significantly greater tendency to increase than those for the
Issue 15. November 2019 | Cardiometry | 65
ECG electrodes, N
-^ 1 —■— 2 -•- 3
ECG electrodes, N
b)
Figure 1. Contact conductive substance resistance of wet electrodes. a) "H92SG"; b) "H99SG"
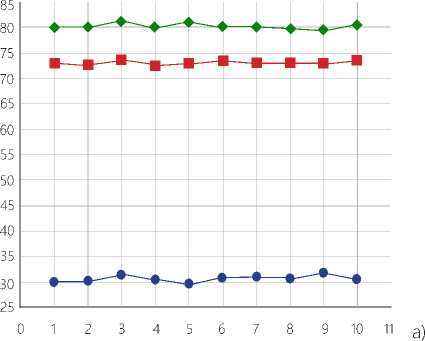
Table 1. Resistance values of contact conductive substance wet electrodes
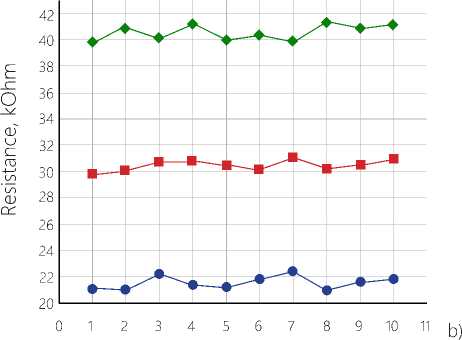
Figure 2. Contact conductive substance resistance of wet electrodes. a) «MSGLT-05MGRT»; b) «М2202А»
|
No. |
Electrode types |
The measurement result for the confidence probability P=0,95 (a=0.05 - ta ,9=2,26; n-1) |
||
|
RI , kOhm |
RII , kOhm |
RIII , kOhm |
||
|
1 |
H92SG |
(79,348±0,313) |
(150,316±0,385) |
(303,556±0,407) |
|
2 |
H99SG |
(174,46±0,452) |
(201,471±0,305) |
(414,598±0,409) |
|
3 |
MSGLT-05MGRT |
(30,623±0,443) |
(73,009±0,266) |
(80,163±0,384) |
|
4 |
М2202А |
(21,523±0,359) |
(30,458±0,297) |
(40,527±0,414) |
“MSGLT-05MGRT” and “M2202A”electrodes. This can be estimated by the arithmetic mean values of the CCS resistance for the selected types of wet electrodes. The true (arithmetic mean) values of the CCS resistance with a confidence probability of P=0.95 for the H92SG and H99SG electrodes were 79.348 kOhm and 174.46 kOhm for the first measurement, 150.316 kOhm and 201.471 kOhm for the second measurement and 303.556 kOhm, respectively, and 414.598 kOhm for the third measurement case. The true (arithmetic mean) values of the CCS resistance for the MSGLT-05MGRT and M2202A electrodes with a confidence probability of P=0.95 were 30.623 kOhm and 21.523 kOhm for the first measurement, 73.009 kOhm and 30.458 kOhm for the second measurement and 80.163 kOhm, respectively, and 40.527 kOhm for the third measurement case. The high variability of the true (arithmetic mean) values of the CCS resistance between measurements for the H92SG and H99SG electrodes, in comparison with the MSGLT-05MGRT and M2202A electrodes, shows their quick drying after opening.
The true (arithmetic mean) values of the contact conductive substance resistance for electrodes “MS-
Control 12 Control 24 a)
Time, h
Figure 3. Long-term study of CCS wet electrodes. a) "MSGLT-05MGRT"; b) "M2202A"
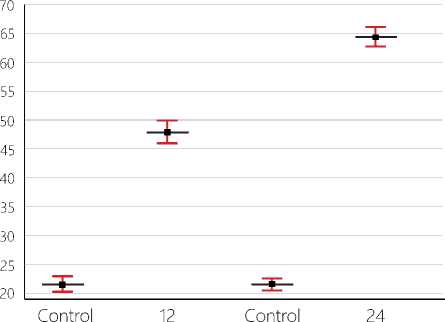
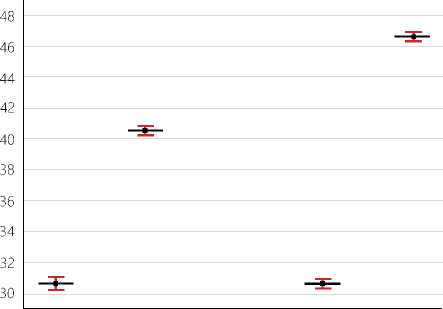
GLT-05MG” and “М2202А” between the first, second and third measurements show less variability. On average, the CCS resistance for the last two types of wet electrodes is not more than 100 kOhm (see, for example, Table 1). The last two proven wet electrode types were selected to analyze their quantitative characteristics in long-term use for 12 and 24 hours. The obtained quantitative values are presented in Figures 3 and 4 and in Table 2 herein.
The obtained graphic (Figure 3) and statistical processing results (Table 2) demonstrate that the resistance values of the CCS electrodes of the MSGLT-05MGRT electrodes after 12 and 24 hours (40.538 kOhm and 46.620 kOhm) have insignificant differences, whereas the resistance values of CCS for electrodes “M2202A” (47.879 kOhm after 12-hour activity, 64.350 kOhm after 24-hour activity on the skin surface) show very significant differences in comparison with the reference values. The values of the true (arithmetic mean) resistance of the CCS for the confidence probability P=0.95 are presented in Table 2 herein.
Besides, the fact that there is a difference in the measured values of the CCS resistance during long-term studies for the "MSGLT-05MGRT" and "M2202A" electrodes is explained by the harder or liquid state of the CCS. Electrodes with the liquid CCS during contact with the skin in long-term studies show a tendency to change their control characteristics, which can be interpreted due to spreading of CCS over the established area in the measuring cell of the electrode. This can be confirmed by the calculated values of the random error according to the criterion ± tσ for a confidence probability of P=0.95, see Table 2 herein. The greater the value of this criterion, the wider the border of the whiskers of the box plot, and, as a
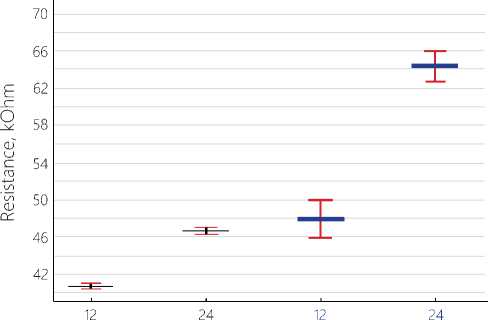
Time, h
Figure 4. Difference in characteristics between two wet ECG electrodes consequence, the greater the error associated with the spreading of liquid CCS during long-term studies, see Figure 4 herein. The measurement results for the electrodes with solid CCS, namely for “MSGLT-05MGRT”, demonstrate the smallest value of the ±tσ criterion, and the narrowness of the whiskers boundaries (box plot) shows the smallest spreading of the CCS during long-term studies (see Figure 4 herein).
An analysis of the relationship of the above characteristics of the resistance of the CCS wet electrodes was performed together with the estimate of the veracity of recording of long-term ECG signal parameters. Using a Holter monitor, the 12-lead long-term ECG signals were recorded with the use of the studied of electrode types, each recording consisted of 81 cardiac cycles. All recorded signals were manually calculated for the number of authentically and erroneously recorded waves P, T, and the QRS complexes, then using (9) and (10) the probability of true and false recording of each signal element was calculated. The calculated probability values for various electrodes are presented in Table 3 herein.
Table 2. Resistance of CCS electrodes for12 and 24 hours
|
No. |
Electrode types |
The measurement result for the confidence probability (α=0.05 → tα ,9 =2,26) |
|||
|
R control, kOhm |
R12 hours, kOhm |
R control , kOhm |
R24 hours, kOhm |
||
|
1 |
MSGLT-05MGRT |
(30,624±0,153) |
(40,538±0,095) |
(30,622±0,106) |
(46,620±0,121) |
|
2 |
М2202А |
(21,531±0,440) |
(47,879±0,740) |
(21,520±0,328) |
(64,350±0,609) |
Table 3. Assessment of the probabilities of veracity and erroneous recording of leads
|
No. |
V1 |
V2 |
V3 |
V4 |
V5 |
V6 |
I |
III |
aVR |
aVF |
II |
aVL |
|
|
PT(P), % |
* |
65,4 |
64,1 |
75,3 |
53,1 |
61,7 |
70,3 |
67,9 |
62,9 |
67,9 |
61,8 |
58,1 |
67,9 |
|
** |
80,2 |
70,4 |
85,1 |
86,4 |
88,8 |
85,1 |
54,3 |
77,7 |
86,4 |
79,9 |
83,4 |
74,1 |
|
|
*** |
95,1 |
93,9 |
97,5 |
96,2 |
93,9 |
95,1 |
96,2 |
92,5 |
95,1 |
97,5 |
93,8 |
96,2 |
|
|
**** |
70,4 |
74,1 |
87,6 |
88,8 |
79,1 |
74,1 |
54,3 |
69,1 |
92,5 |
88,8 |
70,3 |
90,1 |
|
|
PF(P), % |
* |
34,6 |
35,9 |
24,7 |
46,9 |
38,3 |
29,7 |
32,1 |
37,1 |
32,1 |
38,2 |
41,9 |
32,1 |
|
** |
19,8 |
29,6 |
14,9 |
13,6 |
11,2 |
14,9 |
45,7 |
22,3 |
13,6 |
20,1 |
16,6 |
25,9 |
|
|
*** |
4,9 |
6,1 |
2,5 |
3,8 |
6,1 |
4,9 |
3,8 |
7,5 |
4,9 |
2,5 |
6,2 |
3,8 |
|
|
**** |
29,6 |
25,9 |
12,4 |
11,2 |
20,9 |
25,9 |
45,7 |
30,9 |
7,5 |
11,2 |
29,7 |
9,9 |
|
|
PT(QRS), % |
* |
100 |
100 |
100 |
100 |
100 |
100 |
100 |
100 |
100 |
100 |
100 |
100 |
|
** |
100 |
100 |
100 |
100 |
100 |
100 |
100 |
100 |
100 |
100 |
100 |
100 |
|
|
*** |
100 |
100 |
100 |
100 |
100 |
100 |
100 |
100 |
100 |
100 |
100 |
100 |
|
|
**** |
100 |
100 |
65,5 |
100 |
100 |
100 |
100 |
100 |
100 |
100 |
100 |
100 |
|
|
PF(QRS), % |
* |
0 |
0 |
0 |
0 |
0 |
0 |
0 |
0 |
0 |
0 |
0 |
0 |
|
** |
0 |
0 |
0 |
0 |
0 |
0 |
0 |
0 |
0 |
0 |
0 |
0 |
|
|
*** |
0 |
0 |
0 |
0 |
0 |
0 |
0 |
0 |
0 |
0 |
0 |
0 |
|
|
**** |
0 |
0 |
34,5 |
0 |
0 |
0 |
0 |
0 |
0 |
0 |
0 |
0 |
|
|
PT(T), % |
* |
100 |
100 |
100 |
100 |
100 |
100 |
100 |
100 |
100 |
100 |
100 |
100 |
|
** |
100 |
100 |
100 |
100 |
100 |
100 |
85,1 |
100 |
100 |
100 |
100 |
100 |
|
|
*** |
100 |
100 |
100 |
100 |
100 |
100 |
100 |
100 |
100 |
100 |
100 |
100 |
|
|
**** |
100 |
100 |
100 |
100 |
100 |
100 |
100 |
100 |
100 |
100 |
100 |
100 |
|
|
PF(T), % |
* |
0 |
0 |
0 |
0 |
0 |
0 |
0 |
0 |
0 |
0 |
0 |
0 |
|
** |
0 |
0 |
0 |
0 |
0 |
0 |
14,9 |
0 |
0 |
0 |
0 |
0 |
|
|
*** |
0 |
0 |
0 |
0 |
0 |
0 |
0 |
0 |
0 |
0 |
0 |
0 |
|
|
**** |
0 |
0 |
0 |
0 |
0 |
0 |
0 |
0 |
0 |
0 |
0 |
0 |
|
Note. The results of calculating the probabilities for the electrodes are indicated. Legend: * H92SG, **H99SG, ***MSGLT-05MGRT, ****М2202А.
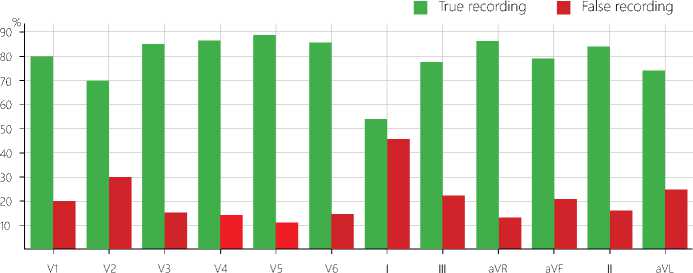
The obtained results of the probability calculations show that in all records of real 48 long ECG signals, the main share of erroneous recording (formation) refers to the P waves of the signal, errors, which are found for all leads. It is known that the complexity of the reliable recording of the morphology of a given wave is determined by its low-amplitude feature in comparison with QRS complexes and T-waves [30]. It is important to note that of all the records of the analyzed leads only for leads V3 and I there is a recording error for the QRS complexes and the T waves, which make up 34.5% and 14.9% of all signal elements. In Table 3 you can also see that an error in the recording of these parameters in the study was found for electrodes with the liquid CCS.
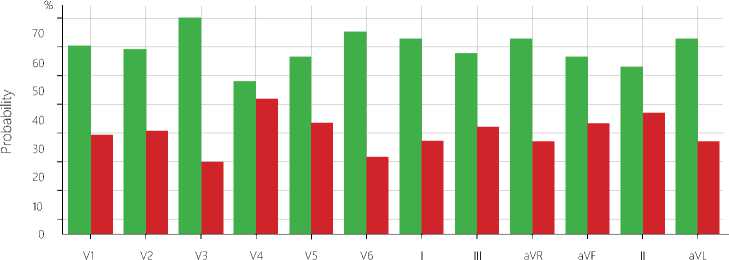
Thus, it will be advisable to present the share of the true and false recordings of P wave morphologies of the ECG signal for each lead in the form of a histogram. The histograms of the obtained estimates are presented in Figures 5-8 herein.
Figures 9, 10 show a violin plot showing the distribution of the share of true and false recordings of P wave morphologies of the ECG signals for all leads recorded by the analyzed types of wet electrodes. It is important to note that in Figure 9 the data distribution is presented without leads aVL, II. The feasibility of such
I True recording
I False recording
ECG leads
Figure 5. Histogram of the recording of P wave morphology of ECG signals of electrodes "H92SG"
ECG leads
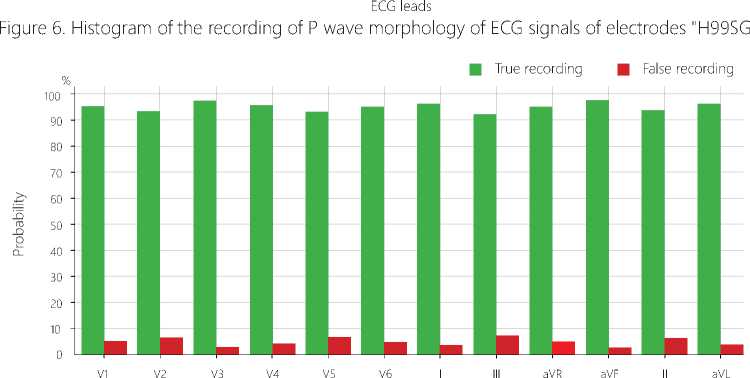
Figure 7. Histogram of the recording of P wave morphology of ECG signals of electrodes “MSGLT-05MGRT”
■ True recording ■ False recording
ECG leads
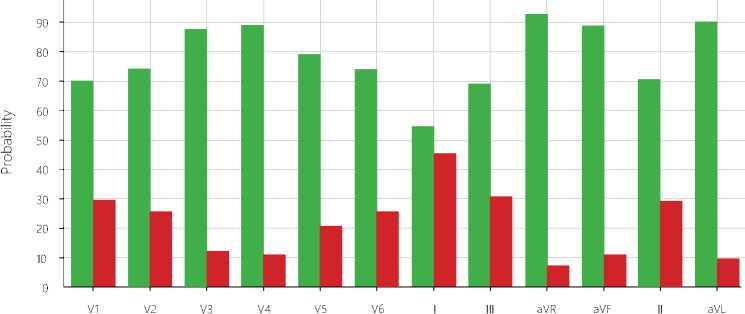
Figure 8. Histogram of the recording of P wave morphology of ECG signals of electrodes “М2202А”
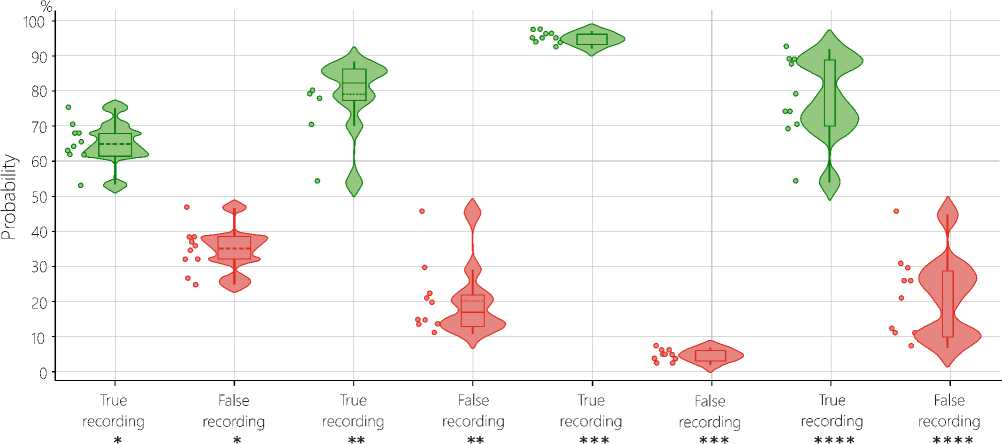
Figure 9. Violin plot of P waves of ECG signals without leads aVL and II for 10 electrodes.
Legend: *H92SG, **H99S, ***MSGLT-05MGRT, ****M2202A.
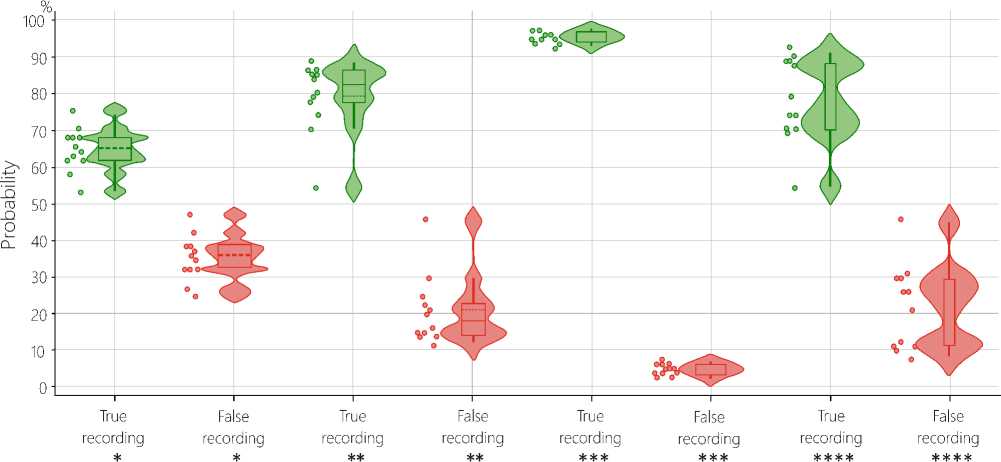
Figure 10. Violin plot of P waves of ECG signals with leads aVL and II Legend: *H92SG, **H99SG, ***MSGLT-05MGRT, ****M2202A.
a presentation is to evaluate the parameters of the ECG signals for 10 of each electrodes type during long-term recording. Note that the last two leads are formed as follows [30]:
II = I + III aVL =
I - III
The results illustrated by Figures 9, 10 demonstrate that when recording P waves with H99SG electrodes, there are values that go beyond the boundaries of the whiskers –outliers, presented on the violin plot. Also, these outliers indicate that the recording of the P waves by electrodes of these types, relative to other brands, differs significantly in the level of veracity and recording error that can be associated with the highest resistance value of CCS. Besides, comparing these conclusions with the data in Table 3 herein, it can be noted that the minimum probability of a reliable record for this electrode is 54.3% for lead I, which is illustrated by outliers in Figures 9 and 10 herein.
Significant data were obtained upon the results of our comparative analysis of the resistance values, when estimating the drying time of the CCS electrodes after opening, as well as upon the results after their long operation (12 and 24 hours) on the surface of the human skin. Based on these data, we can conclude that electrodes with a solid contact conductive substance have the best characteristics suitable to use in long-term monitoring of ECG signal parameters. This conclusion is confirmed by the results of our comparative analysis of the probabilities of true (veracity) and false recording of ECG signal parameters obtained using 12-lead Holter monitors. Using a 12-lead Holter monitor allows us to determine the boundaries of the waves and ECG signal complexes [26], which made it possible to calculate the probability fraction of true and false recordings in estimating the parameters of long-term ECG signals for each type of the electrodes considered.
Conclusions
Thus, the paper presents the results of our comparative analysis of the characteristics of wet electrodes to estimate the accuracy of recording parameters of long-term ECG signals. For electrodes with hard contact conductive substance, the probability of true (veracity) recording of ECG signal parameters is significantly higher. Such electrodes are less susceptible to drying both after their opening and under the conditions of prolonged monitoring. At the same time, liquid contact conductive substances during long-term monitoring are deformed, and go beyond the established area, thereby reducing the accuracy of recording of ECG signal parameters.
Research support
This work was financially supported by Government of Russian Federation, Grant 08-08.
Conflict of interest
None declared.
Author contributions
The authors read the ICMJE criteria for authorship and approved the final manuscript.
References Comparative analysis of characteristics of electrodes to estimate accuracy in recording long-term ECG signal parameters
- Piccini JP. Long-term electrocardiographic safety monitoring in clinical drug development: a report from the Cardiac Safety Research Consortium. Amer¬ican heart journal. 2017(187):156-169. doi: 10.1016/j.ahj.2017.01.012.
- Pervova EV. Sovremennye metody ambulatornogo monitorirovanija jelektrokardiogrammy. Tehniches¬kie aspekty. Klinicist. 2017(1):16-28. [in Russian]
- Pervova EV. Sovremennye metody ambulatornogo monitorirovanija jelektrokardiogrammy. Klinicheskoe primenenie. Klinicist.2017(2):58-73. [in Russian]
- Gupta R, Mitra M, Bera J. ECG acquisition and au¬tomated remote processing. India: Springer.; 2014.
- Nemirko AP, Manilo LA, Kalinichenko AN. Matem¬aticheskij analiz biomedicinskih signalov i dannyh. M.: Fizmatlit.; 2017. [in Russian]
- Berkaya SK, Uysal AK, Sora GE, Ergin S. A sur¬vey on ECG analysis. Biomedical Signal Process¬ing and Control. 2018(4):216-235. doi: 10.1016/j.bspc.2018.03.003.
- Altay YA, Kremlev AS. Analysis and systematiza¬tion of noise arising by long-term recording of ECG signal. ELCONRUS Intern. Conf; Univ. Eltech, Saint Petersburg, Russian Federation; 2018.
- Altay YA, Kremlev AS. A brief analysis of the use of non-linear time-frequency filtering for process¬ing ECG signals. Cardiometry. 2018(13):96-98. doi: 10.12710/cardiometry.2018.13.9698.
- Lim YG. Capacitive measurement of ECG for ubiq¬uitous healthcare. Annals of biomedical engineering. 2014(11):2218-2227. doi: 10.1007/s10439-014-1069-6.
- Sun Y, Yu XB. Capacitive biopotential measure¬ment for electrophysiological signal acquisition: A re¬view. IEEE Sensors Journal. 2016(9):2832-2853. doi: 10.1109/JSEN.2016.2519392.
- Chi YM, Jung TP, Cauwenberghs G. Dry-contact and noncontact biopotential electrodes: Method¬ological review. IEEE reviews in biomedical engi¬neering. 2010(3):106-119. doi: 10.1109/RBME.2010. 2084078.
- Meziane N. Dry electrodes for electrocardiogra¬phy. Physiological measurement. 2013(9): 47-69. doi: 10.1088/0967-3334/34/9/R47.
- Boyakhchyan A. The method of stabilization and reduction of noise in the measurement signal through the “dry” electrodes for electrocardiography. IOP Conference Series: Materials Science and Engineering. 2018(1):1-5. doi: 10.1088/1757-899X/457/1/012017.
- Zajmolda FK. Otstrojka ot vlijanija mul'tiplika¬tivnyh pomeh pri s#eme jelektrokardiogrammy suhimi jelektrodami. Mezhdunarodnaja konferencija molo¬dyh uchennyh; Tomskij Politehnicheskij Universitet, Tomsk, Rossijskaja Federacija; 2015. [in Russian]
- Starchak AS. Perspektivy primenenija emkostnyh datchikov dlja beskontaktnoj registracii jelektrokardio¬grammy. Jelektronnye sredstva i sistemy upravlenija. 2014(2):15-19. [in Russian]
- Boehm AA. Novel 12-lead ECG T-shirt with active electrodes. Electronics. 2016. (4):1-15. doi: 10.3390/electronics5040075.
- Yu X. A wearable 12-lead ECG T-shirt with tex¬tile electrodes for unobtrusive long-term monitor¬ing–Evaluation of an ongoing clinical trial. IFMBE Proceedings. 2017(65):703-706. doi:10.1007/978-981-10-5122-7_176.
- Baranovskij AL, Nemirko AP, Kalinichenko AN. Kardiomonitory. Apparatura nepreryvnogo kontrolja JeKG. M.: Radio i svjaz'.; 1993. [in Russian]
- Popechitelev EP, Korenevskij NA. Jelektrofiziolog¬icheskaja i fotometricheskaja medicinskaja tehnika. M.: Vysshaja shkola.; 2002. [in Russian]
- Orlov JuN. Jelektrody dlja izmerenija biojelek¬tricheskih potencialov. M.: MGTU imeni N.Je. Bau¬mana.; 2006. [in Russian]
- Ivanov VA, Marusina MJa, Tkalich VL. Priklad¬naja metrologija. SPb.: Universitet ITMO.; 2003. [in Russian]
- Askarov ES. Metrologija i tehnicheskie izmerenija. Almaty: Jekonomika.; 2016. [in Russian]
- Salin VN, Churilova JeJu. Praktikum po kursu «Statistika». M.: Perspektiva.; 2002. [in Russian]
- Truhacheva NV. Matematicheskaja statistika v mediko-biologicheskih issledovanijah s primeneniem paketa Statistica. M.: GJeOTAR-Media.; 2012. [in Russian]
- Altay YA, Kremlev AS. On the Use of the Statistical Methods for Biomedical Signals and Data Processing. ELCONRUS Intern. Conf; Univ. Eltech, Saint Peters¬burg, Russian Federation; 2019.
- Tihonenko VM. Narushenija ritma i provodi¬mosti serdca u zdorovyh lic. Vestnik aritmologii. 2018(91):11-20. [in Russian]
- Tihonenko VM. Praktikum po Holterovskomu monitorirovaniju. SPb.: INKART.; 2013. [in Russian]
- Fedotov AA. A robust method for detecting the QRS complex of the ECG signal. Biomedical Engineer-ing. 2016(1):40-43. doi: 10.1007/s10527-016-9583-5.
- Python Graphing Library, Plotly. [Online]. Avail¬able: https://plot.ly/python/
- Rangajjan R.M. Analiz biomedicinskih signalov. M.: Fizmatlit.; 2010.
