Comparative Analysis of Data Mining Techniques for Predicting the Yield of Agricultural Crops

Author: Utshab Das, Hasan Sanjary Islam, Kakon Paul Avi, Ajmayeen Adil, Dip Nandi
Journal: International Journal of Information Technology and Computer Science @ijitcs
Article in issue: 4 Vol. 15, 2023.
Free access
Predicting crop yields is one of the more difficult tasks in the agriculture sector. A fascinating area of research to estimate agricultural productivity has emerged from recent advancements in information technology for agriculture. Crop yield prediction is a technique for estimating crop production based on a variety of factors, including weather conditions and parameters such as temperature, rainfall, fertilizer, and pesticide use. In the world of agriculture, Data mining techniques are extremely popular. In order to predict the crop production for the following year, data mining techniques are employed and evaluated in the agricultural sector. In this paper, we carried out the comparison between Naive Bayes, K-nearest neighbor, Decision Tree, Random Forest, and K-Means clustering algorithms to predict crop yield in order to determine which method is most effective at doing so. The results show which algorithm is better suitable for this particular purpose by comparing these data mining algorithms for agricultural crop production and determining which algorithm is more successful for this outcome.
Weka, Data Mining, Crop Yield, Visualization
Short address: https://sciup.org/15018941
IDR: 15018941 | DOI: 10.5815/ijitcs.2023.04.03
Text of the scientific article Comparative Analysis of Data Mining Techniques for Predicting the Yield of Agricultural Crops
Agriculture plays an important role for many countries in the world. For the world's population, it provides the primary source of food. Due to its considerable contribution to the supply of food, agriculture is one of the major social concerns. Due to the scarcity or lack of food with a growing population, several countries still suffer from hunger today. Using methods to ensure crop development and output in a timely and predictable manner, the combined effects of expanding population, natural weather variability, soil loss, and climatic change are taken into account [1].
Additionally, it must support the expansion of sustainable agricultural food production. However, it faces a significant obstacle: producing more and better while improving sustainability, minimizing environmental degradation, and adjusting to climate change [2]. Therefore, it is crucial to transition to modern agriculture from conventional ways. The essential information needed to modernize agriculture is weather conditions, soils, diseases, insects, seeds, fertilizers, etc. This information contributes significantly to the sector's sustainable and economic growth. Climate change is having an impact on agricultural and horticultural crops around the world, as well as the diseases that seriously harm the crops. Farmers and other agricultural decision-makers make choices based on their understanding of typical climatic patterns for their locations, unprepared for the weather conditions that do occur. It might be possible to change actions to reduce negative effects and to benefit from anticipated favorable conditions if improved climate projections were available three to six months in advance [3]. The timing and circumstances of field operations can also be impacted by extreme weather events, which can potentially physically harm crops and have an impact on their physiological processes [4]. Weather factors are the main factor affecting agricultural productivity. To help the farmers maximize the crop output in their crops, an analysis must be done in this context to help estimate future crop productivity and provide timely advice to the farmers. A major agricultural concern is yielding prediction. To know how much of a yield to anticipate is of interest to every farmer [5]. Data mining techniques will be used to investigate the various factors of weather and the factors required for expected crop yield. Agriculture and Food organization have huge amounts of data about the yield of various crops in different countries in previous years. These datasets can be used for datamining techniques. Data mining is anticipated to be a key component of smart agriculture in order to manage real-time data analysis with huge amounts of data [6]. Using data mining, it is possible to classify and identify patterns in big data sets that can be valuable. Extraction of information from a data set and transformation of it into a comprehensible structure are the two main objectives of the data mining process. In this study, four classification approaches were applied to a secondary dataset in order to determine the yield of various crops grown in various nations in prior years.
The objective of this study is to compare different data mining techniques for predicting the yield of agricultural crops. The study aims to evaluate the accuracy of different algorithms, such as Naive Bayes, K-nearest neighbor, Decision Tree, Random Forest, and K-Means clustering algorithms, for predicting different types of yield of crops. The study seeks to provide insights into the potential of data mining techniques for predicting crop yields in agriculture. The results may guide future research on this topic and help farmers optimize their crop yields by identifying the most effective data mining techniques.
Five sections make up the paper, which are arranged in the following order: The introduction is in part 1, followed by a brief summary of the overall picture of agricultural yield and its issues in section 2, an analysis of the data collected, a comparison, and this paper's findings in section 3, a discussion of the results in section 4 and the conclusion in section 5.
2. Related Works
A major agricultural concern is predicting crop yield. In order to make informed judgments about agricultural risk management and forecasting the future, it is vital to understand that agricultural output is primarily influenced by weather conditions (rain, temperature, etc.), pesticides, and historical crop yield data. Warmer temperatures, higher CO2 levels, less rainfall, and increased rainfall unpredictability are just a few of the several climate change-related factors that have all been examined for their effects on various infections and diseases in relation to different crops. The impacts of climate change extend beyond specific plants and plant ecosystems [7]. Crop yield forecasting is a unified, bio-socio-system that involves intricate interactions between the soil, air, and water as well as the crops that are cultivated there. For this reason, a thorough model is necessary [8]. By categorizing crop yield forecasting models based on attribute measurement techniques, such as ground-based observed, country-based observed, temperature-based observed, rainfall-based observed, pesticide-based observed, fertilizer-based observed, and year-based observed, is possible.
Agricultural intensification can have a significant negative influence on the environment, including soil degradation from wind and water erosion, air and water pollution from excess fertilizers and agrochemicals, and loss of biological and ecological variety. It is necessary to change agricultural production processes in a more sustainable genre, by appropriately allocating resources and utilizing other intellectual agriculture strategies, in order to lessen the negative consequences of productive but intense agriculture [9].
Modern agriculture is regarded as a means of achieving these goals. Utilizing data mining technology and managing a lot of data is necessary to accomplish these goals. Its objective is to gather information from various sources in order to comprehend, foresee, and more effectively plan agricultural activity [10]. Cultivating soil, planting, raising and harvesting crops, rearing, feeding and managing animals these are the main process of a crop production [11]. Future crops must be designed for sustainable agriculture development by optimizing net production and minimizing unfavorable environmental effects in order to assure the security of both the food supply and the ecosystem [12]. According to a United Nations estimate that will be published in November 2022, the world's population will increase and reach 9.8 billion in 2050 and 11.2 billion in 2100. (United Nations, 2012). Food production must expand internationally by 50% over the next 20 years in order to meet the projected increase in global population. [13]. Therefore, agricultural intensification is necessary to feed the expanding and demanding global population. To collect and analyze data, smart agriculture depends on a number of interconnected technologies. Massive volumes of data are produced by these new technologies when used together. In order to maximize productivity and strengthen agriculture's resistance to climate change, a vast amount of current crop, soil, and climatic data must be used, along with analysis of fresh non-experimental data.
Data mining is mostly used in smart agriculture to plan the use of soil and water, monitor crop health, use of natural resources more efficiently, reduce use of pollutants, increase production quality, etc. Many agricultural jobs involve data mining techniques. Data mining can be used in a variety of ways to address various agricultural issues. The most significant challenge for farmers in agricultural fields is increasing crop productivity. If the person is new to the agricultural field. Initially, farmers do not know which environment is appropriate for which types of yields, which soil is suitable for which crops, and which weather is suitable for which crops. Without knowing these conditions, it is difficult to choose better crops, which reduces income [14]. Data mining techniques are used to solve these problems. Based on the early years, these techniques aid in predicting rainfall, moisture, temperature, and wind speed. It significantly increased crop productivity based on this prediction. Weather forecasting is also very useful in farm operations such as deciding whether to irrigate the crop or not, when to apply fertilizer, and whether to begin complete harvesting or not.
To predict rainfall, data mining was used over two techniques and compared yield prediction based on rainfall between MLR Technique and K-Means. The accuracy of the average production estimation was 98% using the MLR Technique and 96% using the K-Means algorithm [15]. Data mining techniques are used to find patterns in large datasets, classify records, and extract information. Large datasets typically hide information, but data mining techniques can be used to discover and transform that information into useful knowledge. The incorporation of data mining into agricultural organizations' information systems reduces subjectivity in decision making while also providing new useful agricultural knowledge. Agricultural workers benefit most from predictive models' knowledge and experience. The prediction problem in agriculture can be divided into two phases: learning and decision making. The goal of predictive data mining in agriculture is to create a clear predictive model that makes reliable predictions and helps agronomists improve their prognoses and procedures for treating agricultural cultures [16].
For this research, we are working with crop yield prediction dataset and this dataset we collected from Food and Agriculture Organization (FAO). In this dataset there are 16 countries (Albania, Algeria, India, Pakistan, Thailand, Canada, Germany, Sri Lanka, Bangladesh, Egypt, Finland, France, Brazil, United Kingdom, France, Denmark, Finland) what type of crop was grown in which country in which year, how many hectares crops were grown, what was the average rainfall, what was the average temperature, how much pesticide was used, what was the pH level of soil, what type of fertilizer was used, and the yield of crops in 2000-2013. There are 5828 instances, 10 attributes in that dataset. We apply some specific types of algorithms on this dataset and this algorithm give a possible outcome of what the crop will be in a given year and farmers can be know the crop yield of previous year, what type fertilizer used in previous years, how was the condition of weather and how the weather affected the crops. Farmers can take preparation for crop production in advance and predict yield by analyzing past year’s weather data and crop yield data. In this paper, we have attempted to define the eminent factor of agriculture crops (maize, potatoes, soybeans, rice paddy, wheat, sorghum, sweet potatoes, cassavas, yams plantains and others) yield of previous years of different countries by applying Naïve Bias, K-nearest neighbors (KNN) algorithm and Decision Tree algorithms on the attributes (country, year, item, average_rainfall_mm_per_year, pesticides_tonnes, avg_temp, soil pH, Fertilizer type, hg/ha_yield, Type of yield) of dataset.
In order to forecast a successful outcome for crop yield, the most frequently used techniques in agriculture include Naive Bayes, Decision trees, Support vector machines, K Nearest Neighbors, and K Means Clustering algorithm. Decision tree algorithm. In order to accurately forecast outcomes, the decision tree algorithm, a powerful data mining method, is applied to the information collected from the field. Random forest algorithm is also beneficial for the predicting the result of crop yield. Random forest algorithm divides the dataset into subset and decision tree. This algorithm can handle large amount of data. Farmers receive data from the decision tree algorithm via email alerts, which aid in decision-making about crop productivity and weather forecasting. Based on the data, it was possible to observe the relationship between soil properties. K-means clustering divide the data into number of clusters for find out the value of K to determine the similar characteristics of data. In order to analyze soil fertility groups, the K-means clustering technique was used [17, 18]. These algorithms were suggested as research methodologies to forecast crop yield in the agricultural sector for this reason. However, because their performance is data-dependent, it is challenging to compare the techniques' accuracy and choose the best one. In this paper, it is investigated that which fertilizer is benefited for which type of crops and applied designated algorithm for find out the soil pH effect on same types of crops for several countries. Analyzing the average temperature and rainfall for same types of crops for different countries by applying the K-nearest neighbors (KNN) algorithm for predicting the result of yields. It will find out with the percentages of different kinds of crops. To cultivate good crops, it is necessary to know about the balance of modern technologies, soil management etc. [10, 19].
3. Data Collection and Analysis
This section includes a selection of datasets along with an analysis. In this study, a secondary dataset that was gathered via the internet was employed (Kaggle.com). In this dataset, we take 5828 instances, 10 attributes. The selected attributes are country, agricultural crops item, year, average rainfall, average temperature, amount of pesticide used, fertilizer type and Type of yield. We take 16 countries among 30 countries and analyze the prior data from 2000 to 2013. Weka, a well-known machine learning program, was employed for these algorithms because its visualization function was particularly helpful for identifying the patterns, dependencies, and interactions between crop yield and other climatic and environmental parameters. In this research, we applied KNN, Naïve Bayes, Decision tree, Random forest and K Means Clustering algorithm and random forest on the crop yield dataset.
Table 1. The list of data mining methods that are frequently applied in the agricultural sector
|
Classification Technique |
Summary |
|
Naïve Bayes |
The Naive Bayes algorithm uses the strong autonomy hypothesis and the Bayes theorem to categorize probability. It entirely depends on how accurate the probability model is. One advantage of this technique is that the classifier only requires a little amount of training data to evaluate constants like means and variances of variables that are crucial for classification [20]. |
|
Decision Tree |
One of the methods used for categorization in data mining is this one. The effectiveness of the sophisticated geospatial decision support system is demonstrated by the application of mining techniques linked to risk management (GDSS). A decision tree is an early learning structure that is primarily focused on learning a rule that is common from examples of observations [21]. |
|
K-nearest neighbors (KNN) |
A supervised machine learning (ML) approach known as K-nearest neighbors (KNN) can be used to solve problems involving classification and regression predictive modeling. It makes predictions about the values of new data points using a concept called "feature similarity," which further indicates that the value of the new data point will depend on how closely it resembles the values of the training set [22]. |
|
K-Means Clustering |
A non-hierarchical strategy for organizing observations into K groups is the K-means grouping method. The group with the closest center is given to each item. To reduce the variance of their elements, the algorithm updates the groupings iteratively. The Euclidean metric is employed by the fundamental K-means algorithm, which was applied in this article, to specify the separation between the cluster elements and their centers [23]. |
|
Random Forest |
By influencing multiple trees during the training and testing processes, the random forest algorithm or random decision forest classifiers are a corps research methodology for supervised learning for splitting, association, regression, and other assignments. After that, the class that best represents the mode of classification or predictive regression of decision trees is determined [24]. |
According to the dataset, the yield in a country, how was the yield of crops, which weather factors effect on the crop, which fertilizer is useful for the crops and the quantity yield of crops can be seen through the graph in the Weka tool. By adopting some data mining algorithm on the crop yield dataset, it is possible to find out some meaning full data for which factor weather the crop yield may be affected. It also finds out how the fertilizer dominance the yield of crops based on weather factors. From the table, it is visible that the average temperature is 5-29°C. The average rain falls 512702 mm. The soil pH for those countries is 3.5-9.6. The amount of pesticide used in those countries from 0.92 to 36778 tones. The amount of yield is 5730-568796 hg/ha. There is two type of yield one is high yield and another is average yield. This weather factors, fertilizer type and pesticides influenced the yield of crops of those countries. It can be able to see the more accurately when applied the algorithms on this dataset.
Table 2. Selected attributes from dataset
|
Attribute Name |
Attribute’s value type |
Description |
|
Country |
Nominal |
India, Brazil, Bangladesh, Pakistan, Indonesia, Germany, France, Sri Lanka, Canada, Finland, Denmark, UK, Egypt, Thailand, Albania, Algeria. |
|
Item |
Nominal |
Maize, potatoes, soybeans, rice paddy, wheat, sorghum, sweet potatoes etc. |
|
Year |
Numeric |
2000-2013 |
|
Average rain falls |
Numeric |
51-2702 mm |
|
Average temperature |
Numeric |
5-29°C |
|
Pesticide |
Numeric |
0.92-36778 tonnes |
|
Fertilizer |
Nominal |
Potassium, Nitrogen, Phosphorus, Guano, Biosoilds, Urea, Animal manure, Potash, DAP, NPK, TSP, Diammonium phosphate etc. |
|
Soil pH |
Numeric |
3.5-9.6 |
|
Hg/ha_yield( Quantity) |
Numeric |
5730- 568796 hg/ha_yield |
|
Type of yield |
Nominal |
High yield, Average yield |
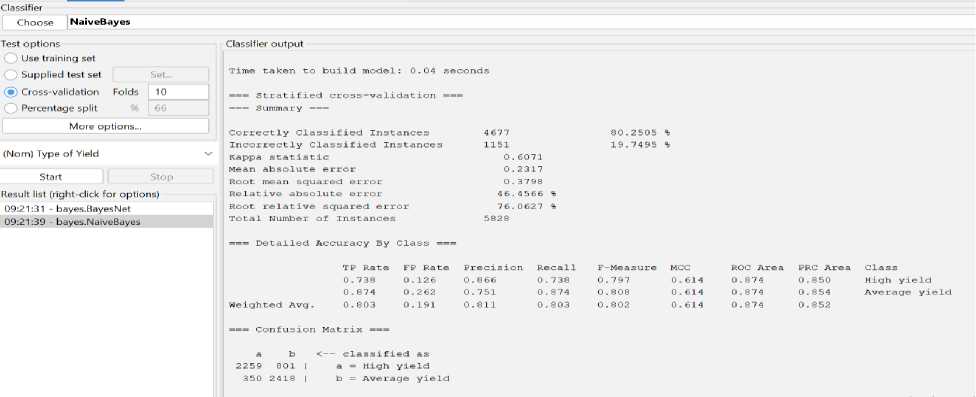
Fig.1. The result of Naïve Bayes algorithm
After applying Naïve Bayes algorithm, the correctly classified instance is 80.2505% and incorrectly classified instance is 19.7495%. Kappa static value is 0.6071, mean absolute error is 0.2317, relative absolute error 46.4566% and root relative squad error is 76.0627%. We take 10 fold cross validation for this algorithm. We also see the confusion matrix for naïve Bayes algorithm.
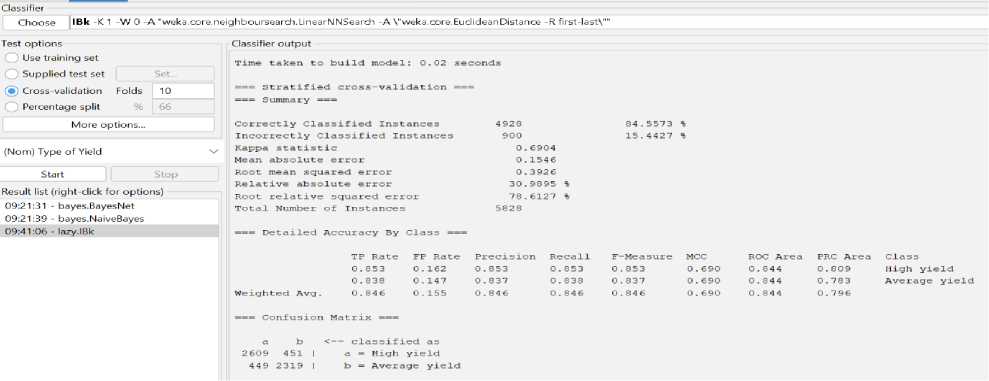
Fig.2. The result of KNN (IBK) algorithm
After applying K-nearest neighbors (KNN) algorithm the correctly classified instance is 84.5573% and incorrectly classified instance is 15.4427%. Kappa static value is 0.6904, mean absolute error is 0.1546, relative absolute error 30.9895% and root relative squad error is 78.6127%. We take 10 fold cross validation for this algorithm. We also see the confusion matrix for K-nearest neighbors (KNN) algorithm.
The K-nearest and Naïve Bayes algorithm both are supervised learning algorithm. These algorithm works with label data. Naïve Bayes is a probabilistic classifier and k-nearest neighbor algorithm calculate value of k by dividing the dataset into number of groups and take those data which is closest distance. The result of K-nearest neighbors (KNN) algorithm is higher than Naïve Bayes algorithm. KNN gives more accurate result than naïve Bayes on this dataset. Those algorithms find out the high yield and average yield for the crops against weather factors and other factors.
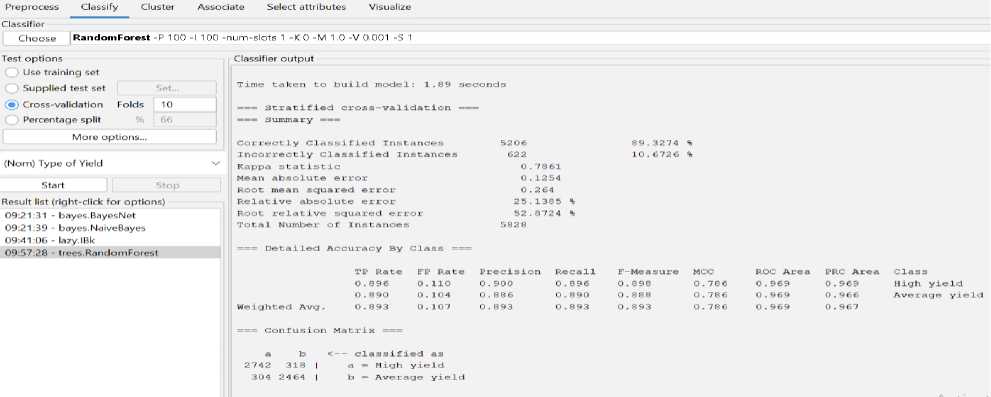
Fig.3. The Result of Random Forest algorithm
After applying Random Forest algorithm, the correctly classified instance is 89.3274% and incorrectly classified instance is 10.6726%. Kappa static value is 0.7861, mean absolute error is 0.1254, relative absolute error 25.1385% and root relative squad error is 52.8724%. We take 10 fold cross validation for this algorithm. We also see the confusion matrix for Random Forest algorithm.
The result of Random Forest algorithm is higher than K-nearest neighbors (KNN) algorithm and Naïve Bayes algorithm. The Random Forest algorithm gives more accurate result than KNN and naïve Bayes on this dataset. There are three key hyper parameters for random forest algorithms that must be set prior to training. Node size, tree count, and sampled feature count are a few of them. From there, classification or regression issues can be resolved using the random forest classifier. It can do out tasks including classification and regression. Good, understandable forecasts are generated by a random forest. It is capable of effectively handling big datasets. Compared to the decision tree method, the random forest algorithm is more accurate at forecasting outcomes.
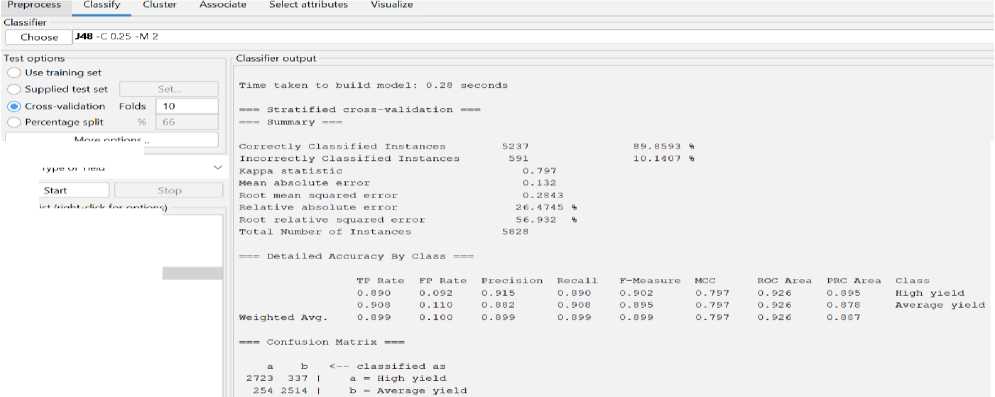
Fig.4. The result of Decision tree (J48) algorithm
More options...
(Nom) Type of Yield
After applying Decision tree algorithm, the correctly classified instance is 89.8593% and incorrectly classified instance is 10.1407 %. Kappa static value is 0.797, mean absolute error is 0.132, relative absolute error 26.4785% and root relative squad error is 56.932%. We take 10 fold cross validation for this algorithm. We also see the confusion matrix for Decision tree algorithm.
The result of Decision tree algorithm is higher than Random forest, K-nearest neighbors (KNN) algorithm and Naïve Bayes algorithm. The Decision tree algorithm gives more accurate result than Random forest KNN and naïve Bayes on this dataset. After analyzing the dataset, it can be realized that the decision tree algorithm is more accurate and effective to predict the yield of crops based on weather factors and other factors which influenced the yield of crops. Decision tree algorithm is a supervised learning algorithm and can be used as both classification and regression problem. This algorithm can handle large amount of data and can be turned those into more meaningful data. We visualize the tree of decision tree algorithm. By the visualize tree, it can be realized that the mechanism of decision tree algorithm. A root node, branches, internal nodes, and leaf nodes make up its hierarchical tree structure. It can able handle multiple output problems.
0 Weka Classifier Tree Visualise:: 22:27:10 - trees.J48 (Final Crap Yield Datasetl 2)
Э X
Tree View -
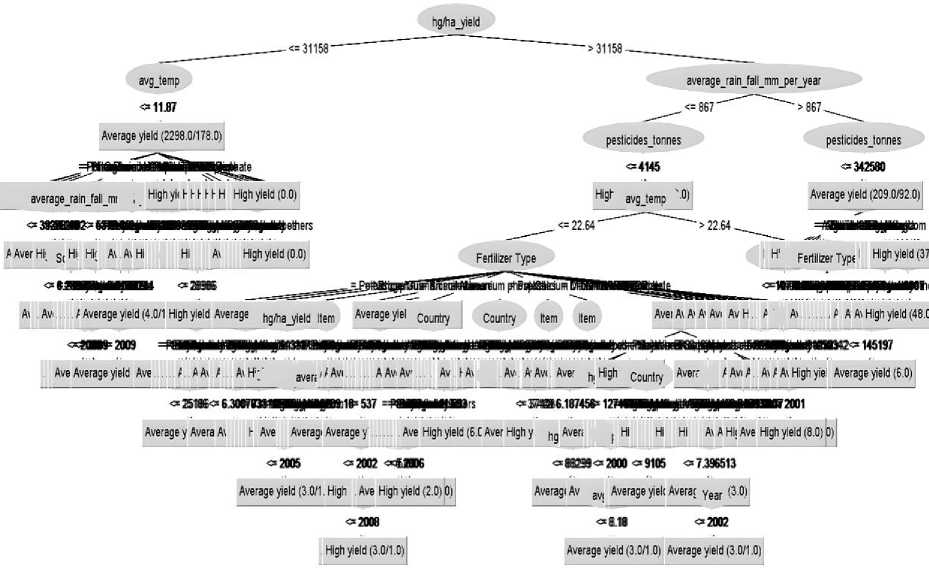
Fig.5. Visualize of Decision tree
From this tree, it can realize that the first node is hg/ha_yield and it depend on 2 nodes one is average temperature and other is average rainfall. If the average temperature is less than equal 11.87 then it will go to average yield 2314 hg/ha. Average rainfall depends on pesticide tonnes and country. If the pesticide tonnes is less than equal 4145 then it will go to highly yield and greater than 4145 then it will go to country attribute. Country node depends on yield type, item of crops and year nodes. The yield of country depends on average temperature node, average rainfall nodes, fertilizer type and year.
From the tree, if the yield of potatoes is greater than or equal 141597 then the yield is high and if the yield is less than 141597 then yield is low. If soil pH is less than equal 6.2 then it is average yield and if greater than 6.2 then it will high yield. From Decision tree we see that average yield of maize, high yield of potatoes, soybeans average yield, rice paddy high yield, sorghum average yield and cassava high yield. The yield of wheat is better than any other agricultural crops in previous year. From the tree it finds out the yield of maize is better after the year of 2004. Before the year 2007 the yield of some crops is average and after the year of 2007 the yield of some crops is high.
The calcium and micronutrient fertilizer are effective for crop yield. Fertilizer potassium, nitrogen, phosphorus, Guano, Bio solids are highly used in before 2007 and the use of micronutrient, DAP, Green Manure, TAP, Diammonium phosphate, NPK are increased from 2008. After using the calcium fertilizer, the production of crops is well after the year of 2010. The use of fertilizer potash gives the good result after the year of 2009. The calcium, Biosolids, nitrogen, urea is favorable for rice paddy, soybeans, potatoes and maize.
The yield of crops comparatively good from 2007 to 2013 than others years. The animal manure fertilizer is a natural fertilizer and this fertilizer is good for crops. The use of ammonium is not good for the crops. The alkali soil is not good for the yield of crops. So, it will be helpful if the value of soil pH can be modified by some organic and inorganic way. If the soil pH is less than or equal to 5.81 then it will be gone for pesticide. If the amount of pesticide less than or equal to 34930 then it goes for high yield node and if it greater thereafter it goes for average yield. So it can be said the use of excessive amount of fertilizer increase the acidity of soil and this is not good crops. The factors of weather is very effective for the yield of crops. The soil pH is an important factor for crop yield.
From the tree, it finds that if the temperature is less than 6 then yield is average for particular countries and if the average temperature is higher than 6 then the yield is high. The yield of maize, wheat and potatoes is good in France due to favorable weather conditions. If the average temperature is greater than 10 degrees Celsius then it is favorable for the yield of wheat. If the temperature is greater than 20 degrees Celsius it is convenient for rice paddy, soybeans and maize production. The yield of cassava is better if the temperature is greater than 23 degrees Celsius. If the temperature is less than 20 degrees Celsius then it is not suitable for the yield of yams. If the average rainfall is between 1500-2500 then it is suitable for the production of rice paddy, potatoes and sweet potatoes. The 400-1100 mm rainfall is suitable for wheat, soybean production. The 40-270 mm rainfall is favorable for maize yield. The 1200-1500 mm rainfall is good for cassava yield. The animal and green manure is organic manure this fertilizer is suitable for the yield of agricultural crops.
-
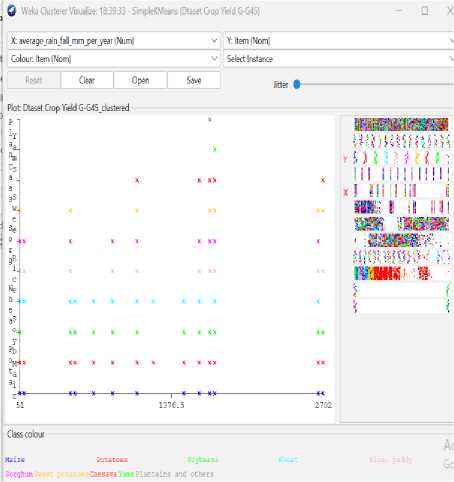
Fig.6. Rain fall vs item visualization
-
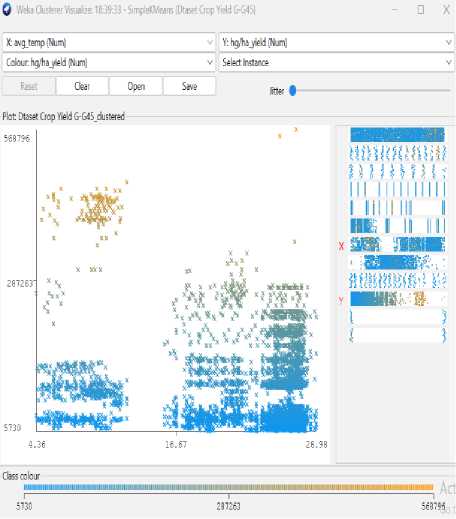
Fig.7. Temperature vs yield visualization
After adopting k-means clustering algorithm on the dataset it divided the data into two clusters. Cluster 0 and cluster 1 give the different result for clustered Instances. For cluster 0 instance is 2815 and the percentage is 48% and for cluster 1 instance is 52% and the percentage is 52%. We can take more clusters for the dataset and this will be giving different result. An unsupervised learning algorithm is K-Means clustering. K-Means divides objects into clusters that have things in common and are different from things in other clusters.
-
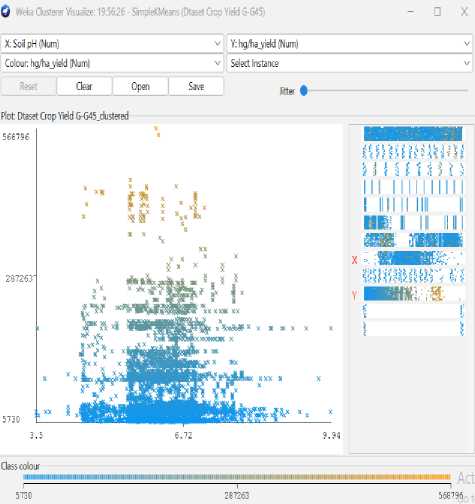
Fig.8. Soil pH Vs Amount of yield (hg/ha)
-
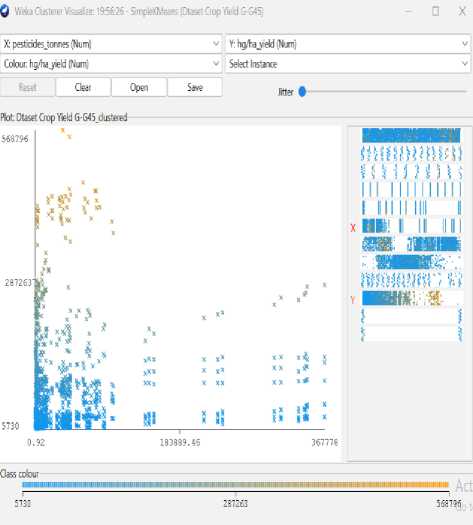
Fig.9. Pesticide vs Amount of yield (hg/ha)
As seen in figures 7 to 14, even though the clustering algorithm merely generated K clusters of data points based on their relative characteristics, we were able to individually correlate the variation of each factor, whether it be country, item, year, soil pH, average rainfall, average temperature, pesticide, fertilizer type, and type of yield values, and directly determine their relationship with one another from the visual.
A factor that could affect crop production was shown on the x-axis in each visualization, and the yield values were displayed on the y-axis. For easier comprehension of the relationship between the factor being observed and the yield, the clustered data points have been categorized based on their yield values and colored accordingly. For example, for data points with higher yield values, the centroid's color will lean more towards "blue," whereas for data points with an average yield value, the centroid's color will lean more toward the "yellow" end of the spectrum. Every visualization under "Class Color" has the color spectrum displayed.
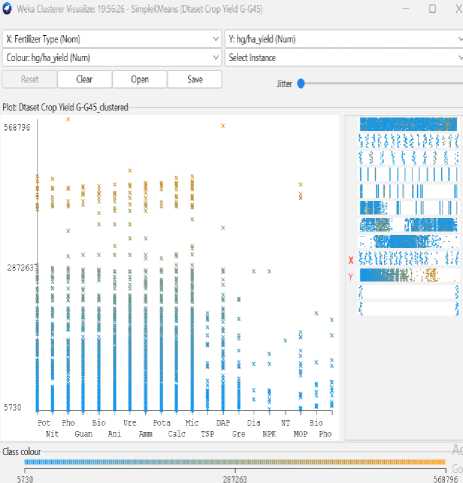
Fig.10. Fertilizer Vs Amount of yield (hg/ha)
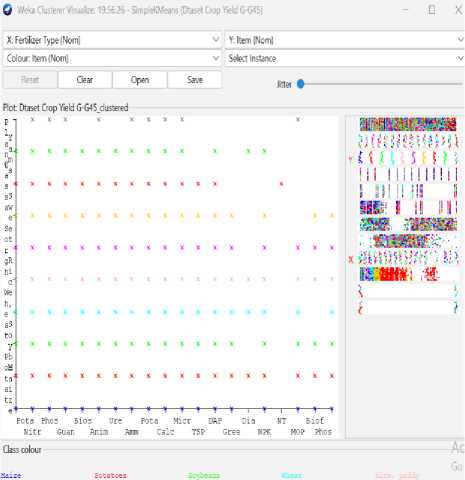
Fig.11. Fertilizer Vs Item
From the graph, it could be realized that the how is the yield in a country, the amount of yield of different crops, the amount crop yield in which year, the effect of average temperature and rain fall on crops and visualize how is the type of yield and fertilizer ratio on crops.
Fig.12. Rain Vs Amount of yield (hg/ha)
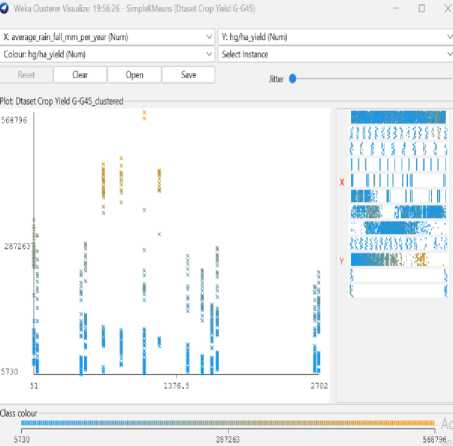
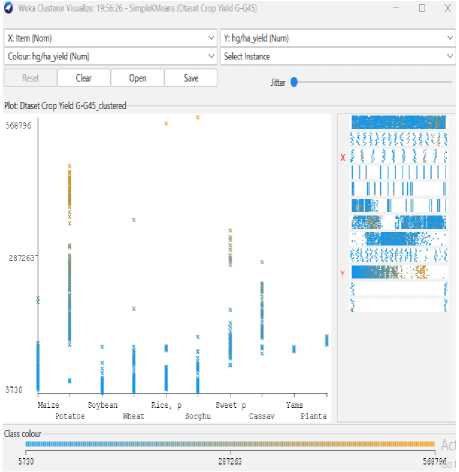
Fig.13. Item Vs Amount of yield (hg/ha)
Q All attributes — □
Country Item Year average_rain_fall_mm_per_year
Fig.14. Graph of country, item, year, average rainfall, pesticide tonnes, average temperature, soil pH, Fertilizer type, hg/ha yield and type of yield
4. Result and Discussion
Between 2000 and 2013, the production of primary crops climbed by 52%, reaching 9.3 billion tons. This is 3.2 billion tons greater than in the year 2000. Cereals made up the majority of the crops grown in 2013, accounting for little under one-third of the total, followed by wheat crops (23 percent), potatoes, and sorghum crops (12 percent each). Each contributed 9–10% of the overall production: maize and rice. The fastest-growing crop between 2000 and 2013 was rice, with production rising by 120 percent, from 0.5 billion tons to 1.1 billion tons. Wheat, on the other hand, grew by only 22% between 2000 and 2013. While many crops are grown and harvested around the world, only four crops accounted for half of global primary crop production in 2013: soybeans (20 percent of total, with 1.9 billion tons), maize (12 percent, with 1.2 billion tons), rice, and wheat (8 percent, with 0.8 billion tons each). Potatoes account for an additional 4% of global crop production. Between 2000 and 2013, potatoes accounted for 21% of global crop production on average. While maize, wheat, and rice each accounted for 10% of total production in 2000, maize production increased more than three times faster than wheat or rice during the same period, surpassing rice in 2001 to become the world's second most produced crop. Denmark is the world's leading producer of potatoes (54 percent) and maize (50 percent), while Asia is the world's leading producer of rice (89 percent), soybeans (89 percent), wheat (46 percent), and potatoes (50 percent). We investigated the effects of temperature on yields of four crops by compiling extensive published results from four analytical methods: global grid-based and local point-based models, statistical regressions, and fieldwarming experiments. Without CO2 fertilization, effective adaptation, and genetic improvement, each degree Celsius increase in global mean temperature reduces global wheat yields by 6.0%, rice yields by 3.2%, maize yields by 7.4%, and soybean yields by 3.1%. The results vary greatly across crops and geographical areas, with some positive impact estimates. For Naïve Bayes, we found correctly classified instances are 4677 (80.2505%) and incorrectly classified instances are 1151 (19.7495%). On the other hand, for KNN, we found correctly classified instances are 4928 (84.5573%) and incorrectly classified instances are 900 (15.44%). But for Decision Tree algorithm, we found correctly classified instances are 5237 (89.86%). And incorrectly classified instances are 591 (10.14%). Random forest algorithm gives correctly classified instance 89.32% and incorrectly classified instance is 10.67%. So, we can assume that Decision Tree algorithm gives us the most accurate result.
By this research, the government will be able to determine how much of each form of fertilizer must be imported as well as how much of each type has to be distributed where and how much. These imports are investments in higher agricultural yields, and crop yields can be significantly impacted by knowing the quantity and location of a particular fertilizer that is most needed. For the advantage of both sides, our research aims to close any gaps between manufacturers and customers. Through this research, the government and nongovernment organizations can advise the farmers on how to prepare in advance and what to look out for in order to improve the crop yield. This research can also help farmers optimize their use of resources, such as water and fertilizer, leading to more sustainable and efficient agriculture. If they can understand weather data, they will understand how weather affects crop yields. By analyzing data on food production and processing, data mining algorithms can help identify trends and patterns that can lead to better food safety and quality control. By analyzing data on the spread of diseases and pests, data mining algorithms can help farmers make informed decisions about pest and disease control, leading to reduced crop losses and increased productivity. Data mining algorithms can also provide valuable insights into the agriculture market, allowing farmers to make informed decisions about pricing and marketing their products. Overall, the use of data mining algorithms in agriculture has the potential to greatly benefit farmers, consumers, and the environment, by improving efficiency, reducing waste, and promoting sustainable agriculture.
5. Conclusions
In this research, the primary objective was to use data mining algorithms to analyze crop yield data in response to weather predictions. The WEKA tool is used in this study to categorize diverse agricultural data in order to estimate various agricultural crop yields based on weather forecasting. As a result, the classification techniques may provide a more accurate early forecast of diverse agricultural crop yield data. Five classification methods—Naive Bayes, Decision Trees, K-Nearest Neighbors, Random Forest and K-Means Clustering —are applied throughout this study. These five methods are used to analyze a dataset with different properties and determine which has the greatest accuracy rate. These categorization approaches have been used, and the accuracy rate comparison has been made. After analyzing the graphs and data, it was possible to determine the likelihood and risk factors for the agricultural data based on a number of different variables.
When utilizing this dataset to estimate different agricultural crop yields based on weather forecasts, Decision Tree delivered the highest accuracy rate and Naive Bayes the lowest accuracy rate. By using this method's outcome, the government aid all of us if it gave farmers the right guidelines and training in accordance with the results of the forecast. This would enable farmers to produce more food more efficiently and on schedule in the future.
This outcome can be used as a benchmark to support various agricultural crop yield study methodologies. In the near future, the researcher may utilize the Decision Tree method to improve accuracy while working with these 10 qualities, and from this data mining strategy, they can choose the best one to apply on huge datasets to improve accuracy of various agricultural crop yield prediction rates. Because this research was completed in a little amount of time and lack of resources, it bears some drawback of using a secondary dataset. Primary data collection was not feasible due to the limited time frame. In future primary data collection from other organizations and regions of the world will be done in order to compare the findings with those of this research.
The comparative analysis of data mining techniques for predicting the yield of agricultural crops has several potential benefits for both the government and people involved in the agriculture industry.
Firstly, the government can use the findings of this research to optimize their policies and programs related to agriculture. For instance, the government can allocate resources more effectively by targeting the crops that are likely to have high yields. Additionally, the government can make informed decisions about agricultural subsidies and support programs based on the predictions generated from the data mining techniques.
Secondly, the people involved in the agriculture industry, such as farmers, can benefit from the findings of this research by using the most effective data mining techniques to optimize their crop yields. Farmers can use the predictions generated from the data mining techniques to make informed decisions about irrigation, fertilization, and crop management practices, thereby increasing their yields and profitability.
Furthermore, this research can also help in the development of sustainable agriculture practices by providing insights into the factors that affect crop yields, such as soil quality, weather patterns, and irrigation practices. By optimizing these factors, farmers can reduce their reliance on harmful chemicals and pesticides, thereby promoting sustainable agriculture practices.
Overall, the comparative analysis of data mining techniques for predicting the yield of agricultural crops has the potential to benefit both the government and people involved in the agriculture industry by improving agricultural policies, practices, and profitability.
References Comparative Analysis of Data Mining Techniques for Predicting the Yield of Agricultural Crops
- Mamun Rashid, Bifta Sama Bari, Yusri Yusup, Mohammad Anuar Kamaruddin, “A Comprehensive Review of Crop Yield prediction Using Machine learning approaches with special emphasis on palm oil yield prediction” IEEE Volume 9, April 22, 2021
- N. Gandhi and L.J. Armstrong, "A review of the application of data mining techniques for decision making in agriculture", 2nd InternationalConference on Contemporary Computing and Informatics (ic3i), 2016
- J.W. Jones, J.W. Hasen, F.S. Royce, C.D. Messina, “Potential benefits of climate forecasting to agriculture”, Agriculture, Ecosystem and Environment 82 (2000) Page 169-184.
- J.P. Powell, S. Reinhard, “Measuring the effects of extreme weather events on yields” Weather and Climate Extremes, Volume 12, June 2016, Pages 69-79.
- D Ramesh, B Vishnu Vardhan, “Analysis of crop yield prediction using datamining techniques” International Journal of research in Engineering and Technology.
- Hassina Ait Issad, Rachida Aoudjit, Joel J.P.C Rodrigoues, “A comprehensive review of Data Mining techniques in smart agriculture” Engineering in Agriculture, Environment and Food Volume 12, Issue 4, October 2019, Pages 511-525.
- John A. Miranowski, “Impacts of productivity losses on crop production and management in a dynamic economic model” American Journal of Agriculture Economics Volume 66 Issue 1 page 61-67
- Ramesh A. Medar, Vijay S. Rajpurohit, Anand M. Ambekar, "Sugarcane Crop Yield Forecasting Model Using Supervised Machine Learning", International Journal of Intelligent Systems and Applications(IJISA), Vol.11, No.8, pp.11-20, 2019. DOI: 10.5815/ijisa.2019.08.02
- B. Milovic and V. Radojevic. “Application of Data Mining in Agriculture”. Bulgarian Journal of Agricultural Science, 21 (No 1) 2015, 26-34.
- Abdul Rehman, Luan Jingdong, Rafia Khatoon, Imran Hussain, Muhammad Shahid Iqbal, “Modern Agricultural Technology Adoption its Importance, Role and Usage for the Improvement of Agriculture” Life Science Journal 2017;14(2)
- Sally Jo Cunningham and Geoffrey Holmes, "Developing innovative applications in agriculture using data mining" in Department of Computer Science University of Waikato Hamilton, New Zealand.
- Zhixi Tian, Jia-WeiWang, Jiayang Li, Bin Han, “Designing future crops: Challenges and strategies for sustainable agriculture, Wiley Online Library, The Plant Journal 2020.
- Jyotshna Solanki, Prof. (Dr.) Yusuf Mulge, “Different Techniques Used in Data Mining in Agriculture”, International Journal of Advanced Research in Computer Science and Software Engineering, Volume 5, Issue 5, May 2015 ISSN: 2277 128X.
- J. Wang, S. Kang, J. Sun, Z. Chen, and N. Song, “Spatial prediction of crop water requirement based on Bayesian maximum entropy and multisource data”, Transactions of the Chinese Society of Agricultural Engineering, Vol.33, No.9, pp.99-106, 2017.
- Ramesh, D. and Vishnu Vardhan, B. (2013). Data mining techniques and applications to agricultural yield data. Int. J. Adv. Res. Compu. Communi. Engg., 2(9): 3477-3480.
- B. Milovic and V. Radojevic. Application of Data Mining in Agriculture. Bulgarian Journal of Agricultural Science, 21 (No 1) 2015, 26-34.
- Jun Wu, Anstasiya Olesnikova, Chi-Hwa Song, Won Don Lee, “The development and application of Decision Tree for Agriculture Data” IEEE, 2022.
- Nevena Golubovic, Chandra Krintiz, Rich Wolski, Balaji Sethuramasamyraja, Bo Liu, “A Scalable system for executing and scoring K-Means clustering techniques and its impact on applications in agriculture” pp 163-175, 2019, InderScience online.
- Martin Kuradusenge, Eric Hitimana, Damien Hanyurwimfura, Placide Rukundo, Kambombo Mtonga, Angelique Mukasine, Claudette Uwitonze, Jakson Ngabonziza, Angelique Uwamahoro, “Crop Yield prediction using Machine Learning Models: Case of Iris Potato and Maize” Journals of MBPI, 16 January 2023.
- R. Sujatha, Dr.P.Isakki, Sivakasi, “ A study on crop yield forecasting using classification techniques“ Journals of IEEE, 2017
- Hetal Patel, Dharmendrea Patel, “A comparative study on various data mining algorithms with special reference to crop yield” Indian Journal of science and technology” Vol9(22).
- H. K. Karthikeya, K. Sudarshan, Disha S. Shetty “Prediction of agriculture crops using KNN algorithm” International Journal of Innovative Science and Research Technology, Volume 5, Issue 5, May 2020
- Fabrico Guevara-Viejo, Juan Diego Valenzuela-Cobos, Purificacion Vicenete Ganlido, Purificacion Galindo Villardon, “Application Of K-Means Clustering Algorithm to Commerical Parameters of pleurotus sp. Cultivated On representative agriculture wastefrom provience of guyas” Journals of Fungi, 2021.
- V. Geetha, A.Punthia, M.Abarna, M. Akshaya, S.Illakiya, A.P. Janani “ An effective crop yield prediction using random forest algorithm” Journals of IEEE, 2020.
