Comparative Analysis of Macro-Femto Networks Interference Mitigation Techniques

Author: Katfun Philemon Dawar, Abraham U. Usman, Bala Alhaji Salihu, Michael David, Supreme Ayewoh Okoh, Adegbenga Ajiboye
Journal: International Journal of Wireless and Microwave Technologies @ijwmt
Article in issue: 6 Vol.12, 2022.
Free access
When interference is reduced, the benefits of using a macrocell and femtocell heterogeneous network (Macro-Femto) heterogeneous network (HetNet) can be increased to their full potential. In this study, Enhanced Active Power Control (EAPC), Active Power Control (APC), and Power Control (PC1) interference mitigation strategies are applied, and their performances in uplink and downlink transmission of 5G Non-Stand-Alone (NSA) architecture are compared. According to the findings of a MATLAB simulation, the EAPC technique utilized a lower amount of transmit power for the Macro User Equipment (MUE), the Home User Equipment (HUE), and the femtocell logical node (Hen-gNB), in comparison to the APC and PC1 techniques. While PC1 approach required less en-gNB transmission power. The MUE, HUE, hen-gNB, and en-gNB throughput of the EAPC approach was much higher. This work will enable wireless system designers and network engineers know the appropriate technique to utilize to achieve desired Quality of Service (QoS) while conserving network resources.
Uplink, Downlink, Transmission Rate, Interference, Macro-Femto, HetNet
Short address: https://sciup.org/15019193
IDR: 15019193 | DOI: 10.5815/ijwmt.2022.06.02
Text of the scientific article Comparative Analysis of Macro-Femto Networks Interference Mitigation Techniques
Fifth-generation (5G) network is an ultra-dense network (UDN) that works based on soft capacity. It calls for the installation and maintenance of high-cost outdoor macrocell nodes by mobile network operators (MNOs) so as to make available the required network services to all subscribers. Small cell networks such as: microcell, picocell, and femtocells are integrated into the macrocell network so as to improve cellular network performance with reference to the received signal to interference plus noise ratio (SINR), throughput, area of coverage, and network capacity. Among the existing small cell networks, femtocell is the most promising technology with the lowest cost, and smallest coverage area suitable for millimeter-wave propagation from homes and offices [1,2] . The mounting and maintenance cost of femtocells is handled by network users, as a tradeoff for better network performance [2] . When femtocell is installed, user equipment (UEs) that have access to such femtocell are moved from macrocell to femtocell [1,3], thereby decongesting the macrocell network, and increasing coverage area (cell breath out). Fig. 1 gives an illustration of NonStand-Alone (NSA) architecture of 5G Macro-Femto HetNet.
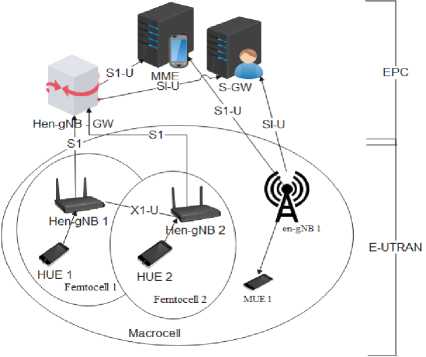
Fig. 1. Schematics of NSA architecture of 5G Macro-Femto HetNet [4–6]
In Fig. 1, EPC stands for enhanced packet core, E-UTRAN stands for enhanced universal terrestrial radio access network, S-GW denotes serving gateway, MME denotes mobile management entity, Hen-gNB represents femtocell node of 5G NSA architecture, en-gNB represents macrocell node of 5G NSA architecture, Hen-gNB – GW for femtocell gateway, while S1-U and X1-U represent communication interfaces.
The indiscriminate installation of femtocells by network user increases co-tier (intra-layer) and cross-tier (interlayer) interference in Macro - Femto HetNet. This interference is an undesired signal picked by neighboring network devices that hampers the optimal performance of cellular communication networks [2,7–9]. Interference is classified into uplink co-tier, uplink cross-tier, downlink co-tier, and downlink cross-tier interference as depicted in Fig. 2 below.
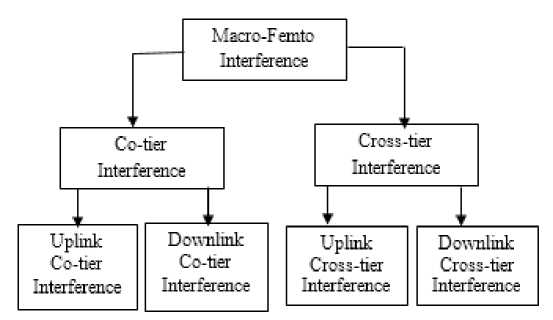
Fig. 2. Types of interference in Macro-Femto network [10,11]
Interreference mitigation techniques are therefore of great value to improve the quality-of-service (QoS) in femto cells [12]. A number of works on mitigating inference are covered in literature [13–15], knowing which to employ depends on a variety of variables such as the communication architecture of the wireless network, communication environment, type of inference in question, as well as the tradeoffs required to achieve the desired QoS level. This work uses MATLAB simulations to compare the performance of three interference mitigation techniques in femto networks. These techniques include Enhanced Active Power Control (EAPC), Active Power Control (APC), and Power Control (PC1) techniques in uplink and downlink transmission of 5G Non-Stand-Alone (NSA) architecture to help wireless system designers and network engineers understand the best technique to employ for desired results.
The following outline illustrates how the remaining parts of this work are structured. How each of the mitigation strategies works is examined in Section 2, along with examples of analogous projects in which they were implemented. The approach that was utilized for the analysis is addressed in Section 3, the outcome of the simulation is discussed in Section 4, while the study is brought to a close in Section 5.
2. Related Works
Power Control Techniques for Mitigation of Interference in Macro-Femto Cellular Communications. Power has been identified as one of the limited network resources aside from bandwidth in cellular communication. This calls for an optimization technique that will allow for better utilization of the scarce resource. There are several power control techniques being used today due to their simplicity when compared to the bandwidth allocation approach, or the cognitive radio sensing approach. The power control techniques for Macro-Femto networks that will be analyzed in this study are reviewed in the subsection following.
-
2.1 Management of Interference using Power Control for Macrocelll – Femtocell Cellular Communication Network.
In [8,9], the authors worked on the dynamic power control (PC1) technique for interference mitigation. They compared computed signal-to-interference-plus-noise ratio with threshold SINR as shown by the mathematical equation in (1), which they used for adjusting their transmission power.
SINRthreshold r f = SINR computed
where ^ ^represents the discrepancy between the measured and the target UE SINR, SINRomp „„„stands for computed
SINR while for threshold SINR. The current transmission power would be increased in the next transmission threshold by a scale factor of 2 dB when
Yу is below 0. When у is above 0, the next transmission power would be the present transmission power minus 2 dB. But when ydl^-is equal to 0, the subsequent transmission power would be the same as the current transmission power. Mathematically, PC1 transmission power adjustment in [8,9] is expressed using (2).
min[ P ( t j ) + ® , P ax ]; Y f < 0
P x ( t j + 1) И P x ( j ; Y f = 0
max[ P x ( j ) ) - ® , P min ] ; r f > 0
where P ( j + 1) stands for PC1 next transmission power, P ( jf ) represents PC1 present transmission power, и represents the value for adjustment, P mln is the minimum power of transmission, and P is the maximum power of transmission.
-
2.2 An Active Power Control for Management of Interference in Two-Tier Macro-Femto Network
Authors in [3] control the transmission power of aggressors (AGs) in a Macro-Femto cellular communication network premised on the calculated interference indication function (IDF). Victim (VT) of interference calculates IDF, using (3) and compares it with the value of the threshold interference. If the calculated IDF is greater than the threshold interference, the VT sends an interference message (IM) to its serving nodes or user equipment (UE), which then transmit the IM to the AG using network backhaul. The IM contains information about the AG cell identity (CID) used to identify the AG of a particular VT. Equations (3) and (4) as in [2] and [3] were used to determine when an IM should be sent.
I f = P M d ( jx - rx ) ) - "
IM =

I df — I Threshold otherwise
where Pi is the transmission power, у stands for log-normal shadowing, ( d^^ ) is the gap or distance between the transmitter and the receiver, β denotes the path loss and I_idf represents the IDF. In (4), I is the interference threshold. When IM = 0, the received interference by VT is taken to be negligible and IM is not sent. However, when IM= 1, it means the VT received a significant level of interference thereby prompting the IM to be sent.
The APC technique has two phases, which they used in controlling the transmission power of nodes and UEs. In the first phase, the authors set three transmission power ( P , P , p ) levels and two-time frames (TL , TL ) . Where P is the maximum, followed by and lastly P transmission power levels. On receiving an IM, the transmission power of the AG would decrease from p to p by downward power value (A^n) of - 2dB and (TL), 1 would be activated. If the same AG gets another IM within TL , it would not further decrease its power to P level until TL elapses; then it would reduce its transmission power from P to P . But when the AG has no IM and TL 1 has elapsed, the second time level TL_2 activates and the transmission power level increases from; say p to P by upward power value (Аиp) of 2 dB. The first phase of APC transmission power control is expressed mathematically as shown in (5) – (9).
P = P No interference message(5)
Pp = P = P — Adown Interference Message and TL{ starts(6)
P^ = P = P — Adawn New interference Message and ( TL )starts(7)
Pp = P = P + Aup No interference Message and TL^ starts(8)
P. = P = P + A No interference Message and TL running(9)
p m up
The second phase of the APC power control modifies the transmission power ( P ) of the first phase based on the minimum required quality of service (QoS) indication function (QoS-IF). The equation used for calculating QIF is shown in (10) as in [2,3].
QoS — IF = Pref r min (10)
min RSRP where Tmtn is minimum required SINR, Prej- is the reference signal transmission power and minRSRPj is the reference signal received power. The mathematical model for APC second phase power control is captured in (11) as in [2,3].
P apc = max( P mn mn( QoS — IF * P p , P mJ ) (11)
where P and P are maximum and minimum transmission power respectively.
-
2.3 Enhanced Active Power Control Technique
The EAPC technique employed the path loss model of en-gNB in (12) taken from [3], [8], and [9] and the loss path model of Hen-gNB in (13) taken from [2]. The path loss model ( PLHengNBBdB ) ) in (14) is an extension of the logdistance path loss model given in (15) [2]
[ PL (d)] dB = [ PL (d 0)] dB +10 n logw (d2) + faf d0
PLHen—gNB (dB) = — logw( ——)2 + 6Olog1o(P) +16.2 + lp f *4n * dd
Substituting d0 = 1 m and in (14) gives (15).
PL Hen - gNB ( dB ) = 20log io ( f :■ ) + 60log io ( d 2 ) - 11.4
where P ( d )is free space path loss, c is the speed of light, f is the frequency of transmission in MHz, and is the reference distance, while, d is the distance between the transmitter and the receiver. The received SINR is computed using (16) as in [2,9].
SINRrecieved
Ptx j PLch
^ f I co - tier + ^ f I c
+ P
where SINR is the received SINR, P is the transmission power of jth transmitter, PL is the propagation path loss, is the sum of co-tier interference, is the sum of cross-tier interference and P is the thermal f co - tier A f cross - tier n noise. The difference between the calculated SINRs and the threshold SINR as in (1), was used to determine the power control, which is expressed mathematically in (17) – (19).
|
■< 0 |
assign |
S = + 1 |
||
|
if cf=\ |
> 0 |
assign |
S = - 1 |
(17) |
|
= 0 |
assign |
S = 0 |
||
P = P ,+ S A„pr (18)
tx present EAPC
P EAPC = max( P in , min P x , P d max )) (19)
where PEAPc is the next transmission power of EAPC, Ppresent is the present transmission power, and is the adjustment power of EAPC with a value of 0.5 dB. The result of the computation from (19) will be the next transmission power for a set time duration ( Tf ). After the expiration of Tf , the system starts from the beginning to determine the next transmission power to be used.
The network transmission rate of nodes is measured using (20) - (24) as in [2].
T = BW log2(1 + SINR reCeived )
nC
Avg _ i = 1i = 1 Hen - g NB
C Hen - gNB = “
N Hen - gNB
nC
Avg _ 4j i = 1 en - gNB
C en - gNB =
N en - gNB
n
Avg _Ai = \~HUE_
CHUE N
HUE
Avg
C MUE
n
A i = 1 '-MUE
N
MUE
where T stands for throughput, Bw for bandwidth, and SINR^^ for received SINR. A n xCen-gNB stands for the sum of all en-gNB throughput, A n CHen-gNor°h the sum of all Hen-gNB throughput, A " Сми e stands for the sum of all MUE throughput, A n^ C HUE for the sum of all HUE throughput. While N en - gNB , NHen -gNB , N MUE , and N nue stands for the number of en-gNB, Hen-gNB, MUE, and HUE respectively.
The average power used by nodes and UE in communicating at different UE locations is computed using (25).
у L = NL р p Average _ Z^ L = 1 tx
tx " Nx x UEp where PAverage is the average power consumption of a node or UE. ^ ^ P is the sum of all nodes or UEs transmission power at all positions of UEs. Ntx stands for the number of nodes or UES. UEp stands for the total number of UE positions.
In this study, the power consumption rate and throughput performance of EAPC, APC, and PC1 interference mitigation techniques along uplink and downlink transmissions of 5G NSA in a Macro-Femto cellular communication were analyzed and compared for wireless system designs and reference purposes.
3. Methodology
In the section, the technique used for the comparative analysis is discussed. In the research system model used, the UEs are assumed to be uniformly distributed and MUE1 is not registered on Hen-gNB2. The model is comprised of one primary cell (macrocell) and two secondary cells (femtocells) sharing the same bandwidth. Femtocell closed access mode, was considered. The non-stand-alone (NSA) 5G model as in [6], denotes macrocell logical node B as en-gNB, and femtocell or home logical node B as Hen-gNB. Fig. 3 shows the research system model.
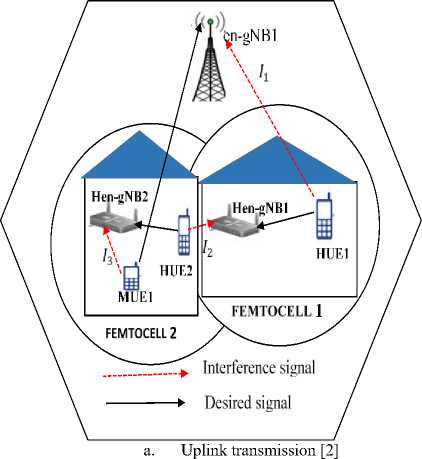
Fig. 3. System model
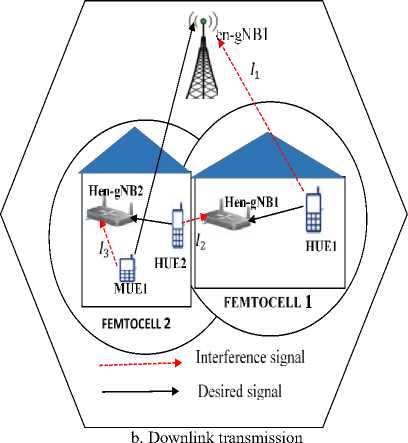
In Fig. 3, 1 1 is an interference of the uplink cross-tier, while HUE 1 is the AG, and en-gNB is the VT. I2 is an interference of the uplink co-tier, HUE 2 is the AG, and its Hen-gNB 1 is the VT. /3 is an interference of uplink cross-tier, MUE 1 is the AG, and Hen-gNB 2 is the VT. The downlink signal from Hen-gNB 2 is received as downlink cross-tier interference (/4) by MUE 1. HUE 2 positioned at the cell edge receives the signals from Hen-gNB 1 as downlink co-tier interference (/5). The downlink transmission of en-gNB1 is received by HUE1 as downlink cross-tier interference (/6).
4. Result and Discussion
The result from the simulation was in agreement with the system model and input variables as seen in Table 1 where P is the transmit power. The system input variables were sourced from [2,3,8,9]. Transmission power and throughput were used as the key performance indicators (KPIs) because interference increases when transmission power increases and throughput increases when interference reduces in networks.
Table 1. Simulation Variables
|
No. |
Parameter |
Value |
|
1. |
Maximum P of Hen-gNB |
21 dBm |
|
2. |
Maximum P of en-gNB |
46 dBm |
|
3. |
Maximum P of HUE and MUE |
23 dBm |
|
4. |
Minimum P of Hen-gNB |
0 dBm |
|
5. |
Minimum P of en-gNB |
5 dBm |
|
6. |
Minimum P of HUE and MUE |
0 dBm |
|
7. |
Initial P of HUE |
8 dBm |
|
8. |
Initial P of MUE |
34 dBm |
|
9. |
System bandwidth |
10 MHz |
|
10. |
Carrier frequency |
3.2 GHz |
|
11. |
Thermal noise |
-174 dBm |
|
12. |
Target SINR |
10 |
The throughput performance of the network and the transmission power of en-gNB and Hen-gNB, using EAPC is benchmarked with that of other associated techniques, and described in Fig. 4 – 7. Fig. 4 shows the transmission power used by en-gNB and MUE in communicating with each other.
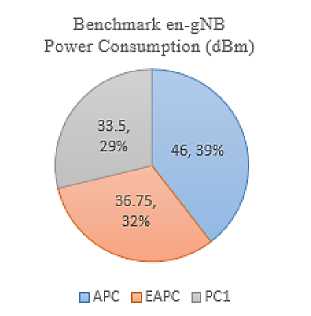
a. en-gNB power consumption
Fig. 4. Comparison of macrocell power consumption
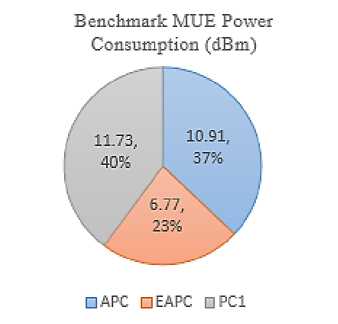
b. MUE power consumption
The results in Fig. 4 indicate that APC, EAPC, and PC1 used an average of 10.91 dBm, 6.77 dBm, and 11.73 dBm MUE transmit power respectively. The EAPC technique has the least MUE transmit power. It conserved 37.92% power when compared with APC and 42.25% when compared with PC1. The APC, EAPC, and PC1 techniques used an average of 46.00 dBm, 36.75 dBm, and 33.50 dBm. The en-gNB transmit power of the EAPC technique conserved 27.17% and 8.84% power in comparison to APC and PC1 respectively. Fig. 5 shows the power consumption of Hen-gNB and HUE when transmitting to each other.
Benchmark Hen-gNB Power Consumption (dBm)
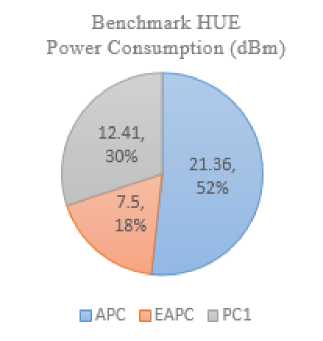
b. HUE power consumption
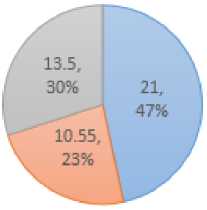
HAPC a EAPC ПРС1 a. Hen-gNB power consumption
Fig. 5. Comparison of femtocell transmission power
The downlink transmission of Hen-gNB used an average power of 21.00 dBm, 10.55 dBm, and 13.50 dBm in communicating to its UEs based on APC, EAPC, and PC1 techniques respectively. PC1 technique used the least power, lower than that of APC, and EAPC techniques by 27.17% and 8.84% respectively. The uplink transmission of HUE an average power of 21.36dBm, 7.50dBm, and 12.41dBm were used by APC, EAPC, and PC1 techniques respectively for communicating with their nodes. In comparison with APC and PC1 techniques, the EAPC technique consumed the least power. It surpassed APC by 37.92% and PC1 by 42.25%. Fig. 6 presents the Cumulative Distributive Function (CDF) of femtocell transmission rate performance.
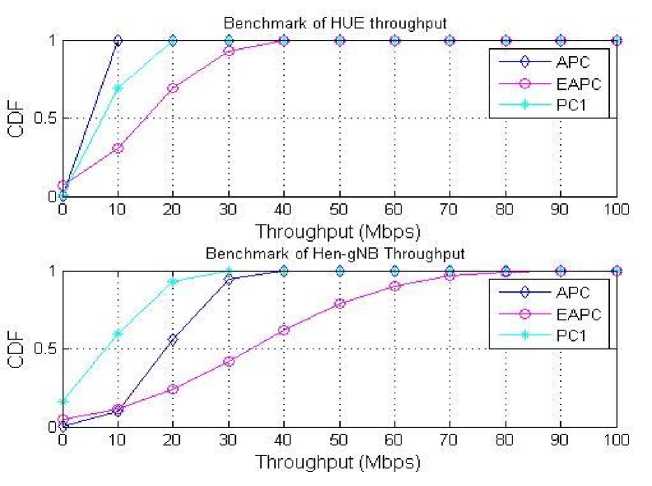
Fig. 6. Comparison of femtocell throughput
As captured in Fig. 6, the EAPC technique at 0.5 CDF has an average HUE throughout of 15.63 Mbps which outperforms those of APC (8.00 Mbps) and PC1 (7.50 Mbps) by 48.82 % and 52.02% respectively. At 0.5 CDF, the EAPC technique has an average Hen-gNB throughout of 33.75 Mbps that outperforms those of APC (8.13 Mbps) and PC1 (18.75 Mbps) by 75.91% and 44.44% respectively. Fig. 7 presents the result of MUE and en-gNB throughput.
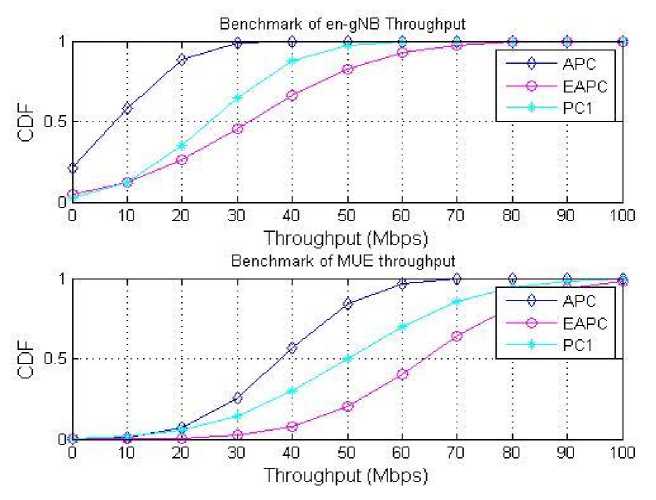
Fig. 7. Comparison of macrocell throughput
In Fig. 7, the EAPC technique at 0.5 CDF has an average MUE throughout of 63.75 Mbps, which outperforms those of APC (37.5 Mbps) and PC1 (50.00 Mbps) by 41.18% and 21.57% respectively. The EAPC technique at 0.5 CDF has an average en-gNB throughout of 32.50 Mbps that outperforms those of APC (7.50 Mbps) and PC1 (25.00 Mbps) by 76.92% and 23.08% respectively.
5. Conclusion
This research considered the downlink and uplink transmission of Macro–Femto HetNet, and compared the power consumption and throughput performance of APC, EAPC, and PC1 techniques. Findings from the MATLAB of the three (3) techniques revealed that the EAPC technique has less MUE, HUE, and Hen-gNB power consumption rate when benchmarked with APC and PC1 techniques. The EAPC technique was limited in conserving en-gNB power when benchmarked with PC1. Conversely, the EAPC throughput of MUE, HUE, Hen-gNB, and en-gNB at 0.5 CDF outperforms those of APC and PC1 techniques. The improved EAPC throughout is attributed to the fact that the EAPC technique is characterized by less interference and reduced transmission power in the Macro-Femto cellular communication networks. The result of this work will be very useful in selecting a suitable interference mitigation technique in the design of wireless systems for Macro-Femto heterogenous networks.
References Comparative Analysis of Macro-Femto Networks Interference Mitigation Techniques
- C. Onu, B. A. Salihu, and J. Abolarinwa, “Enhanced Fractional Frequency Reuse in Lte-A Heterogeneous OFDMA Network,” ATBU J. Sci. Technol. Educ., vol. 6, no. 2, pp. 18–27, 2018.
- K. P. Dawar, U. A. Usman, and B. A. Salihu, “An enhanced active power control technique for interference mitigation in 5G uplink macro-femto cellular network,” in Proceedings of the 2020 IEEE 2nd International Conference on Cyberspace, CYBER NIGERIA 2020, 2021, vol. 2, pp. 85–90, doi: 10.1109/CYBERNIGERIA51635.2021.9428852.
- T. U. Hassan and F. Gao, “An Active Power Control Technique for Downlink Interference Management in a Two-Tier Macro−Femto Network,” Sensors (Basel)., vol. 19, no. 9, pp. 2015 – 2022, 2019, doi: 10.3390/s19092015.
- M. Feng, G. Li, and W. Gong, “Heterogeneous network resource allocation optimization based on improved bat algorithm,” in Proceedings - 2018 International Conference on Sensor Networks and Signal Processing, SNSP 2018, 2019, pp. 55–59, doi: 10.1109/SNSP.2018.00020.
- M. A. Habibi, M. Nasimi, B. Han, and H. D. Schotten, “A Comprehensive Survey of RAN Architectures Toward 5G Mobile Communication System,” IEEE Access, vol. 7, pp. 70371–70421, 2019, doi: 10.1109/ACCESS.2019.2919657.
- 3GPP TR 21.915, “Digital cellular telecommunications system (Phase 2+) (GSM); Universal Mobile Telecommunications System (UMTS); LTE; 5G; Release description; Release 15,” 3rd Gener. Partnersh. Proj. (3GPP), Tech. Rep. 21.915 version 15.0.0, vol. 0, pp. 1–120, 2019.
- M. Ghanbarisabagh, G. Vetharatnam, E. Giacoumidis, and S. Momeni Malayer, “Capacity Improvement in 5G Networks Using Femtocell,” Wirel. Pers. Commun., vol. 105, no. 3, pp. 1027–1038, 2019, doi: 10.1007/s11277-019-06134-2.
- M. Susanto, R. Hutabarat, Y. Yuniati, and S. Alam, “Interference Management using power control for uplink transmission in femtocell-macrocell cellular communication network,” in QiR 2017 - 2017 15th International Conference on Quality in Research (QiR): International Symposium on Electrical and Computer Engineering, 2017, vol. 2017-December, pp. 245–250, doi: 10.1109/QIR.2017.8168490.
- M. Susanto, D. Fauzia, Melvi, and S. Alam, “Downlink power control for interference management in femtocell-macrocell cellular communication network,” in QiR 2017 - 2017 15th International Conference on Quality in Research (QiR): International Symposium on Electrical and Computer Engineering, 2017, vol. 2017-December, pp. 479–484, doi: 10.1109/QIR.2017.8168533.
- A. U. Syed and P. Aashish, “Maximization of SINR in Femtocell Network,” Int. J. Electr. Electron. Comput. Eng., vol. 6, no. 1, pp. 114 – 117.
- T. Leanh, N. H. Tran, S. Lee, E. N. Huh, Z. Han, and C. S. Hong, “Distributed Power and Channel Allocation for Cognitive Femtocell Network Using a Coalitional Game in Partition-Form Approach,” IEEE Trans. Veh. Technol., vol. 66, no. 4, pp. 3475–3490, 2017, doi: 10.1109/TVT.2016.2536759.
- S. Kilaru and A. Gali, “Improving Quality of Service of Femto Cell Using Optimum Location Identification,” Int. J. Comput. Netw. Inf. Secur., vol. 7, no. 10, pp. 35–41, 2015, doi: 10.5815/ijcnis.2015.10.04.
- R. S and S. G K, “Interference Mitigation and Mobility Management for D2D Communication in LTE-A Networks,” Int. J. Wirel. Microw. Technol., vol. 9, no. 2, pp. 20–31, 2019, doi: 10.5815/ijwmt.2019.02.03.
- C. Kemdirim Agubor, A. Olukunle Akande, and R. Opara, “Interference Mitigation in Wireless Communication – A Tutorial on Spread Spectrum Technology,” Int. J. Wirel. Microw. Technol., vol. 11, no. 5, pp. 26–34, 2021, doi: 10.5815/ijwmt.2021.05.04.
- A. M. Alaa and H. Tawfik, “Interference Mitigation Techniques for Spectral Capacity Enhancement in GSM Networks,” Int. J. Wirel. Microw. Technol., vol. 4, no. 1, pp. 20–49, 2014, doi: 10.5815/ijwmt.2014.01.03.
