Comparative analysis of regional differences in healthcare, environment, and public health

Author: Lavrinenko Petr Aleksandrovich, Rybakova Darya Aleksandrovna
Journal: Economic and Social Changes: Facts, Trends, Forecast @volnc-esc-en
Section: Young researchers
Article in issue: 5 (41) т.8, 2015.
Free access
The article compares Russia's regions on the basis of the current state of affairs in healthcare, environment and public health. The comparison was performed using econometric techniques, namely, cluster analysis. The authors used the statistics obtained from Rosstat's official publications as initial data. The first parameter - “public health” - uses indicators of life expectancy and the total morbidity rate due to all causes. The second parameter - “environment” - analyzes the indicators of emissions of harmful substances into the atmosphere and discharge of contaminated water into waste water. The sphere of healthcare was analyzed with the help of four indicators such as the number of beds per 100,000 population, the number of hospitals, the number of doctors per 10,000 population and the capacity of hospitals. After the analysis, the authors created a scatter plot for each group of indicators, and compiled a table that shows the structural and qualitative developments in the regions during the 2000s...
Health care, public health, environment, human capital, cluster analysis, regional analysis, econometric analysis, regional development
Short address: https://sciup.org/147223764
IDR: 147223764 | UDC: 332.055.2 | DOI: 10.15838/esc/2015.5.41.14
Text of the scientific article Comparative analysis of regional differences in healthcare, environment, and public health
Modern science considers the quality of human capital to be one of the main driving forces of competitiveness of regional economy. This factor depends on many other parameters: the level of education, social welfare, average wages, and so on1. The present paper studies regional characteristics of the following parameters of human capital: physical health, healthcare system, and environmental situation.
It should be noted that the improvement of the public health situation and environmental conservation is a goal of various government programs, for which large funds are allocated. At the same time, there is a need to assess the effectiveness of the use of public funds allocated to healthcare and environmental protection. Effectiveness analysis helps to relate any changes in the expenditures on healthcare and environment to the changes in public health. This analysis can be performed in different ways. One of them is to carry out public opinion surveys on a regular basis. In the framework of the surveys, the respondents evaluate the results of various activities in the social sphere using, for instance, a five-point system with the ratings ranging from “very poor” to “very good”. This method has not only significant advantages, but also certain significant drawbacks. The high level of information noise is a disadvantage of this method. Information noise in this case denotes the fact that people usually cannot abstract away from emotions, from the influence of the media or public opinion, etc., and give an objective assessment of the change.
That is why it is so important to create an effective econometric assessment model based on independent statistical data. It was decided to use cluster analysis at the first stage of the study. The method of k-means was chosen for this purpose. The essence of this method consists in arranging the m-number of available observations into the k-number of clusters, with each observation belonging to the cluster to which center (centroid) it is closest. This approach helps classify all of the Russian regions according to their degree of development into three groups: public health, the level of environment and the level of healthcare; it also helps identify “leaders” and “outsiders” and shows the scale of differentiation of the regions. The identification of “outsiders” will help the government to provide targeted support more accurately.
The number of gradations of development was determined by creating scatter plots, which used the data on all the regions of Russia for 10 years (thus, the scatter plots contain more than 800 points). The axes were represented by the initial main indicators for the first two groups (health and environment) and the main components for the third group (healthcare). The graphs showed that the regions did not form any specific groups. Therefore, in order to make a better structuring of the regions, five gradations were selected. Such gradations are relative, it means that the best region is the best in relation to less developed ones, but not in general. These gradations had the following characteristics:
– high level of development;
– good level of development (above average);
– average level of development;
– poor level of development (below average);
– low level of development.
A classification based on these gradations makes it possible to compare all the regions not only among themselves but also each one with itself, in other words, the analysis helps understand how the level of environmental development correlates with the level of health. Furthermore, the dynamics of changes in the parameters (from 2000 to 2010 – for group 1, from 2001 to 2011 – for group 2, and from 1997 to 2011 – for group 3) was analyzed.
The simulation using the statistical package Stata produces a column, in which each region in each year is assigned its own cluster number (from 1 to 5). These numbers are not increasing or decreasing, they simply unite the regions under a single cluster name (a digit – in this case). In the future it is determined what number the appropriate gradation belongs to out of the previously proposed ones.
The above statistics are taken from official publications of Rosstat. For those years for which data were missing, a formal request was made to Rosstat.
The indicators such as life expectancy and general morbidity rate due to all causes were used for the first parameter – “public health”. The emissions of harmful substances into the atmosphere and the discharge of contaminated water in waste water were analyzed for the second parameter – “environment”. The third parameter consists of four indicators: the number of beds per 100,000 population, the number of hospitals, the number of doctors per 10,000 population and the capacity of hospitals.
These very indicators were chosen because of the problem of data availability for the 2000–2005 period. The data for all the years under review are available only for the indicators chosen for the purposes of the present research.
For obvious reasons, the basic data are not given in the article, since they represent huge tables. It is necessary to do the initial analysis prior to the econometric analysis. It is a visual analysis of the statistics.
-
1. Life expectancy (LE). In the first place it is necessary to point out the positive dynamics of growth. For the past 12 years (1999–2011), LE in Russia grew by almost four years – from 66 to 70. In some regions of the country the growth was somewhat greater: for example, the index increased by 6 years in Moscow, and in the republics of Ingushetia and Tyva. The lowest growth is observed
-
2. Morbidity rate in the regions of the Russian Federation . This indicator is calculated per 1,000 population. During 16 years there was a 16% increase in the number of registered patients with a diagnosis set for the first time in their life. There can be several reasons for such growth. First, it can be that population morbidity just increases due to various reasons (or the general aging of the population). Second, it may be caused by the growth of public trust in the healthcare system. If earlier people preferred self-treatment, then nowadays more and more patients choose qualified professional medical aid.
-
3. Emissions of atmospheric pollutants from stationary sources . In Russia as a whole, the volume of harmful emissions decreased by 10%. However, we can observe the opposite trend in its regions. In some regions the volume decreased by 50–60%, sometimes – by 70%. In others the increase amounted to 100–130%. The regions of the Ural Federal Districts are leaders both in absolute values and in the rate of growth (which is obviously linked to the development of the processing industry in this area). Abrupt changes in different regions may be explained by the shutdown or relocation of enterprises, changes in the conditions of counting, etc.
-
4. Emission of polluted wastewater into surface water bodies . In general on the territory of the Russian Federation, emissions of contaminated water in surface reservoirs reduced by 35%. There are no regions in which a significant growth is observed. The statistical data actually shows positive trends in this indicator. The reasons may lie in the improvement of the technological process of industrial production, and the strengthening of legislative measures.
-
5. Number of hospital beds per 10,000 population . The number of hospital beds decreased by 25% in all the regions of the Russian Federation. The indicator demonstrates positive dynamics only in one region – the Murmansk Oblast (the growth amounted to 15%). Taking into account the increase in the capacity of hospitals and the growth of investments in healthcare, we can assume that the decrease in the number of beds was caused by the optimization of the system and by improving the quality of healthcare.
-
6. Number of doctors per 10,000 population . The number of doctors nationwide increased by 10% in 17 years. A positive trend in this respect is observed practically in all regions. Such a picture seems logical given the growth of investment in healthcare, growth of average wages, reduction in the number of hospitals and increase in the capacity of hospitals.
-
7. Number of hospitals . Number of hospitals in Russia decreased by 49% in 17 years. It is difficult to judge about the reasons for such dynamics. There is a program for “modernization of the healthcare system”, which led to this result.
-
8. Capacity of medical outpatient clinics per 10,000 population . The capacity of hospitals
in the Far Eastern Federal District, where, LE grew by 2.58 years (and in Chukotka Autonomous Okrug it even dropped by 0.02 years). The highest growth rate is observed in the Northwestern Federal District, where it was 4.6 years. Ingushetia has the maximum absolute value of 76.3 years, and the minimum value is 61.3 years (surprisingly, it is observed in Tuva, which demonstrated the greatest growth – from 55 to 61.39 years).
increased by 12% on average for all the regions of the Russian Federation. Most likely this is a consequence of the reduction in the number of hospitals; and since the growth rate of morbidity was 16% in the same period, the number of visits to the remaining hospitals is growing.
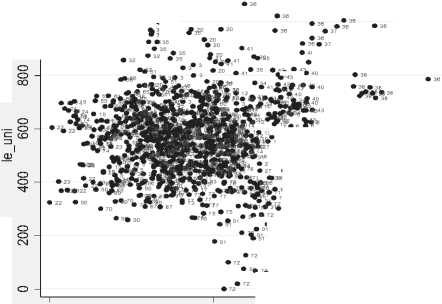
Indicator of the level of public health
This indicator is based on the indicators of life expectancy (le_uni) and total morbidity due to all causes (mp_uni) 2.
The following results were obtained after analyzing the scatter plot ( fig. 1 ).
The most pronounced outsiders are Nenets Autonomous Okrug (number 25 corresponds to the region number in the source statistical data), Tuva Republic (72), Chukotka Autonomous Okrug (91) and, to a lesser extent, the Jewish Autonomous Oblast (90) and Zabaikalsky Krai (75).
Alcohol addiction, the low levels of healthcare and social security are possible reasons for such a low life expectancy and high morbidity in the regions-outsiders.
The leaders in the level of people’s health are as follows: the Republic of Ingushetia (36), the city of Moscow (20), the Chechen Republic (37), the Karachay-Cherkess Republic (40), the Republic of North Ossetia-Alania (41), and the Kabardino-Balkar Republic (38).
This circumstance reflects the fact that people who live in the Caucasian republics usually fall ill more seldom and live longer in comparison with the inhabitants of other regions of Russia.
The full results of the cluster analysis are shown in table 1 .
Figure 1. Scatter plot of the regions by indicators of life expectancy (le_uni) and level of total morbidity (mp_uni)
36 37
40 37 3 4 47 0 0 3740 * 3388
37 38
42 345432 43■
816 282782128
191 28
2 72
91 91 72
• 72
mp_uni
91 72
72 72
-
12 101 1 0 0286 ; 66 81 6
10 • 2 8 8 1
• 81
• 28
27 • 28 • 86
27 2 8 6
Table 1. Cluster analysis of the Russian regions according to the integrated indicator of health level
|
Region/year |
2000 |
2010 |
Region/year |
2000 |
2010 |
|
Voronezh Oblast |
high |
high |
Belgorod Oblast |
good |
good |
|
Kursk Oblast |
good |
high |
Kaliningrad Oblast |
poor |
medium |
|
City of Moscow |
medium |
high |
Murmansk Oblast |
low |
medium |
|
Leningrad Oblast |
poor |
high |
City of Saint Petersburg |
good |
medium |
|
Chechen Republic |
- |
high |
Republic of Dagestan |
high |
medium |
|
Kabardino-Balkar Republic |
high |
high |
Vologda Oblast |
low |
medium |
|
Karachay-Cherkess Republic |
high |
high |
Rostov Oblast |
good |
medium |
|
Republic of South Ossetia-Alania |
high |
high |
Republic of Bashkortostan |
medium |
medium |
|
Krasnodar Krai |
high |
high |
Mari El Republic |
low |
medium |
|
Stavropol Krai |
high |
high |
Republic of Tatarstan |
good |
medium |
|
Republic Ingushetia |
high |
high |
Udmurtia Republic |
medium |
medium |
|
Kaluga Oblast |
low |
good |
Chuvash Republic |
good |
medium |
|
Lipetsk Oblast |
good |
good |
Kirov Oblast |
good |
medium |
|
Moscow Oblast |
good |
good |
Nizhny Novgorod Oblast |
good |
medium |
|
Ryazan Oblast |
good |
good |
Orenburg Oblast |
low |
medium |
|
Smolensk Oblast |
poor |
good |
Perm Oblast |
low |
medium |
|
Tambov Oblast |
good |
good |
Samara Oblast |
low |
medium |
|
Tula Oblast |
poor |
good |
Ulyanovsk Oblast |
good |
medium |
|
Pskov Oblast |
poor |
good |
Kurgan Oblast |
low |
medium |
|
Republic of Adygea |
high |
good |
Tyumen Oblast |
medium |
medium |
|
Republic of Kalmykia |
good |
good |
Khanty-Mansi Autonomous Okrug – Yugra |
medium |
medium |
|
Astrakhan Oblast |
good |
good |
Chelyabinsk Oblast |
low |
medium |
|
Volgograd Oblast |
good |
good |
Altai Republic |
low |
medium |
|
Republic of Mordovia |
good |
good |
Republic of Khakassia |
poor |
medium |
|
Penza Oblast |
good |
good |
Altai Krai |
medium |
medium |
|
Saratov Oblast |
good |
good |
Krasnoyarsk Krai |
low |
medium |
|
Sverdlovsk Oblast |
poor |
good |
Novosibirsk Oblast |
good |
medium |
|
Republic of Buryatia |
poor |
good |
Republic of Sakha (Yakutia) |
low |
medium |
|
Kemerovo Oblast |
poor |
good |
Tyva Republic |
poor |
poor |
|
Omsk Oblast |
good |
good |
Chukotka Autonomous Okrug |
poor |
poor |
|
Тomsk Oblast |
poor |
good |
Novgorod Oblast |
low |
low |
|
Kamchatka Krai |
poor |
good |
Zabaykalsky Krai |
poor |
low |
|
Primorsky Krai |
good |
good |
Irkutsk Oblast |
poor |
low |
|
Khabarovsk Krai |
poor |
good |
Amur Oblast |
poor |
low |
|
Bryansk Oblast |
good |
medium |
Sakhalin Oblast |
low |
low |
|
Vladimir Oblast |
low |
medium |
Jewish Autonomous Oblast |
low |
low |
|
Ivanovo Oblast |
low |
medium |
Nenets Autonomous Okrug |
||
|
Kostroma Oblast |
poor |
medium |
Yamalo-Nenets Autonomous Okrug |
||
|
Oryol Oblast |
low |
medium |
Magadan Oblast |
low |
|
|
Tver Oblast |
poor |
medium |
High (number of regions) |
9 |
10 (grew by 11%) |
|
Yaroslavl Oblast |
medium |
medium |
Good (number of regions) |
23 |
24 (grew by 4%) |
|
Republic of Karelia |
low |
medium |
Medium (number of regions) |
7 |
38 (grew 5-fold) |
|
Komi Republic |
low |
medium |
Poor (number of regions) |
19 |
2 (decreased by 90%) |
|
Arkhangelsk Oblast |
low |
medium |
Low (number of regions) |
22 |
6 (decreased by 63%) |
The analysis shows that the dynamics of the situation is clearly positive. In 2010, the number of regions that in 2000 were included in the cluster with the “poor level of development” decreased by 90%, and the number of regions with the “low level of development” decreased by 63%. Most of them moved to the cluster of regions with the “medium level of development”.
Indicator of the level of ecological cleanliness of the region
The value of this indicator includes the statistics on the emissions of harmful substances into the atmosphere and emissions of contaminated water in waste water3.
The analysis of these data has revealed that the situation concerning environmental security is the worst in the following regions: Krasnoyarsk Krai (76), the Tumen Oblast (65),
Khanty-Mansi Autonomous Okrug (66), the Irkutsk Oblast (77), Krasnodar Krai (42), the Sverdlovsk Oblast (64). The environmental situation is more favorable in the rest of the regions (fig. 2 and tab. 2) .
Many regions (70%) belong to the cluster with the “high level of development” of environmental security and they are characterized by a cleaner environment compared with other regions. Primarily this is due to the fact that the majority of Russia’s large industrial enterprises are concentrated in the regions-outsiders mentioned above. And many regions do not have a developed industrial sector at all. Only 9 out of 83 regions were included in the clusters with the level of development lower than good. The dynamics of change in 10 years was very moderate, because the manufacturing specialization of regions as a whole remains what it was.
Figure 2. Scatter plot of the regions in terms of emissions of contaminated water (pws) and polluted air (eap)
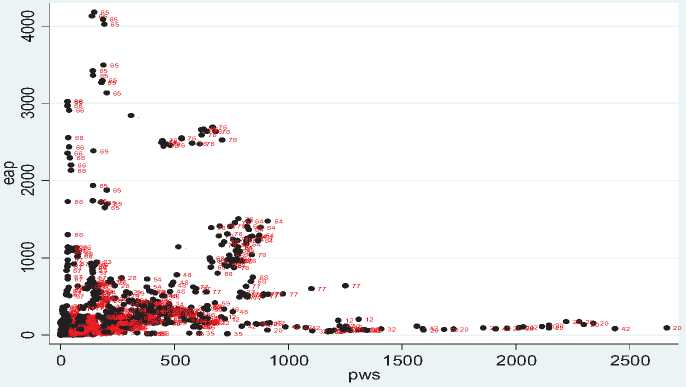
Table 2. Cluster analysis of the Russian regions according to the index of environmental cleanliness
|
Region/year |
2000 |
2010 |
Region/year |
2000 |
2010 |
|
Belgorod Oblast |
high |
high |
Republic of Khakassia |
high |
high |
|
Bryansk Oblast |
high |
high |
Altai Krai |
high |
high |
|
Vladimir Oblast |
high |
high |
Zabaykalsky Krai |
high |
high |
|
Voronezh Oblast |
high |
high |
Novosibirsk Oblast |
high |
high |
|
Ivanovo Oblast |
high |
high |
Omsk Oblast |
high |
high |
|
Kaluga Oblast |
high |
high |
Тomsk Oblast |
high |
high |
|
Kostroma Oblast |
high |
high |
Republic of Sakha (Yakutia) |
high |
high |
|
Kursk Oblast |
high |
high |
Kamchatka Krai |
high |
high |
|
Lipetsk Oblast |
good |
high |
Khabarovsk Krai |
high |
high |
|
Oryol Oblast |
high |
high |
Amur Oblast |
high |
high |
|
Ryazan Oblast |
high |
high |
Magadan Oblast |
high |
high |
|
Smolensk Oblast |
high |
high |
Sakhalin Oblast |
high |
high |
|
Tambov Oblast |
high |
high |
Jewish Autonomous Oblast |
high |
high |
|
Tver Oblast |
high |
high |
Chukotka Autonomous Okrug |
high |
high |
|
Tula Oblast |
good |
high |
Komi Republic |
good |
good |
|
Yaroslavl Oblast |
high |
high |
Arkhangelsk Oblast |
good |
good |
|
Republic of Karelia |
high |
high |
Vologda Oblast |
good |
good |
|
Nenets Autonomous Okrug |
high |
high |
Leningrad Oblast |
good |
good |
|
Kaliningrad Oblast |
high |
high |
Murmansk Oblast |
good |
good |
|
Novgorod Oblast |
high |
high |
Krasnodar Krai |
medium |
good |
|
Pskov Oblast |
high |
high |
Republic of Bashkortostan |
good |
good |
|
Republic Adygea |
high |
high |
Republic of Tatarstan |
good |
good |
|
Republic Dagestan |
high |
high |
Kirov Oblast |
good |
good |
|
Republic Ingushetia |
high |
high |
Orenburg Oblast |
good |
good |
|
Chechen Republic |
high |
high |
Penza Oblast |
good |
good |
|
Kabardino-Balkar Republic |
high |
high |
Samara Oblast |
good |
good |
|
Republic Kalmykia |
high |
high |
Irkutsk Oblast |
good |
good |
|
Karachay-Cherkess Republic |
high |
high |
Primorsky Krai |
good |
good |
|
Stavropol Krai |
high |
high |
City of Moscow |
medium |
good |
|
Astrakhan Oblast |
high |
high |
Moscow Oblast |
good |
medium |
|
Volgograd Oblast |
good |
high |
City of Saint Petersburg |
medium |
medium |
|
Rostov Oblast |
good |
high |
Sverdlovsk Oblast |
poor |
poor |
|
Mari El Republic |
high |
high |
Yamalo-Nenets Autonomous Okrug |
good |
poor |
|
Republic of Mordovia |
high |
high |
Chelyabinsk Oblast |
poor |
poor |
|
Udmurtia Republic |
high |
high |
Kemerovo Oblast |
poor |
poor |
|
Chuvash Republic |
high |
high |
Tyumen Oblast |
poor |
low |
|
Nizhny Novgorod Oblast |
high |
high |
Khanty-Mansi Autonomous Okrug – Yugra |
poor |
low |
|
Perm Oblast |
high |
high |
Krasnoyarsk Krai |
low |
low |
|
Saratov Oblast |
high |
high |
Republic of South Ossetia-Alania |
||
|
Ulyanovsk Oblast |
high |
high |
High (number of regions) |
54 |
58 (grew by 7%) |
|
Kurgan Oblast |
high |
high |
Good (number of regions) |
19 |
15 (decreased by 21%) |
|
Republic of Altai |
high |
high |
Medium (number of regions) |
3 |
2 (decreased by 33%) |
|
Republic Buryatia |
high |
high |
Poor (number of regions) |
5 |
4 (decreased by 20%) |
|
Tyva Republic |
high |
high |
Low (number of regions) |
1 |
3 (grew 3-fold) |
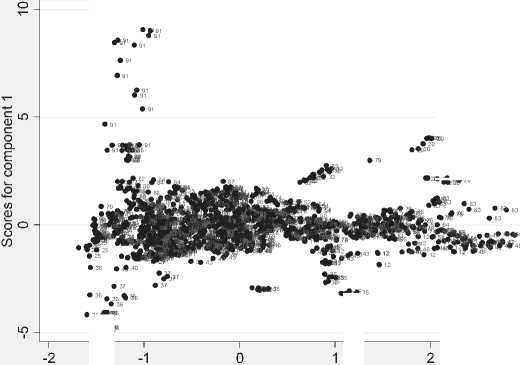
Indicator of the level of healthcare
This indicator is constructed on the basis of four indicators: the number of hospital beds per 100,000 population, the number of hospitals, the number of doctors per 10,000 population and the capacity of hospitals. We did not include the monetary indicators such as average wages and the investment in the healthcare industry because they do not show the current level of development, correlate strongly with other indicators and make a lot of noise when included in the indicator, that is why the clustering process does not distribute the indicators adequately.
In this case, we used the principal component method (PCM) in order to construct the two principal components that afterwards were used for creating a scatter plot and clustering the regions.
The city of Moscow (20), Chukotka Autonomous Okrug (91), the Republic of Sakha (83), Saint Petersburg (32), the Novosibirsk Oblast (79), the Amur Oblast (87), Krasnoyarsk Krai (76) were the leaders in providing the population with healthcare services.
These results need to be commented on. The Republic of Sakha and Chukotka Autonomous Okrug are among the leading regions by the level of development of healthcare; earlier in the course of our analysis, these regions were included in the clusters with the low level of development of public health. This is a purely statistical phenomenon that is explained, on the one hand, by the small population of these regions, and, on the other hand, by the method of calculation of healthcare indicators (per 100,000 people).
Figure 3. Scatter plot of the regions in terms of the number of hospital beds per 100,000 population, the number of hospitals, the number of doctors per 10,000 population and the capacity of hospitals
Scores for component 2
36 3 33 6 66
220 2 200020200 2020
Table 3. Cluster analysis in terms of the level of healthcare development
|
Region/year |
1997 |
2011 |
Region/year |
1997 |
2011 |
|
Vladimir Oblast |
medium |
high |
Novosibirsk Oblast |
good |
medium |
|
Lipetsk Oblast |
medium |
high |
Omsk Oblast |
poor |
medium |
|
Yaroslavl Oblast |
medium |
high |
Primorsky Krai |
poor |
medium |
|
Komi Republic |
medium |
high |
Khabarovsk Krai |
medium |
medium |
|
Arkhangelsk Oblast |
medium |
high |
Republic Dagestan |
poor |
poor |
|
Vologda Oblast |
medium |
high |
Krasnodar Krai |
good |
poor |
|
Murmansk Oblast |
low |
high |
Belgorod Oblast |
medium |
low |
|
Novgorod Oblast |
low |
high |
Bryansk Oblast |
medium |
low |
|
City of Saint Petersburg |
high |
high |
Ivanovo Oblast |
poor |
low |
|
Astrakhan Oblast |
medium |
high |
Kaluga Oblast |
low |
low |
|
Mari El Republic |
medium |
high |
Kostroma Oblast |
low |
low |
|
Chuvash Republic |
medium |
high |
Kursk Oblast |
medium |
low |
|
Republic of Altai |
high |
high |
Oryol Oblast |
low |
low |
|
Tyva Republic |
high |
high |
Ryazan Oblast |
medium |
low |
|
Republic Khakassia |
high |
high |
Smolensk Oblast |
medium |
low |
|
Republic of Sakha (Yakutia) |
good |
high |
Tambov Oblast |
poor |
low |
|
Kamchatka Krai |
low |
high |
Republic of Karelia |
low |
low |
|
Amur Oblast |
medium |
high |
Nenets Autonomous Okrug |
low |
low |
|
Magadan Oblast |
high |
high |
Kaliningrad Oblast |
low |
low |
|
Chukotka Autonomous Okrug |
high |
high |
Leningrad Oblast |
medium |
low |
|
Moscow Oblast |
good |
good |
Pskov Oblast |
low |
low |
|
City of Moscow |
good |
good |
Republic Adygea |
low |
low |
|
Chelyabinsk Oblast |
good |
good |
Republic Ingushetia |
low |
low |
|
Voronezh Oblast |
poor |
medium |
Chechen Republic |
low |
|
|
Tver Oblast |
poor |
medium |
Kabardino-Balkar Republic |
low |
low |
|
Tula Oblast |
medium |
medium |
Republic Kalmykia |
low |
low |
|
Volgograd Oblast |
good |
medium |
Karachay-Cherkess Republic |
low |
low |
|
Rostov Oblast |
good |
medium |
Republic of South Ossetia-Alania |
low |
low |
|
Republic of Bashkortostan |
good |
medium |
Stavropol Krai |
poor |
low |
|
Republic of Tatarstan |
good |
medium |
Republic Mordovia |
low |
low |
|
Udmurtia Republic |
medium |
medium |
Perm Oblast |
poor |
low |
|
Kirov Oblast |
poor |
medium |
Ulyanovsk Oblast |
medium |
low |
|
Nizhny Novgorod Oblast |
good |
medium |
Kurgan Oblast |
low |
low |
|
Orenburg Oblast |
good |
medium |
Yamalo-Nenets Autonomous Okrug |
low |
low |
|
Penza Oblast |
poor |
medium |
Republic Buryatia |
poor |
low |
|
Samara Oblast |
medium |
medium |
ZabaykalskyKrai |
poor |
low |
|
Saratov Oblast |
poor |
medium |
Тomsk Oblast |
low |
low |
|
Sverdlovsk Oblast |
good |
medium |
Sakhalin Oblast |
low |
low |
|
TyumenOblast |
good |
medium |
Jewish Autonomous Oblast |
low |
low |
|
Khanty-Mansi Autonomous Okrug – Yugra |
medium |
medium |
High (number of regions) |
6 |
20 (grew by 230%) |
|
Of Altai Krai |
good |
medium |
Good (number of regions) |
17 |
3 (decreased by 80%) |
|
Krasnoyarsk Krai |
good |
medium |
Medium (number of regions) |
22 |
25 (grew by 13%) |
|
Irkutsk Oblast |
good |
medium |
Poor (number of regions) |
15 |
2 (decreased by 86%) |
|
Kemerovo Oblast |
poor |
medium |
Low (number of regions) |
22 |
33 (grew by 50%) |
It is noteworthy that the level of healthcare development in the Republic of Ingushetia is low (36). It looks very paradoxical, given the fact that life expectancy in Ingushetia is one of the highest in Russia. Other regions with a low level of public health include the Chechen Republic (37), the Karachay-Cherkess Republic (40), and Nenets Autonomous Okrug (25).
The analysis of the healthcare situation in the Russian regions allows the following conclusions to be made. First, it is necessary to note the ambiguous dynamics of the situation. In 10 years there was a 6–7-fold reduction in the number of the regions in the clusters with the “good” and “poor” level of development; at the same time, the clusters with the “high” and “low” levels of development increased by 2.3 and 1.5 times, respectively. The uniform dynamics in Russia is absent, because the growth is bipolar. Let us explain the possible reasons for such bipolar dynamics. One of the probable reasons is the closing of many hospitals in some regions and the establishment of health centers in others. The second possible reason lies in the method of calculating healthcare indicators. Since they are calculated per 100,000 people, then as the quantitative composition of the population changes, so do these indicators.
Conclusions
According to the analysis, the level of health in Russia is growing, and the level of morbidity remains virtually stable. The environmental situation is also stable. The allocation of significant funds to the development of medicine has produced positive results. Life expectancy – the main indicator of efficiency of investments in healthcare – is increasing. One of the biggest healthcare challenges is the increase in the regions that are not covered by medical care, because the centralization of this sector is convenient and favorable for the budget, but extremely unfavorable for the population.
References Comparative analysis of regional differences in healthcare, environment, and public health
- Aivazyan S.A. Analiz kachestva i obraza zhizni naseleniya. Ekonometricheskii podkhod . Moscow: Nauka, 2012. 432 p.
- Aivazyan S.A., Stepanov V.S., Kozlova M.I. Izmerenie sinteticheskikh kategorii kachestva zhizni naseleniya regiona i vyyavlenie klyuchevykh napravlenii sovershenstvovaniya sotsial'no-ekonomicheskoi politiki (na primere Samarskoi oblasti i ee munitsipal'nykh obrazovanii) . Prikladnaya ekonometrika , 2006, no. 2, pp. 18-84.
- Verbeek M. Putevoditel' po sovremennoi ekonometrike . Moscow: Nauchnaya kniga, 2008. 616 p.
- Ketova N.P., Ovchinnikov V.N. Model'nyi instrumentarii rezul'tativnogo upravleniya v resursnom regione. Problemy prognozirovaniya, 2014, no. 2.
- Kolomak E.A. Ekonometricheskii analiz panel'nykh dannykh: ucheb. posobie . NGU. Novosibirsk, 2007. 48 p.
- Lavrinenko P.A. Analiz investitsionnoi privlekatel'nosti proektov v ekologicheskoi sfere . Problemy prognozirovaniya , 2013, no. 5.
- Publikatsii “Demograficheskii ezhegodnik Rossii” (2002, 2005, 2006, 2007, 2008, 2009, 2010 gg.). Available at: http://www.gks.ru/wps/wcm/connect/rosstat_main/rosstat/ru/statistics/publications/catalog/doc_1137674209312
- Publikatsii “Zdravookhranenie v Rossii” (2001, 2005, 2007, 2009, 2011 gg.). Available at: http://www.gks.ru/wps/wcm/connect/rosstat_main/rosstat/ru/statistics/publications/catalog/doc_1139919134734
- Publikatsii “Okhrana okruzhayushchei sredy v Rossii” (2001, 2006, 2008, 2010 gg.). Available at: http://www.gks.ru/wps/wcm/connect/rosstat_main/rosstat/ru/statistics/publications/catalog/doc_1139919459344
- Metodologicheskie rekomendatsii po formirovaniyu pokazatelei prirodookhrannykh raskhodov s uchetom mezhdunarodnogo opyta . Available at: http://www.gks.ru/free_doc/new_site/oxrana/met_oxrrek%20.htm
- Annual Health Econometrics Workshop. Available at: www.healtheconometrics.org
- Sait Vsemirnogo ekonomicheskogo foruma . Available at: http://reports.weforum.org/human-capital-index-2013/
