Comparative assessment of the housing reproduction efficiency at the regional level

Free access
The article describes the testing method of assessing the effectiveness of reproduction housing on the example of the Urals Federal District: Tyumen (without autonomous region), Kurgan, Sverd-lovsk and Chelyabinsk region. The method based on the calculation of the integraete index for the assessment of housing reproduction efficiency and average growth rate characterizing the dynamics of housing reproduction. Evaluating the effectiveness of the reproduction of the housing stock was carried out for the period of 6 years from 2010 to 2015 inclusive. The article reveals the leader with the highest rates of reproduction of housing among the regions based on calculations made by the method. Graphical visualization of the results presented in the evaluation matrix of efficiency of reproduction. As a result of assessment of the most effective policies property reproduction in the Tyumen region (without autonomous region), the least effective - in the Kurgan region. The efficiency of the housing stock in the reproduction of the Chelyabinsk region is below average, in the Sverdlovsk region is above average. On the basis of indicators developed by evaluating the effectiveness of the reproduction of the housing stock in the article also presents the results of applying the algorithm of automatic ratings of the regions as a result of the reproduction of housing for the duration of the evaluation.
Assessing the effectiveness, housing
Short address: https://sciup.org/147155165
IDR: 147155165 | UDC: 332.83 | DOI: 10.14529/ctcr170116
Сравнительная оценка эффективности воспроизводства жилищного строительства на региональном уровне
Рассмотрена апробация методики оценки эффективности воспроизводства жилищного фонда, основанная на расчете интегрального показателя оценки эффективности воспроизводства жилищного фонда и среднего коэффициента роста, характеризующего динамику воспроизводства, на примере регионов Уральского федерального округа: Тюменской (без автономных округов), Курганской, Челябинской и Свердловской областей. Оценка эффективности воспроизводства жилищного фонда проводилась за период 6 лет с 2010 по 2015 год включительно. На основании произведенных по методике расчетов в статье выявлен лидер с наиболее высокими показателями воспроизводства жилищного фонда среди рассматриваемых регионов и представлена графическая визуализация результатов на матрице оценки эффективности воспроизводства. По результатам оценки наиболее эффективная политика воспроизводства жилья в Тюменской области (без автономных округов), наименее эффективная - в Курганской области. Эффективность воспроизводства жилищного фонда в Челябинской области ниже среднего, в Свердловской области - выше среднего. На основании разработанных показателей оценки эффективности воспроизводства жилищного фонда в статье также представлены результаты применения алгоритма автоматического рейтингования регионов по результатам воспроизводства жилья за весь период проведения оценки.
Text of the brief report Comparative assessment of the housing reproduction efficiency at the regional level
On the example of regions of the Urals Federal district we consider the practical application of modernized computing techniques for assessing the efficiency of housing fund reproduction at the regional level [1]. To this purpose, on the basis of partial indexes for the estimation of housing reproduction efficiency, we have calculated integral efficiency index for the assessment of housing reproduction and the growth rate characterizing the dynamics of reproduction of the housing Fund [2, 3].
Aggregate social, technical, market, and investment indexes are shown in Table 1.
Table 1
Aggregate indexes for the efficiency assessment of housing reproduction at regions (developed by the author)
|
Region |
2010 |
2011 |
2012 |
2013 |
2014 |
2015 |
|
Aggregate social index for the assessment o f housing reproduction efficiency |
||||||
|
Tyumen region (without autonomous region) |
0,383 |
0,320 |
0,646 |
0,633 |
0,659 |
0,631 |
|
Kurgan region |
0,171 |
0,152 |
0,490 |
0,498 |
0,348 |
0,299 |
|
Sverdlovsk region |
0,523 |
0,555 |
0,597 |
0,552 |
0,522 |
0,546 |
|
Chelyabinsk region |
0,456 |
0,606 |
0,694 |
0,615 |
0,610 |
0,538 |
|
Aggregate technical index for the assessment of housing reproduction efficiency |
||||||
|
Tyumen region (without autonomous region) |
0,623 |
0,622 |
0,731 |
0,703 |
0,624 |
0,694 |
|
Kurgan region |
0,149 |
0,130 |
0,122 |
0,211 |
0,274 |
0,294 |
|
Sverdlovsk region |
0,730 |
0,683 |
0,700 |
0,724 |
0,722 |
0,717 |
|
Chelyabinsk region |
0,883 |
0,831 |
0,775 |
0,763 |
0,675 |
0,706 |
|
Aggregate market index of housing reproduction efficiency |
||||||
|
Tyumen region (without autonomous region) |
0,289 |
0,409 |
0,576 |
0,719 |
0,701 |
0,824 |
|
Kurgan region |
0,051 |
0,206 |
0,388 |
0,399 |
0,455 |
0,516 |
|
Sverdlovsk region |
0,411 |
0,522 |
0,649 |
0,850 |
0,771 |
0,849 |
|
Chelyabinsk region |
0,270 |
0,434 |
0,629 |
0,743 |
0,743 |
0,757 |
Table 1 (end)
|
Region |
2010 |
2011 |
2012 |
2013 |
2014 |
2015 |
|
Aggregate investment the indicator of assessment of efficiency of reproduction of the housing Fund |
||||||
|
Tyumen region (without autonomous region) |
0,644 |
0,495 |
0,623 |
0,655 |
0,703 |
0,780 |
|
Kurgan region |
0,278 |
0,212 |
0,251 |
0,203 |
0,316 |
0,353 |
|
Sverdlovsk region |
0,193 |
0,218 |
0,178 |
0,238 |
0,270 |
0,247 |
|
Chelyabinsk region |
0,338 |
0,332 |
0,210 |
0,153 |
0,213 |
0,363 |
It was further calculated the integrate index for the assessment of housing reproduction efficiency [4–6] Table 2.
Table 2
The integrate index for the assessment of housing reproduction efficiency in regions (developed by the author of the article)
|
The integrate index for the assessment of housing reproduction efficiency |
2010 |
2011 |
2012 |
2013 |
2014 |
2015 |
|
Tyumen region (without autonomous region) |
0,485 |
0,461 |
0,644 |
0,678 |
0,672 |
0,732 |
|
Kurgan region |
0,162 |
0,175 |
0,313 |
0,328 |
0,348 |
0,365 |
|
Sverdlovsk region |
0,464 |
0,495 |
0,531 |
0,591 |
0,571 |
0,590 |
|
Chelyabinsk region |
0,487 |
0,551 |
0,577 |
0,569 |
0,560 |
0,591 |
According to the scale of Harrington, the value of the integral index for the assessment of housing reproduction efficiency in 2015 was high in the Tyumen region, in the Sverdlovsk and Chelyabinsk regions was average, and was the lowest in the Kurgan region.
Further, there have been calculated the average growth rates characterizing the dynamics of housing reproduction for the complex estimation of reproduction efficiency, Table 3.
Table 3
Average growth rates characterizing the dynamics of housing reproduction for the complex estimation of reproduction efficiency at regions
|
Region |
2010 |
2011 |
2012 |
2013 |
2014 |
2015 |
|
Average growth rate of social indexes |
||||||
|
Tyumen region (without autonomous region) |
0,958 |
0,873 |
1,513 |
0,941 |
1,051 |
0,982 |
|
Kurgan region |
1,022 |
1,045 |
1,862 |
1,080 |
0,750 |
0,869 |
|
Sverdlovsk region |
1,048 |
1,030 |
1,046 |
0,896 |
0,914 |
1,069 |
|
Chelyabinsk region |
1,115 |
1,248 |
1,080 |
0,858 |
0,981 |
0,844 |
|
Average growth rate of technical indexes |
||||||
|
Tyumen region (without autonomous region) |
0,947 |
0,997 |
1,261 |
1,006 |
0,798 |
1,103 |
|
Kurgan region |
0,979 |
0,931 |
1,058 |
1,108 |
0,902 |
1,104 |
|
Sverdlovsk region |
0,985 |
0,876 |
1,033 |
1,121 |
1,003 |
1,066 |
|
Chelyabinsk region |
0,975 |
0,943 |
0,896 |
0,819 |
1,328 |
0,989 |
|
Average growth rate of market indexes |
||||||
|
Tyumen region (without autonomous region) |
0,940 |
1,077 |
1,165 |
0,996 |
0,950 |
1,109 |
|
Kurgan region |
0,993 |
1,143 |
1,120 |
0,917 |
1,024 |
1,009 |
|
Sverdlovsk region |
1,038 |
1,135 |
1,108 |
1,146 |
0,948 |
1,049 |
|
Chelyabinsk region |
0,970 |
1,172 |
1,089 |
1,082 |
1,002 |
1,008 |
|
Average growth rate of investment indexes |
||||||
|
Tyumen region (without autonomous region) |
1,211 |
0,713 |
1,366 |
1,115 |
1,073 |
1,209 |
|
Kurgan region |
1,379 |
0,870 |
1,020 |
0,892 |
1,326 |
1,174 |
|
Sverdlovsk region |
1,099 |
0,881 |
1,147 |
1,177 |
1,117 |
0,987 |
|
Chelyabinsk region |
1,134 |
0,761 |
0,852 |
0,990 |
1,274 |
1,074 |
|
Average growth rates characterizing the dynamics of housing reproduction |
||||||
|
Tyumen region (without autonomous region) 1,008 |
0,904 |
1,320 |
1,013 |
0,961 |
1,098 |
|
Table 3 (end)
|
Region |
2008 |
2009 |
2010 |
2011 |
2012 |
2013 |
|
Kurgan region |
1,082 |
0,992 |
1,225 |
0,995 |
0,979 |
1,032 |
|
Sverdlovsk region |
1,042 |
0,974 |
1,083 |
1,079 |
0,993 |
1,042 |
|
Chelyabinsk region |
1,046 |
1,012 |
0,974 |
0,932 |
1,136 |
0,975 |
Thus, the assessment of housing reproduction efficiency depends on two variables: the integral index of assessment the reproduction efficiency and growth rate characterizing the dynamics of reproduction, a graphical interpretation of the assessment results is shown in Fig. 1.
Growth rate characterizing the dynamics of housing reproduction.
Integral index of assessment the reproduction efficiency.
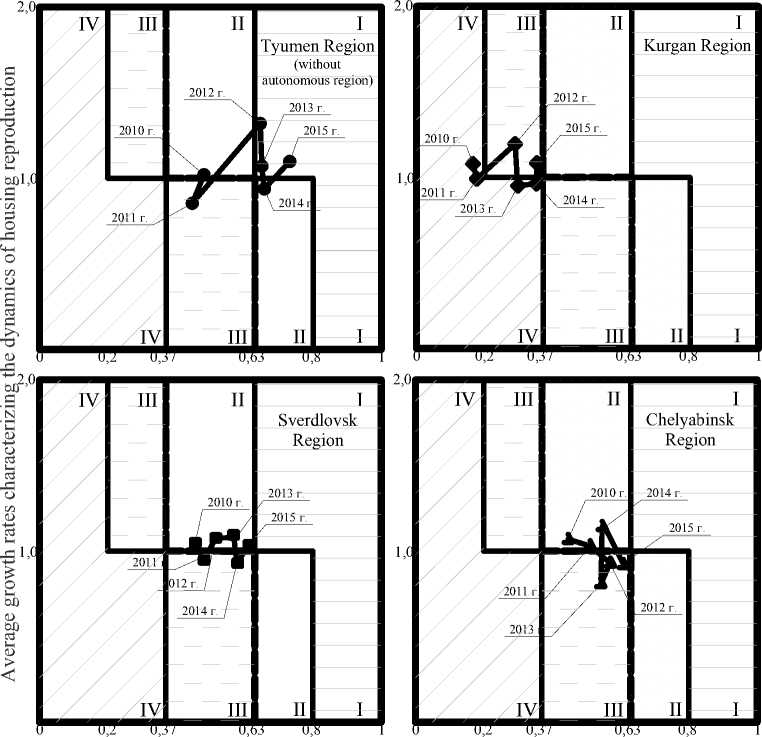
The integrate index for the assessment of housing reproduction efficiency
Fig. 1. Assessment matrixes of housing reproduction efficiency in regions of the Ural Federal District ( developed by the author)
The results of the assessment show that these were low in all regions in 2011 compared with other periods of evaluation. The overall decline in the housing reproduction was due to the global financial crisis of 2010. As a result of the crisis there was the significant decline in financing of housing construction, the rise in price of mortgage loans, the stagnation in the property market, reduction of regional and municipal budgets, closedown of unfinished construction
The placing of the development curve of reproduction in sector I indicates a high effectiveness of the estimation. Among the regions considered, Tyumen region takes the closest position. Thus, among the regions of Ural Federal district the assessment of the housing reproduction efficiency is high in the Tyumen region.
The curve of the Tyumen region (without Autonomous regions) is located in three sectors, besides according to the Fig. 1, the tendency to increase the housing reproduction efficiency is marked. Most of the points in the curve of the efficiency estimation is followed in sector I, respectively, the efficiency of housing reproduction in the Tyumen region (without Autonomous regions) can be estimated as high.
The estimation results of housing reproduction efficiency in Kurgan region are mainly found in the fourth sector, i.e., evaluation of housing reproduction efficiency in Kurgan region is low.
The curve of the Sverdlovsk region is located in two sectors, most of it is located in sector II, respectively, the reproductive efficiency of the housing fund can be assessed as above average.
The curve of the housing reproduction development in the Chelyabinsk region is marked in II and III sectors, moreover, the points were equispaced across sectors, i.e. the results of the estimation of housing reproduction in 2010, 2011 are located in sector II, for 2012, 2013, 2014 are in sector III. In this case, it is essential to take the evaluation of housing reproduction efficiency over the last analyzed period. In 2015 efficiency indexes were reduced and took position in the sector III. Based on the assessment of the last analyzed period, the housing reproduction efficiency in the Chelyabinsk region is below average.
Thus, according to estimation results the most effective policy of housing reproduction is in the Tyumen region, the least – in the Kurgan region. Analysis of the reasons for the leading of Tyumen region will allow the regions of the Ural Federal district to take strategic actions to improve the efficiency of housing reproduction.
We have made a rating of the housing reproduction efficiency in the regions of the Ural Federal district on the basis of the received data and this is automated in Microsoft Excel, Table 4.
Table 4
Rating of housing reproduction efficiency in the regions of Ural Federal District
|
Region |
Tyumen region (without autonomous region) |
Sverdlovsk region |
Chelyabinsk region |
Kurgan region |
|
|
Integral index |
2010 |
0,485 |
0,472 |
0,482 |
0,165 |
|
2011 |
0,461 |
0,502 |
0,547 |
0,176 |
|
|
2012 |
0,644 |
0,535 |
0,569 |
0,306 |
|
|
2013 |
0,678 |
0,595 |
0,558 |
0,326 |
|
|
2014 |
0,672 |
0,580 |
0,554 |
0,345 |
|
|
2015 |
0,732 |
0,601 |
0,598 |
0,365 |
|
|
Growth rate |
2010 |
1,008 |
1,042 |
1,046 |
1,082 |
|
2011 |
0,904 |
0,974 |
1,012 |
0,992 |
|
|
2012 |
1,320 |
1,083 |
0,974 |
1,225 |
|
|
2013 |
1,013 |
1,079 |
0,932 |
0,995 |
|
|
2014 |
0,961 |
0,993 |
1,136 |
0,979 |
|
|
2015 |
1,098 |
1,042 |
0,975 |
1,032 |
|
|
Grades |
2010 |
5 |
5 |
5 |
9 |
|
2011 |
6 |
6 |
5 |
10 |
|
|
2012 |
3 |
5 |
6 |
7 |
|
|
2013 |
3 |
5 |
6 |
8 |
|
|
2014 |
4 |
6 |
5 |
8 |
|
|
2015 |
3 |
5 |
6 |
7 |
|
|
Total grades |
24 |
32 |
33 |
49 |
|
|
Rating |
1 |
2 |
3 |
4 |
|
The Tyumen region may be a subject to comparative benchmarking analysis, as it is the leader among comparable regions. After analyzing the problems and reasons of the backlog, it is possible to develop more effective recommendations for the development of housing reproduction, which can be the basis for the development of housing reproduction in other regions of the Ural Federal district.
Thus, on the basis of the author's technique developed a tool for assessing the efficiency of reproduction of the housing Fund, as ratings. Building rating is a simplified system of monitoring and evaluation of the results of reproduction of the housing Fund on the basis of integral indicator of assessment of efficiency of reproduction of the housing stock and average growth coefficient characterizing the dynamics of replacement housing. According to proposed on the basis of the scale of Harrington, the evaluation criteria, each range of values of the integral indicator and the growth rate corresponds to a score, the sum of which for all analysed periods will determine the position in the ranking. The ranking of the proposed algorithm, the use of which allows you to convert the results of assessment of efficiency of reproduction of the housing stock in the ranking is understandable and accessible to the public.
Upgraded tools for assessing the effectiveness of reproduction of the housing stock can be embedded in the activities of Executive bodies at Federal, regional and municipal levels of government interested in improving the results of reproduction of the housing stock and improving the housing conditions of the population and also with the purpose of ranking and carrying out in relation to the lower organs evaluations of the effectiveness of management reproduction housing.
References Comparative assessment of the housing reproduction efficiency at the regional level
- Постановление Правительства Тюменской области от 22.12.2014 г. № 682-п «Об утверждении государственной программы Тюменской области „Развитие жилищного строительства" до 2020 года». -СПС КонсультантПлюс.
- Чикишева, Н.М. Модернизация инструментов оценки эффективности воспроизводства жилищного фонда: моногр./Н.М. Чикишева, А.П. Шестакова. -Тюмень: РИО ФГБОУ ВПО ТюмГАСУ, 2015. -198 с.
- Единая межведомственная информационно-статистическая система. -http://www.fedstat.ru/indicators/start.do.
- Котова, О.В. Оценка воспроизводственных процессов в региональном жилищном комплексе: дис. … канд. экон. наук/О.В. Котова. -Томск, 2009. -211 с.
- Федеральная служба государственной статистики. -http://www.gks.ru.
- Гельруд, Я.Д. Управление проектами: методы, модели, системы: моногр./Я.Д. Гельруд, О.В. Логиновский; под ред. д-ра техн. наук, проф. А.Л. Шестакова. -Челябинск: Издат. центр ЮУрГУ, 2015. -330 с.
