Comparative study of measured heart cycle phase durations: standard lead ECG versus original ascending aorta lead ECG

Author: Kolmakov Sergey
Journal: Cardiometry @cardiometry
Section: R&D engineering in cardiometry
Article in issue: 1, 2012.
Free access
Aims The present paper aims at evaluating the existing difference in duration measurements of the same heart cycle phases in the standard V3, V4, V5, V6 leads ECG versus original HDA lead ECG of the ascending aorta. Materials and The method of changing the filter pass band is used. Its essence is in methods artificial changing of the conditions of the signal recording carrying the informative indications of the initial information used in hemodynamic equations. The method also enables calculating the percentage deviation from the initial values. The principle of balance of the blood volume entering the heart and the blood volume leaving the heart is used to trace the minimal deviations and their respective recording conditions. Results In each of the V3, V4, V5, V6 ECG leads durations of the same phases have different values. The values measured on the ECG of the ascending aorta and those measured using the standard V4 ECG lead differ slightly. Conclusion For heart cycle phase analysis it is possible to use only the ECG of the ascending aorta and V4 standard lead ECG. Using conventional standard ECG leads causes an error up to 25%.
Cardiometry, cardiology, hemodynamics, metrology, ecg
Short address: https://sciup.org/148308720
IDR: 148308720
Text of the scientific article Comparative study of measured heart cycle phase durations: standard lead ECG versus original ascending aorta lead ECG
Aims The present paper aims at evaluating the existing difference in duration measurements of the same heart cycle phases in the standard V3, V4, V5, V6 leads ECG versus original HDA lead ECG of the ascending aorta. Materials and methods The method of changing the filter pass band is used. Its essence is in artificial changing of the conditions of the signal recording carrying the informative indications of the initial information used in hemodynamic equations. The method also enables calculating the percentage deviation from the initial values. The principle of balance of the blood volume entering the heart and the blood volume leaving the heart is used to trace the minimal deviations and their respective recording conditions. Results In each of the V3, V4, V5, V6 ECG leads durations of the same phases have different values. The values measured on the ECG of the ascending aorta and those measured using the standard V4 ECG lead differ slightly. Conclusion For heart cycle phase analysis it is possible to use only the ECG of the ascending aorta and V4 standard lead ECG. Using conventional standard ECG leads causes an error up to 25%. Keywords Cardiometry ≈ Cardiology ≈ Hemodynamics ≈ Metrology ≈ ECG Imprint Sergey V. Kolmakov. Comparative study of measured heart cycle phase durations: standard lead ECG versus original ascending aorta lead ECG; Cardiometry; No.1; November 2012; p.143-150; doi:10.12710/cardiometry.2012.1.142149 Available from:
Measurements in any scientific field are governed in accordance with the legal acts in every country [1, 2]. The measurement procedure is primarily based on comparison of the results with a definite reference value. There are no reference values in cardiology to compare the results with. The possible way out is the method of controlled filtration of the cardiac signal. However, here we have to speak about the higher reliability of measurements and not about the error. In this case detecting a more reliable cardiac signal is a great step forward. In case it contributes to improving the diagnostic accuracy, the method of controlled filtration of the cardiac signal can be used further for providing the biomedical research with the necessary metrology.
Before considering the results of the data processing (s. Table 2) it is necessary to consider the validity of the proposed method and the error estimation of the measurement results.
Materials and methods
The essence of the method is in artificial change of the conditions of the signal recording carrying the informative indications of the initial information used in hemodynamic equations. The method also enables calculating the percentage deviation from the initial values. The principle of balance of the blood volume entering the heart and the blood volume ejected from the heart is used to trace the minimal deviations and their respective recording conditions.
In this case we simultaneously analyze both the elaborated HDA method and widely-used V3, V4, V5, V6 standard leads. In every ECG signal under study several informative criteria are recorded. They are used to calculate seven parameters of hemodynamics. Thus, it is possible to estimate the percentage deviation from the initial values of all the measured data. Calculation of the dynamic error, absolute error, arithmetic mean error, etc. is not possible due to data insufficiency.
The proposed method uses the principle of balance of the blood volume entering the heart and that leaving the heart during one cardiac cycle. It enables detecting all sources of signal distortion, signal sorting and their recording conditions that is not possible in case of the phase analysis. The total values of the hemodynamic parameters entering the heart and leaving the heart must be equal. The philosophy of the proposed method is in Fig.1.
Theoretical model
I
Mathematical equations, used in the elaborated
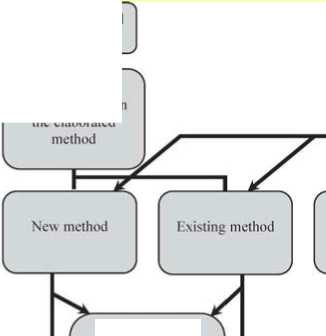
Condition modulator tor reliability cheek
Comparative analysis of reliability of measurement parameter recording when applying automatic decoding


Estimation of measurement pel tab i I ily, Selection of values with minimum variance, and determination of the required modulating conditions
Figure 1. Philosophy of the analysis method of reliability of the recorded data and detection of possible error sources.
At the first stage of analysis, it is necessary to calculate the error percentage of static deviation from HDA values assigned as true ones. The values are recorded with filter pass band (s. Table 1, A). Let us take them as zero value. Then the percentage deviation of the measured values in Table 1 will correspond to the values presented in Table 2.
Table 1. Data of measured values in HDA leads versus the V3,V4,V5,V6 leads (at the same filter pass bands of the standard lead ECG and HDA lead ECG)
|
QRS |
RS |
QT |
PQ |
TT |
SV (ml) |
MV (l) |
PV1 (ml) |
PV2 (ml) |
PV3 (ml) |
PV4 (ml) |
PV5 (ml) |
|
|
HDA |
0,093 |
0,047 |
0,363 |
0,084 |
1,013 |
72,4 |
4,3 |
50,7 |
21,7 |
42,9 |
29,4 |
10,7 |
|
V3 |
0,089 |
0,052 |
0,361 |
0,078 |
0,982 |
86,6 |
5,3 |
61,9 |
24,7 |
51,4 |
35,2 |
12,2 |
|
V4 |
0,088 |
0,043 |
0,355 |
0,088 |
0,984 |
62,9 |
3,8 |
43,4 |
19,6 |
37,3 |
25,6 |
9,6 |
|
V5 |
0,087 |
0,043 |
0,352 |
0,086 |
0,958 |
62,7 |
3,9 |
43,0 |
19,8 |
37,2 |
25,5 |
9,5 |
|
V6 |
0,090 |
0,046 |
0,341 |
0,096 |
0,961 |
69,3 |
4,3 |
46,6 |
22,6 |
41,1 |
28,2 |
9,9 |
Tables 2. Percentage deviation of the measured values in leads V3, V4, V5, V6 from the values in HDA lead
-
А) at the same filter pass bands of the standard lead ECG and HDA lead ECG.
QRS
RS
QT
PQ
TT
SV (ml)
MV (l)
PV1 (ml)
PV2 (ml)
PV3 (ml)
PV4 (ml)
PV5 (ml)
HDA
0,0
0,0
0,0
0,0
0,0
0,0
0,0
0,0
0,0
0,0
0,0
0,0
V3
-4,30
10,63
-0,55
-7,14
-3,06
19,61
23,25
22,09
13,82
19,81
19,72
14,0
V4
-5,37
-8,51
-2,20
4,76
-2,86
-13,12
-11,62
-14,39
-9,67
-13,05
-12,92
-10,28
V5
-6,45
-8,51
-3,03
2,38
-5,4
-13,39
-9,30
-15,18
-8,75
-13,28
-13,26
-11,21
V6
-3,22
-2,12
-6,06
14,28
-5,13
-4,28
0,0
-8,08
4,14
-4,19
-4,08
-7,47
-
B) with a low cutoff frequency equal to F lower = 0.7 Hz.
QRS
RS
QT
PQ
TT
SV (ml)
MV (l)
PV1 (ml)
PV2 (ml)
PV3 (ml)
PV4 (ml)
PV5 (ml)
HDA
7,52
2,1
1,10
-3,57
-9,18
3,03
13,95
-2,95
17,05
3,26
3,06
0,95
V3
22,58
12,76
5,50
-27,38
-19,64
21,27
51,16
6,90
54,83
21,44
21,42
14,01
V4
7,52
-8,51
0,55
-7,14
-4,93
-9,11
-4,65
-11,43
-3,68
-8,85
-8,84
-7,47
V5
-4,30
-2,12
-5,50
10,71
-12,33
-6,07
6,97
-13,41
11,05
-6,06
-5,78
-7,47
V6
-3,22
0,0
-7,43
11,90
-19,94
-2,20
20,93
-15,97
29,49
0,0
-2,04
-6,54
-
C) with a top cutoff frequency equal to F upper = 11 Hz.
QRS
RS
QT
PQ
TT
SV (ml)
MV (l)
PV1 (ml)
PV2 (ml)
PV3 (ml)
PV4 (ml)
PV5 (ml)
HDA
32,25
48,93
4,13
-16,66
-4,24
84,94
93,02
83,82
87,55
85,31
85,03
47,66
V3
26,88
53,19
5,23
-29,76
-3,35
97,79
104,65
106,11
78,00
98,35
97,61
57,94
V4
37,63
53,19
4,40
-25,00
-1,48
94,75
97,67
98,81
85,25
95,13
94,55
51,4
V5
37,63
53,19
4,40
-25,00
-1,48
94,75
97,67
98,81
85,25
95,13
94,55
51,4
V6
36,55
53,19
-1,37
-10,71
-14,80
88,25
120,93
73,57
123,04
88,81
88,09
39,25
D) with the pass band equal to F lower = 0.7 Hz, F upper = 11 Hz.
|
QRS |
RS |
QT |
PQ |
TT |
SV (ml) |
MV (l) |
PV1 (ml) |
PV2 (ml) |
PV3 (ml) |
PV4 (ml) |
PV5 (ml) |
|
|
HDA |
48,38 |
46,80 |
10,46 |
-29,76 |
-4,83 |
86,4 |
95,34 |
82,05 |
95,39 |
86,48 |
86,05 |
51,4 |
|
V3 |
39,78 |
53,19 |
8,53 |
10,71 |
-9,97 |
96,4 |
118,60 |
71,4 |
154,83 |
96,96 |
96,25 |
57,0 |
|
V4 |
39,78 |
53,19 |
2,75 |
-19,04 |
-16,78 |
93,64 |
132,55 |
75,34 |
135,94 |
94,17 |
93,53 |
47,66 |
|
V5 |
36,55 |
53,19 |
0,3 |
-13,09 |
12,73 |
90,74 |
118,6 |
78,69 |
118,89 |
91,14 |
90,47 |
42,99 |
|
V6 |
39,78 |
57,44 |
1,65 |
-4,76 |
-17,76 |
93,5 |
134,88 |
69,82 |
148,84 |
94,17 |
93,19 |
40,18 |
Deviation percentage is calculated in compliance with the formula (1):
Х = (----- intai! . 100% (1)
initial where:
Ninitial is the value which corresponds to А) conditions for HDA;
N is the measured value.
We should note that when the filter pass band is changed, in all examined ECG leads we observe both positive and negative deviations from the true values. In case the pass band is relatively narrow, the obtained data presented in Table 2 (part D) differ by more than 100%. In HDA leads, the difference is more than 80%. Thus, we can come to a conclusion that the filter parameters (s. Table 2, part D) contribute to signal distortion and can not be applied in practice. It is caused by the smoothing effect which was detected when comparing the ECG curves of various leads [3]. Depending on the signal amplitude and the data concerning the phase transition, the process of integration or differentiation of the signal harmonics takes place at the time when the signal passes through the filter. The process is influenced by the frequency and amplitude of harmonics and depends on the filter parameters.
But it is not enough to determine conditional static error only. It can be seen from Table 1 that not all parameters show the similar changes considered their initial value. So, in the V6 lead (Table 2, D) the РV2 parameter demonstrates a deviation of 148% while the PV5 parameter demonstrates a deviation of 40.18%. For this reason, we should not use only one parameter to evaluate the reliability of the estimated values.
In addition, it is reasonable to use heart hemodynamic balance equation for data evaluation:
PV1+PV2=PV3+PV4 (2)
This is a physical constant which can not be violated in the mechanics of hemodynamic processes. It is reasonable to insert into the formula the percentage deviation provided in Table 2 instead of the measured values provided in Table 1. The results are shown in Table 3.
Considering the equation, it is possible to detect the leads where the physical constant of balance (equation 2) is violated least of all (regardless of the true values deviation error).
Table 3. Dynamic balance equation (PV1 + PV2 = PV3 + PV4) for the calculated percentage provided in Table 2.
-
А) at the same filter pass bands of the standard lead ECG and HDA lead ECG.
HDA
0.0
V3
3.62
V4
-1.91
V5
2.61
V6
-4.33
-
B) with a low cutoff frequency equal to F lower = 0.7 Hz.
HDA
7.78
V3
-18.87
V4
-2.58
V5
-14.2
V6
11.48
-
C) with a top cutoff frequency equal to F upper = 11 Hz.
HDA
-1.03
V3
11.85
V4
5.82
V5
5.82
V6
-19.71
-
D) with the pass band equal to F lower = 0.7 Hz, F upper = 11 Hz.
HDA
4.91
V3
-33.02
V4
-23.58
V5
-15.97
V6
-31.3
-
So, for conditions in A) (s. Table 3, A), lead V4 has the least percentage deviation V4= -1.91%; for conditions in B) (s. Table 3, B) the lead V4 deviation is V4= - 2.58%; for C) and D) conditions (s. Table 3, C, D) the HDA lead deviation is HDA= - 1.03% and HDA= - 4.91%.
Based on Table 2, we can determine that the following leads have the minimum static deviation:
-
1. HDA and V6;
-
2. V4 and V6;
-
3. HDA, V4 and V6;
-
4. HDA.
However, under А) conditions the V6 lead has the least static deviation for all parameters, one of the parameters reaches 0.0%. But in this case, the principle of physiological balance is violated to a greater degree, i.e., minus 4.33% (s.Table 3).
The so-called reliability coefficient may be introduced to the reliability estimation analysis:
К = К 1 ∙К 2 (3)
where
-
K 1 is the quantity of the measured parameters;
K 2
N 1
1 + N 2 ;
N 1 is the number of normal measurements;
N 2 is the number of failures.
This reliability coefficient indicates how efficiently the criteria of the recording of the phase transition identification can be traced on the ECG curve in the automatic mode. It is very important for adequate consideration of the individual characteristics of a patient. But more profound investigation is required to identify the importance of every phase in every lead under various conditions that influence the measurement results in general.
Results
In every of the V3, V4, V5, V6 ECG leads durations of the same phases have different values. The values measured according to the ECG of the ascending aorta and those measured using the standard V4 lead ECG differ slightly.
Discussion and conclusions
-
1. Filter pass band is of paramount importance for providing reliability of the ECG signal form recording.
-
2. Not every standard lead carries reliable information about all phases of the cardiac cycle.
-
3. The elaborated method of HDA lead ECG recording provides the most reliable data about cardiac cycle phase transitions.
-
4. Lead V6 recording the ECG signal of the apex of heart is the closest to HDA standard lead, but the V6 lead signal reliability is lower.
-
5. Study of reliability and diagnostic information value of HDA method with respect to the standard methods is to be continued in clinical practice.
Statement on ethical issues
Research involving people and/or animals is in full compliance with current national and international ethical standards.
Conflict of interest
None declared.
References Comparative study of measured heart cycle phase durations: standard lead ECG versus original ascending aorta lead ECG
- Prischepa M.I. Features of the National Assurance of the Measurement Units in Cardilogical Diagnostics Laboratory [electronic resource]. Laboratory medicine. 2003. No.6. http://www.ramld.ru/articles/article.php?id=37 Screen title.
- Popetchitelev Ye.P., Korenevsky N.A. Electrophysiological & Photometric Medical Equipment. M., "VysshayaShkola", 2002, P.75-76.
- Rudenko M., Voronova O. & Zernov V. Theoretical Principles of Heart Cycle Phase Analysis. Fouqué Literaturverlag. ISBN 978-3-937909-57-8, Frankfurt a/M. München -London -New York; 2009.
