Comparative Study on Temple Structural Element Segmentation using Different Segmentation Techniques

Author: Narendra Kumar S., Shrinivasa Naika C.L., Gurudev S. Hiremath
Journal: International Journal of Engineering and Manufacturing @ijem
Article in issue: 2 vol.13, 2023.
Free access
India's Karnataka state is home to a vast treasure trove of artefacts, antiquities, and historic and archaeologically significant monuments. Its culture and tradition are linked. In Karnataka, there are numerous Neolithic and Megalithic structures; these historic buildings from illustrious ruling dynasties have endured for thousands of years. They have miracles of their own in their own style, innate sculpture, architecture, technique, immensity, and enormity. However, modern generation is not ready for mining archaeological knowledge regarding empires or ruling dynasties of these ancient Karnataka temples through the archaeological guidance. Hence, a new approach required to bring this valuable information to the modern generation by a proper platform. In this paper both threshold and regional based segmentation methods are applied in order to segment the structural elements of temple. The analysis of segmented structural elements by applying both methods is done in order to provide comparative study. Comparative study on temple structural element shows that regional segmentation is more accurate than threshold method based on VOE and DSC metrics which are used for evaluating the performance of segmentation methods. Further, more efficient segmentation approaches may be applied to improve the efficiency of segmentation and it may be used for classification of viman styles.
Temple, structural element, thresholding, segmentation
Short address: https://sciup.org/15018690
IDR: 15018690 | DOI: 10.5815/ijem.2023.02.04
Text of the scientific article Comparative Study on Temple Structural Element Segmentation using Different Segmentation Techniques
India's Karnataka state is home to numerous historic and archaeologically significant ancient sites. Its culture and tradition are intertwined. Even thousands of years later, there are still several historical monuments that were erected by empires or governing dynasties. Their distinctive method of structuring is defined by their style, inherent sculpting, architecture, technology, immensity, and size.
The notable reigning dynasties of Karnataka included the Kadambas, Gangas, Chalukyas of Badami and Kalayana, Rashstrakutas, Hoysalas, and sultanate dynasties such as the Bahmanies, Adil Shahis, Barid Shahis, rulers of Vijayanagara, and Mysore Wodeyars, among others. However, when they were being built, these temples, like Dravida, Nagara, and Vesara, adhered to a distinctive style. In today's world, it is frequently necessary for both the general public and archaeology research academics to mine archaeological knowledge through digitization. One such example is the study of an old Karnataka temple. Therefore, a fresh technique was needed to provide this important knowledge on a suitable platform to modern society. This research work will help as a digitized tool for upcoming archeologists (research scholars) in the field of archeology for the purpose of temple field survey very efficiently, by considering various parameters like cost, time and accuracy. This work will also guides/helps archeologists in the processes of temple restoration by knowing the architecture which was adopted earlier.
One of the most crucial methods in image processing is segmentation of the image. It is a pre-processing stage in the fields of pattern recognition, computer vision, and image analysis [1]. Image segmentation is a technique for breaking up a digital image into different parts (sets of pixels). To identify objects and boundaries (lines, curves, etc.) in images, image segmentation is frequently employed. When an image is segmented, it either generates a set of segments that contain the complete image or a set of extracted image outlines (edge detection). Regarding some qualities or computed features, such as colour, intensity, or texture, all of the pixels in a region are connected. [2]. In terms of the same features, adjacent areas are significantly different from one another. Digital libraries, image processing, medical imaging, computer vision, face recognition, picture and video retrieval, and other sectors are just a few of the industries that use image segmentation [3].
A fundamental image processing technique called image segmentation aims to divide an image into uniform chunks. One of the two main properties of intensity, discontinuity, or similarity forms the basis for segmentation algorithms. Segmenting a picture based on subtle intensity variations, such as image edges, falls under the first category. The second component centres around segmenting an image according to a similar set of guidelines. The threshold approach is a member of this group [4].
The many various kinds of image segmentation algorithms include thresholding, artificial neural networks, regionbased, edge-based, clustering-based, and feature-based segmentation, to name just a few. Grouping the photographs together is an effective method for segmenting photos. Thresholding, artificial neural networks, region-based, edge-based, clustering-based, and feature-based segmentation are just a few of the many different types of photo segmentation methods. The photos can be segmented effectively by grouping them together [5].
This paper's major focus was on the comparison of thresholding, K-means, and Graph-Cut segmentation techniques for the purpose of segmenting and analysing the structural aspects of historic temples. The thresholding method is thoroughly explained in Section II. K-means clustering is explained in section III. Details on the Graph-Cut segmentation Method are provided in Section IV. The findings, segmentation statistical measures, and comparison analysis are illustrated in Section V.
2. Thresholding Method
The image is binarized based on pixel intensities using image thresholding. A grayscale image and a threshold are typically the inputs to such a thresholding technique. Binary image is what is produced. If an input pixel's intensity exceeds a threshold, the associated output pixel is designated as white (foreground), and if it is equal to or less than the threshold, the output pixel position is marked black (background).
Key technique for analysing images and finding patterns is image thresholding. The thresholds can be selected automatically using a variety of techniques. One of the most used techniques for segmenting images is thresholding[9]. The segmentation results are composed of a number of continuous zones and straightforward operating features. Selecting a threshold value T that creates a "boundary" between the range of grey levels linked to objects and the range connected to background is important for threshold-based image segmentation. After thresholding, the grey level image is transformed to binary. It is possible to assign pixels to more than two classes using algorithms that use multiple threshold values. Both manually and automatically entering threshold values is possible [10].The thresholding process is described below:
A. Procedure
The threshold segmentation procedure is as follows: Set a threshold T for each pixel to divide the image into the target and background zones. Assign that point as the target point (value is 1) if the grey value is larger than T; else, set that point as the background point (the value is 0). Programmers can also divide an image into the target region and the background region by specifying the target pixel as 255 and the background pixel as 0, or vice versa. The following example of the formula is provided by [9].
f ( x , y ) = 1 if f ( x , y ) > T
f ( x , y ) = 0 if f ( x , y ) < T
3. K-Means Method
Large-scale segmentation (image) is currently accomplished using the clustering technique. Clustering is an unsupervised learning technique that splits a set of fundamentals into predictable categories. Clustering can take many different forms, including hierarchical clustering, fuzzy C-means, and K-means. One of the most popular clustering methods for a variety of applications is the K-means approach [6].
A technique for partition-based cluster analysis is K-means clustering. An unsupervised learning algorithm called K-Means Clustering is used to segment an image based on clusters.
The two major functions of the k-means clustering algorithm are:
-
• Iteratively determines the best value for K centre points or centroids.
-
• Each data point is matched with the nearest k-center. A cluster is formed by the data points that are close to a specific k-center.
The K-means clustering algorithm is generally used to address straightforward image segmentation problems. Because it protects the clustering process from errors, the initial cluster centres chosen are very important. The initial cluster centres are selected at random from the incoming data by the most popular launch method[5]. The following procedure describes the procedures required in K-means clustering:
A dependable clustering method is K-means. It divides related data into categories based on the cluster's initial centroids.The initial cluster centres of this technique are chosen from k data points. Then, by calculating the distance between the centres of each cluster and each individual data point, each data point is assigned to the cluster that is closest to it. The programme then updates the averages for each cluster and repeats the process until the condition is not met. The K-means algorithm is used to partition the data into k clusters, and each data value is then allocated to the cluster with the closest mean[7]. In Fig. 1, the fundamental k-means method is displayed.
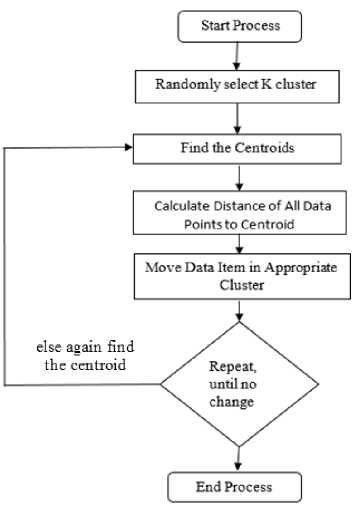
Fig. 1. K-Means Algorithm Process
The centre of each cluster is represented by the mean value of its items according to the K-Means algorithm[8].
Input: The cluster count is K. D: a set of n objects that are grouped together.
Output: k clusters are present.
Method:
1. Choose k random items from the set D to serve as the first cluster centres.
2. Repeat
3. Each object should be (re)assigned to the cluster to which it is most closely related using the algorithm given below and the cluster's mean value.
4. For each cluster, determine the object's mean value to update the cluster means.
5. till there is no change..
4. Graph Cut Method
kn
J XX v - j j = 1 - = 1
Where ||Xj-C ||2 is a measure of the cluster center's separation from the cluster's n data points and is the computed intra-cluster distance between data point X i and the cluster centre C . The compactness of the clusters is measured using the word intra. The minimal space between cluster centroids is known as the inter term.
One of the main issues with K-means is that the user has to input the number of clusters as part of the algorithm. For the algorithm to work as intended, the user must select the ideal number of clusters [8].
The backdrop and the object are the two fundamental components of image segmentation, and this can be used as a binary labelling issue. In order to tackle the difficulty of the two labels, Boykov et al. [14] explored segmenting a monochrome image using the graph cut method. By considering a set of labels L and a set of sites S, the labelling problem can be divided into a label fqЄL and each site pЄS. The label set L= {0, 1} has the values 0 for background and 1 for object. For a labelling problem, the energy minimization Markov Random Field (MRF) equation [10] can be written as follows:
E ( f ) = ∑ D p f p + λ ∑ W pq T ( f p ≠ f q ) p ∈ S ( p , q ) ∈ N
The first part in the energy minimization equation, referred to as the data term, describes how the labels are assigned and includes limitations from the observed data. Label fq is measured by Dp and fits with location p. The second term, known as the smoothness term, quantifies how piecewise irregular f is. N stands for a neighbourhood system with four or eight connected systems. T(fp ≠fq) will be 0 if fp=fq is true and 1 in other case. The border in picture segmentation is typically placed on the edges. As a result, W pq 's normal selection is:
W = e ( I p - I q )2 1
pq 2 δ 2 dist ( p , q )
-
δ2 displays the distance between Sites p and q, while Ip and Iq, respectively, reflect Sites p and q's respective colour values. The parameter δ expresses how different close places are from one another. The parameter λ [14] indicates how relevant the data term is in relation to the smoothness term.
The graph cuts technique for segmenting pictures has garnered a lot of interest. The "graph cuts approach," a technique for minimising the energy function, can be readily characterised as a Markov random field. Graphs illustrating the maximum flow problem can be used to summarise issues with energy (and thus, by the max-flow min-cut theorem, define a minimal cut of the graph). In most formulations of these computer vision issues, the minimal energy solution, which offers the highest a posteriori estimate of a solution, is mentioned. The phrase "graph cuts" is often used to describe models that apply the max-flow/min-cut optimization, even though cutting a graph is a regular aspect of computer vision approaches (such as normalised cuts) (other graph cutting algorithms may be considered as graph partitioning algorithms). This approach can precisely solve "binary" difficulties (such de-noising a binary image), but it is unable to precisely solve "multi-label" issues (such as stereo correspondence or de-noising a grayscale image). However, the solutions it generates frequently come quite close to the global optimum. They showed how the min cut max flow technique and the addition of a source and sink to an associated image network may be used to precisely find the maximum a posteriori estimate of a binary picture in the context of Bayesian statistical smoothing of noisy (or corrupted) images. Fig. 2[8] illustrates it.
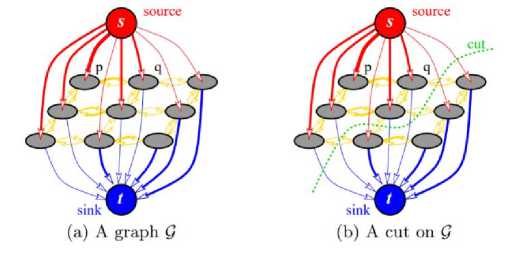
Fig. 2. Image segmentation with a graph cut (source and sink).
Notations:
■
■
Image: x C {R,G,B} N
Output: The segmentation of the S C {R }N (soft segmentation). Set S must belong to "0 for the background and 1 for the foreground" in order to identify an object for hard segmentation.
■
■
Energy function: E C (x,S,C,X) where the coherence parameter and the colour parameter C respectively.
E C (x,S,CA)= E
1 +E color
coherence
Optimization: The segmentation can be computed as a global minimum using S:argminS E (x, S, C,) [7]. In comparison to threshold and K-means, this technique has the following more sophisticated features:
• The algorithm is straightforward and simple to use.
• Decreases the likelihood of overspilt by introducing the size of clusters.
• May result in more precise categorization.
• It tends to build balanced clusters and can prevent clusters with only a few vertices by taking both intra
5. Comparative Analysis
cluster connections and inter-cluster connections into account.
-
A. Results
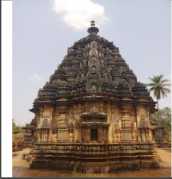
This subsection describes about results obtained by applying above mentioned segmentation methods on vimana and pillar ancient temple structural elements. We have prepared our own dataset by visiting numerous temples around the India and from web portal like Archaeology Survey of India (ASI) which has been published in Kaggle and institute web portal [16,17,18,19].Table 1 shows the captured images of vimana and pillar, Table 2 shows the ground truth images of captured images, Table 3 and Table 4 shows the results obtained by applying above discussed methods for vimana and pillar structural element.
-
B. Metrics used for Evaluating the Performance
The outcomes of the segmentation process are typically validated using the ground truths offered by various challenges. Different criteria are used to assess segmentation accuracy. According to numerous research papers [15] and challenges, the statistical measures that are most frequently used are the volumetric overlap error, dice similarity coefficient, relative volume difference, average symmetric surface distance, root mean square symmetric surface distance, and maximum symmetric surface distance.
Using A as the segmented region and B as the ground truth, the various metrics are calculated in accordance with their definitions.
The difference between the total number of pixels in the segmented region, the ground truth, and the total number of pixels in their union is the volumetric overlap error (VOE). Values close to 0 are necessary for effective segmentation, and as the score rises, any discrepancies in the segmented image become obvious. The following formula can be used to determine VOE:
VOE = ((| A^B |/| A U B |) - 1) x 100
To assess how well the pixels in the region of interest were segmented, the Dice Similarity Coefficient is used (DSC). Scores close to 0 indicate that the segmented image is inconsistent, while scores close to 1 suggest that the segmentation was effective. the formula below to determine DSC:
DSC = 2| A d B |/(| A | + 1 B |)
Table 1. Captured Images
Vimana
Pillar
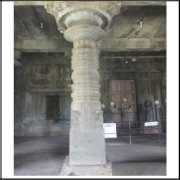
Table 2. Ground truth
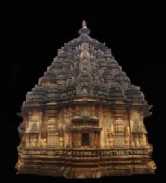

Table 3. Vimana segmented images
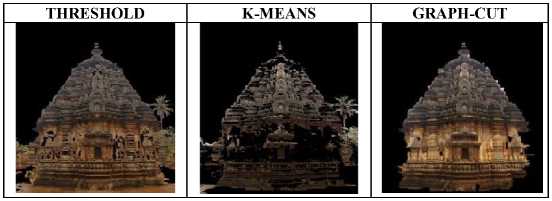
Table 4. Pillar segmented images
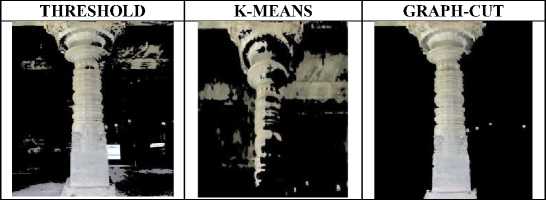
C. Result Analysis
6. Conclusion and Future Scope
To achieve the comparative results about three methods, two statistical measures are followed: the first one is VOE. The second one is DSC. Table 5 shows the analysis result by following both statistical measure strategies on the results of different segmentation methods for vimana and pillar structural elements.
Table 5. Statistical measure values on segmented images
|
Statistical Method |
Threshold |
K-Means |
Graph-Cut |
|||
|
Vimana |
Pillar |
Vimana |
Pillar |
Vimana |
Pillar |
|
|
DSC |
0.69 |
0.72 |
0.45 |
0.49 |
0.82 |
0.80 |
|
VOE |
-46.32 |
-43.42 |
-70.24 |
-67.24 |
-30.21 |
-32.83 |
Based on both statistical measure values we come to conclusion that graph-cut segmentation method gives more accurate results compared to thresholding and K-means segmentation method.
With the help of this article, we may draw the conclusion that graph cut image segmentation method will produce better outcomes than threshold and K-means image segmentation. This effective graph cut segmentation method of vimana and pillars leads to further efficient image processing techniques like feature extraction and classification, these techniques have very important role in temple field survey and temple restoration. However, this image segmentation accuracy may be enhanced by incorporating cutting-edge artificial neural network technology along with automatic image segmentation.
References Comparative Study on Temple Structural Element Segmentation using Different Segmentation Techniques
- R. R. N. Senthilkumaran, “A Study on Rough Set Theory for Medical Image Segmentation,” International Journal of Recent Trends in Engineering, vol. 2, november 2009.
- S. k. A. P. Prasad Dakhole, “Fabric Fault Detection Using Image Processing Matlab,” International Journal For Emerging Trends in Engineering and Management Research (IJETEMR), vol. 2, no. 1, 21 january 2016.
- C. R. Tippana, “Homogeneous Regions for Image Segmentation Based on Fuzzy,” international journal & magazine of engineering, technology, management and research.
- O. Singh, “New Method of Image Segmentation for Standard Images,” IJCST , vol. 2, no. 3, september 2011.
- S. panda, “Color Image Segmentation Using K-means Clustering and Thresholding Technique,” IJESC, march 2015.
- L. H. a. L. Shengpu, “An Algorithm and Implementation for Image Segmentation,” International Journal of Signal Processing, Image Processing and Pattern Recognition, vol. 9, pp. 125- 132, 2016.
- W. B. a. S. Grabowski, “Multi-pass approach to adaptive thresholding based image segmentation,” 26 feb 2005.
- L. H. a. J. Y. Lihua Tian, “Research on Image Segmentation based on Clustering Algorithm,” International Journal of Signal Processing, Image Processing and Pattern Recognition, vol. 9, pp. 1-12, 2016.
- B. T. Sachin Shinde, “Improved K-means Algorithm for Searching Research Papers,” International Journal of Computer Science & Communication Networks, vol. 4, pp. 197-202.
- A. S. B. M. a. H. K. S, “Dynamic Clustering of Data with Modified K-Means Algorithm,” International Conference on Information and Computer Networks, vol. 27, 2012.
- A. Park, J. Kim, S. Min, S. Yun, K. Jung, “Graph Cuts based Automatic Color Image Segmentation using Mean Shift Analysis” IEEE Digital Image Computing: Techniques and Applications, 2008.
- Y. Boykov, V. Kolmogorov, “An experimental comparison of min-cut/max-flow algorithms for energy minimization in vision”, IEEE Trans, Pattern Anal. Machine Intell., 26, pp. 1124–1137, 2004.
- M. Sonka, V. Hlavac and R. Boyle, “Image processing, analysis, and machine vision”, Third edition, Thomson, USA, 2008.
- Y. Boykov and M. Jolly, “Interactive graph cuts for optimal boundary and region segmentation of objects in n-d images”, Proceedings of ICCV, 2001.
- Monteiro F.C., Campilho A.C. (2006) Performance Evaluation of Image Segmentation. In: Campilho A., Kamel M.S. (eds) Image Analysis and Recognition. ICIAR 2006. Lecture Notes in Computer Science, vol 4141. Springer, Berlin, Heidelber.
- https://www.kaggle.com/datasets/narendrakumarsubdtce/ancient-temple-vimana-images-dataset Ancient Temple Vimana images Dataset
- https://jnnce.ac.in/TempleDataSets/NARENDRA%20Description_of_KU-UBDTCE-JNNCE_Temple_Vimana_Dataset.pdf Ancient Temple Vimana images Dataset
- https://www.kaggle.com/datasets/devguruap4u/ancient-temple-pillar-images-dataset Ancient Temple Pillar images Dataset
- https://jnnce.ac.in/TempleDataSets/GURUDEV%20%20Description_of_KU-UBDTCE_JNNCE_Temple_Pillar_Database.pdf Ancient Temple Pillar images Dataset
