Competition between crop and weeds in agroecosystems studied using satellite data and a mathematical model

Author: Pisman Tamara I., Botvich Irina Yu.
Journal: Журнал Сибирского федерального университета. Серия: Техника и технологии @technologies-sfu
Article in issue: 1 т.11, 2018.
Free access
In this study, the data obtained by satellite remote sensing and by studying a mathematical model are combined to investigate seasonal dynamics of wheat and oat agroecosystems with different levels of weed infestation. The study was performed in the south of the Krasnoyarskii Krai. NDVI was used to show the possibility of identifying weed-free and weed-infested crop fields. The model study was based on variations in the initial percentages of the crop and weed biomasses, with plant growth limited by mineral element deficiency. Model prediction of productivity of agroecosystems with different levels of weed infestation showed that the initial weed biomass higher than 30% is critical for crop productivity and may result in considerable crop yield loss.
Agroecosystems, weed infestation, satellite remote sensing, mathematical modeling
Short address: https://sciup.org/146115289
IDR: 146115289 | UDC: 577.3:539.3:528.88 | DOI: 10.17516/1999-494X-0013
Конкуренция культурных и сорных растений в агроценозах на основе спутниковой информации и математической модели
В работе использовано комплексное применение данных спутникового зондирования Земли и результатов исследований математической модели сезонной динамики агроценозов пшеницы и овса с различной степенью засорения. Исследования проводились на территории Юга Красноярского края. На основе NDVI показана возможность идентификации чистых и засоренных полей с посевами зерновых культур. Исследование модели проводилось в зависимости от начального соотношения биомассы культурных и сорных растений при лимитировании роста минеральными элементами. В результате оценена возможность прогноза урожайности агроценозов с разной степенью засорения. Показано, что превышение начальной доли сорной растительности свыше 30 % может стать критическим и привести к значительному уменьшению урожайности культурных растений.
Text of the scientific article Competition between crop and weeds in agroecosystems studied using satellite data and a mathematical model
area. The coordinates of the sample plots were recorded with a GPS navigator. Five samples of fresh aboveground biomass were collected from each of 1 × 1 m2 plots and weighed [5]. Before weighing, the plants cut from the sample plots were separated into three groups: reproductive organs of crops (grains), vegetative organs of crops (stems and leaves), and weeds. The mass of each group was determined separately.
The mathematical model of seasonal dynamics of crop and weed productivities was studied using the Mathcad software. Coefficients used in the model study were computed from results of land-based investigations of wheat and oat agroecosystems [5].
Results and discussion
Satellite remote sensing
Figure 1 shows seasonal dynamics of NDVI of oats and wheat crops. NDVI is known as a “greenness” index. Therefore, the dynamics of NDVI during the plant growing season (June – August) rather accurately corresponds to the dynamics of the seasonal production of total fresh aboveground phytomass of the agroecosystem (the crop and weed biomass). In August, crops lose moisture and turn yellow earlier than weeds, and, thus, weeds growing among cultivated plants can be discerned in high-resolution satellite images.
The initial NDVI value of the oat agroecosystem is higher than that of the wheat agroecosystem (Fig. 1) because of the greater amount of total photosynthesizing vegetation in the oat agroecosystem. Field investigations revealed high weed densities in that agroecosystem [5].
To achieve higher accuracy in detecting weeds among crop plants, we investigated oat agroecosystems located in different plots, with different levels of weed infestation (Fig. 2). During the plant growing season (between June 12 and September), we measured the main biometric parameter – biomass. Measurements showed high correlation between plant biomass and the NDVI values averaged for each field, which were obtained for each plot from the Modis/Terra scanner during the growing season.
The angles of inclination of the relationships between total fresh biomass of the oat crop and NDVI values are clearly different for agroecosystems with different levels of weed infestation. The initial
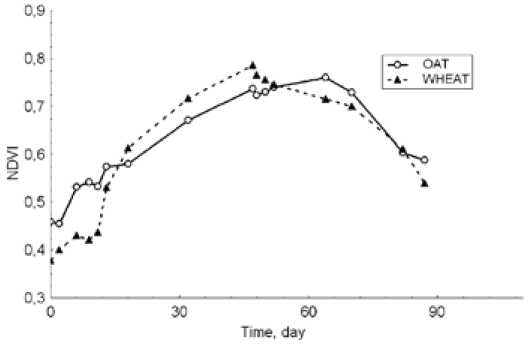
Fig. 1. Seasonal dynamics of NDVI of wheat and oat crops. Time zero is June 1
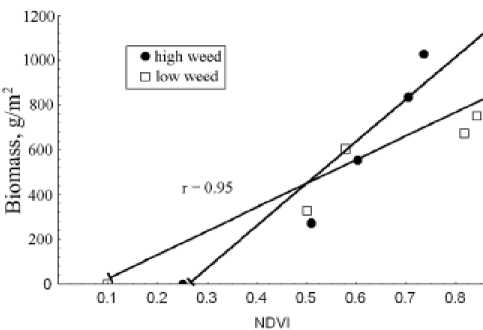
Fig. 2. The relationship between NDVI and total fresh biomass of oats agroecosystems with different levels of weed infestation
NDVI value for the plot with a low level of weed infestation is about 0.1, corresponding to an open (plant-free) land plot. The initial NDVI value for the plot with a high level of weed infestation is 0.2 or higher, probably suggesting the presence of some initial quantity of photosynthesizing vegetation. Later, field studies proved the presence of weeds there [5].
Mathematical model
Seasonal dynamics of the crop and weed yields under nitrogen deficiency can be described by the following model:
dXc / dt = p c ( N ) Xc - p c ( N )( Xc 2 / Xc max)
dXw / dt = p w ( N ) Xw - p w ( N )( Xw 2 / Xw max)
dN / dt = N 0 - p c ( N ) Xc / Yc - p w ( N ) Xw / Yw (1)
p c ( N ) = p c max N /(kcN + N )
p w ( N ) = p w max N /( kwN + N )
where Xc and Xw are biomasses of crop and weeds in the agroecosystem, respectively, g/m2;
μ c( N ) and μw ( N ) are specific rates of increase in the crop and weed biomass, d-1; Xc max and Xw max are maximal biomasses of crop and weeds;
N 0 = 10 g/m2 and N are the initial and current nitrogen concentrations in the soil;
μc max and μw max are maximal specific rates of increase in the crop and weed biomass, d-1;
Yc = Yw = 30 g biomass / g nitrogen – yield coefficients of crop and weeds on nitrogen;
kcN = kwN = 3 g/m2 – half-saturation constants of nitrogen for crop and weeds, which are numerically equal to nitrogen concentration at which specific rates of increase in the crop or weed biomass amount to half of the maximal rate.
Different initial crop to weed ratios were used to study the model of seasonal dynamics of crop and weed productivities. Figure 3 shows results of studying the model of dynamics of the wheat agroecosystem with a low weed density. Initially, the crop constituted about 96% and the weeds about – 98 –
4%. By the middle of the plant growing season, the crop had decreased to 64%, the weeds increasing to 36%. Then, a stationary state was reached, and throughout the remaining season, crop productivity was higher than weed productivity.
To verify the model, we used field data for the wheat agroecosystem with a low level of weed infestation [5]. The initial biomass of the crop was 40 g/m2 and the initial biomass of the weeds was 2 g/m2. At the end of the growing season, the crop productivity (800 g/m2) was considerably higher than the weed productivity. Thus, for the scenario with a low weed infestation, we obtained qualitative agreement between the field data on the seasonal growth of the wheat agroecosystem and results of studying the model.
Figure 4 shows results of studying the model describing dynamics of the oats agroecosystem with a high weed density. Initially, the crop constituted 67% and the weeds 33%. By mid-June, the crop had decreased to 40%, the weeds increasing to 60%. Then, a stationary state was reached, and throughout the remaining season, weed productivity was higher than crop productivity. Thus, model
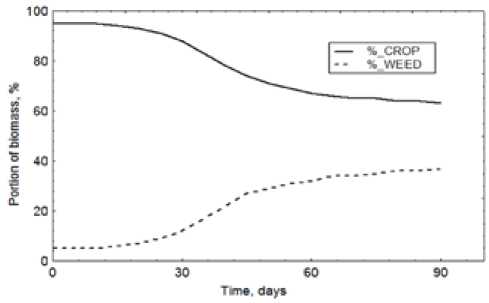
Fig. 3. Seasonal dynamics of the crop and weeds in the wheat agroecosystem with alow initial level of weed infestation (theoretical results). Time zero is June 14
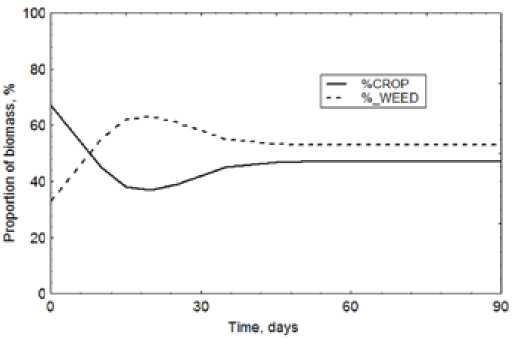
Fig. 4. Seasonal dynamics of the crop and weeds in the oats agroecosystem with a high initial level of weed infestation (theoretical results). Time zero is June 14
studies suggest that the initial weed biomass higher than 30% is critical for crop productivity and may cause considerable reduction in crop biomass and, hence, crop yield loss at the end of the growing season.
To verify the model, we used field data for the oat agroecosystem with a high level of weed infestation, about 20 g/m2 [5]. At the end of the season, the percent of weeds was higher than the percent of crop (oats).
Thus, having studied the model of seasonal dynamics of crop and weeds with different initial percentages of the components, we showed qualitative agreement between the model data and results of the field studies of wheat and oat agroecosystem productivities. The initial weed biomass of about 4% does not significantly affect crop yield at the end of the growing season. However, the initial weed biomass higher than 30% is critical for crop productivity and may result in considerable crop yield loss at the end of the growing season. Coefficients and initial crop to weed ratios of the model can be varied to predict productivities of agroecosystems with different levels of weed infestation.
Conclusion
The reasons underlying interest in the damage done by weeds are numerous, but here are the most important ones [6]. First, the common use of herbicides has failed to solve the weed issue, making it even more controversial. The floristic composition of the weeds has changed, and the abundance of resistant species has increased, decreasing the economic efficiency of the herbicides. Second, in practical and theoretical agriculture, weed populations are usually treated as impurities contaminating crops. In fact, however, all components of agroecosystems interact with each other, and weeds may be considered as a necessary ingredient of the agroecosystem structure. The strategy of weed control should be changed and directed towards prevention of severe weed infestations.
Remote sensing and theoretical studies of interactions between crops and weeds in agroecosystems are useful tools for tackling these issues. The major goal of mathematical modeling is to find a unified mathematical model that will enable statistically reliable predictions of crop yield dynamics over the entire range of variations in weed density and qualitative estimations of potential weed damage and possible crop losses [6].
Исследование выполнено в рамках Комплексной программы фундаментальных исследований СО РАН «Междисциплинарные интеграционные исследования» на 2018-2020 гг. (проект № 74).
References Competition between crop and weeds in agroecosystems studied using satellite data and a mathematical model
- Торопова Е.Ю., Глазунова Е.Б. Влияние состава агроценоза на развитие корневой гнили яровой пшеницы в лесостепи Западной Сибири, Вестник Алтайского государственного аграрного университета, 2014, 4 (114), 38-42
- Архипова О.Е., Качалина Н.А., Тютюнов Ю.В., Ковалев О.В. Оценка засоренности антропогенных фитоценозов на основе данных дистанционного зондирования земли (на примере амброзии полыннолистной), Исследование Земли из космоса, 2014, 6, 15-26
- Damgaard C., Weiner J., Nagashima H. Modelling individual growth and competition in plant populations: growth curves of Chenopodium album at two densities. Journal of Ecology, 2002, 90, 666-671
- Kropff M.J., Spitters C.J.A simple model of crop loss by weed competition from early observations on relative leaf area of the weeds. Weed Research, 1991, 31, 97-105
- Жукова Е.Ю., Шевырногов А.П., Жукова В.М., Зоркина Т.М., Пугачева И.Ю. Сезонная динамика продуктивности агроценозов юга Минусинской котловины, Вестник Томского университета, 2009, 323, 354-358
- Туликов А. М. Вредоносность сорных растений в посевах полевых культур, Известия ТСХА, 2002, 1, 92-107
