Competitive position of Vietnamese regions: analysis of results of provincial competitiveness index

Author: Phan Huy Quang, Buyanova Marina E.
Journal: Региональная экономика. Юг России @re-volsu
Section: Фундаментальные исследования пространственной экономики
Article in issue: 3 т.10, 2022.
Free access
The existence of certain conditions and elements that creates a region’s investment attractiveness is seen to be a challenging and complicated process which leads to a competitive position in respect to other regions in comparison with other ones. The study includes the analysis of the region’s economic and investment situation, and the comparison of provincial competitiveness indexes (PCI) in Vietnam from 2017 to 2021. It should supplement the methodology for regional competitiveness assessment at the involvement and business support. This allows choosing a leading region characterized by a stable and relatively high competitive position compared to the rest of the regions (like Red River Delta region). This clear spatial disparity in regional competitiveness in Vietnam may result from long-term social and economic processes (such as economic growth and investment attraction), and quality of the business environment that depends on the authorities’ ability to work (by means of PCI ranking promotion). As for the second case, the directions of strengthening the competitive position of Vietnam’s regions are expecte to be dynamics in innovation, and persistence in executing institutional reforms in “tougher” areas such as market entry costs, policy bias, transparency, time costs and labor training. The key directions for competitiveness improvement and investment attraction promotion in the short and medium term are as follows: 1) promotion of reforms and transparency of information on administrative procedures for the enterprise; 2) cost reduction of professional training and business satisfaction growth with labor quality; 3) communication strengthening and cooperation between public and private sectors;4) operating methods renewal of the administrative system in accordance with the process of digital technology application in government management.
Regional competitive position, provincial competitiveness index, region’s investment attractiveness, business environment, vietnam
Short address: https://sciup.org/149141101
IDR: 149141101 | UDC: 338.242 | DOI: 10.15688/re.volsu.2022.3.8
Конкурентная позиция регионов Вьетнама: результаты анализа индекса конкурентоспособности провинций
Наличие определенных условий и элементов, делающих регион привлекательным для инвестиций, считается непростым и сложным процессом, который приводит к конкурентным позициям, рассматриваемым в сравнении. Исследование включает в себя анализ экономической и инвестиционной ситуации региона и сравнение провинциальных индексов конкурентоспособности (PCI) Вьетнама с 2017 по 2021 год. Это призвано дополнить методику оценки региональной конкурентоспособности в привлечении и поддержке бизнеса, что позволяет выбрать регион с высокой и стабильной лидирующей позицией по сравнению с остальными (например, дельта Красной реки). Очевидное пространственное неравенство региональной конкурентоспособности во Вьетнаме может быть результатом долгосрочных социально-экономических процессов (таких как экономический рост и привлечение инвестиций), а качество деловой среды зависит от оперативной способности властей (через продвижение PCI). В месте с тем направления укрепления конкурентоспособности регионов Вьетнама должны заключаться в том, чтобы воспользоваться динамизмом инноваций и настойчиво проводить институциональную реформу в «трудных» секторах, таких как стоимость входа на рынок, отклонение от политики, прозрачность, затраты времени и труда на обучение. В качестве ключевых направлений повышения конкурентоспособности и стимулирования привлечения инвестиций в краткосрочной и среднесрочной перспективе выступают: 1) содействие реформам, упрощение административных процедур и прозрачность информации об административных процедурах для предприятия; 2) снижение затрат на профессиональное обучение и повышение удовлетворенности бизнеса качеством труда; 3) укрепление связи и сотрудничества между государственным и частным секторами; 4) обновление методов работы административной системы в соответствии с процессом применения цифровых технологий в деятельности государственного управления.
Text of the scientific article Competitive position of Vietnamese regions: analysis of results of provincial competitiveness index
DOI:
The rapid changes in the global economy related to the digitization trend, COVID-19 epidemic and recent political conflicts have prompted the state and regional authorities to remain participation and survival in global markets as well as improve macroeconomic performance and welfare of people. Competitive development and Economic reform also belong to these activities. Since the nature of competition is the basis of market relations, it forces enterprises to increase productivity, attain and realize competitive advantages, and ultimately affect the competitiveness of the territories in which they operate [Porter, 1990; Krugman, 1994; Delgado et al, 2012]. With this point of view, the particular conditions and elements that create the attractiveness of the region predetermine the competitive position as a strategic factor [Uruzbayeva, 2016], which defines the various degrees of regional economic and social growth [Huggins, 2003; Sadki, Nmili, Jalal, 2020].
The region’s investment attractiveness is a complex concept. A lot of scientists emphasize that the region’s investment attractiveness is looked at as a comparative characteristic, while the criteria for comparison are based on accessibility of regional resources and the ability of regional authorities to update and enlarge the resource [Snieska, Zykiene, 2015]. As a cluster, the investment attractiveness of the region is defined by a comparative status of the business environment and the state of the non-entrepreneurial infrastructure expressed in the quality of the living environment [Rodionov, Konnikov, Nasrutdinov, 2021]. However, we can’t find a region may not be competitive in both blocks above. Its wealth depends on the ability to attract or to create quite profitable kinds of economic activity. Specifically, investment attractiveness of the region is mainly derived from building a favorable business environment. This process has been attributed to different conditions across individual localities, countries, and regions in terms of the competitive edge, geographical location, political landscapes, and the trajectories of socio-economic development that vary their steps taken on the path of economic development to achieve competitiveness in the global context [Malesky, 2007; Bruneckiene, Cincikaite, Kilijoniene, 2012].
These raise the questions: Have there been changes in the level of competitiveness of the regions over a period of five years? Is it possible to select units that stand out in their position compared to others? Therefore, the aim of the study is to assess the competitive position of Vietnam’s regions in terms of the quality of economic governance and building a favorable business environment. The study includes an analysis of the economic and investment situation of the regions, and a comparison of the Provincial Competitiveness indexes (PCI) in Vietnam from 2017 to 2021.
Material and method
The Vietnam Competitiveness Improvement Project and the Vietnam Chamber of Commerce and Industry (VCCI) collaborated on the development of the Provincial Competitiveness Index (PCI) on Vietnam’s Business Environment. PCI reviews and ranks 63 provinces each year on a basis of the attitude and policy execution of the provincial government toward the private sector, based on input from businesses (over 85,000 enterprises). This index is calculated in a three-step sequence such as: 1) collect business survey data and published data sources; 2) calculate ten sub-indices and standardize them on a 10-point scale; and 3) calibrate the composite PCI as the weighted mean of ten sub-indices with a maximum score of 100 points.
In the Decree No.92/2006/ND-CP dated 7 th September 2006, the six socioeconomic regions are developed on a basis of similarities in geographical location, natural and social characteristics in 63 provinces as follows:
-
– the Red River Delta region includes 11 provinces and cities: Hanoi, Hai Phong, Hai Duong, Hung Yen, Ninh Binh, Thai Binh, Ha Nam, Nam Dinh, Bac Ninh, Vinh Phuc and Quang Ninh;
-
– Northern midland and mountainous region, including 14 provinces: Lai Chau, Dien Bien, Son La, Hoa Binh, Cao Bang, Lang Son, Bac Giang, Thai Nguyen, Bac Kan, Ha Giang, Tuyen Quang, Phu Tho, Lao Cai, Yen Bai;
-
– the North Central and Central Coast regions, including 14 provinces and cities: Thanh Hoa, Nghe An, Ha Tinh, Quang Binh, Quang Tri, Thua Thien Hue, Da Nang, Quang Nam, Quang Ngai, Binh Dinh, Phu Yen, Khanh Hoa, Ninh Thuan, Binh Thuan;
-
– Central Highlands region, including 5 provinces: Kon Tum, Gia Lai, Dak Lak, Dak Nong, Lam Dong;
-
– Southeast region, including 6 provinces and cities: Ho Chi Minh, Tay Ninh, Binh Phuoc, Binh Duong, Dong Nai, Ba Ria – Vung Tau.;
-
– the Mekong Delta region, including 13 provinces and cities: Long An, Ben Tre, Tien Giang, Dong Thap, Kien Giang, An Giang, Vinh Long, Tra Vinh, Can Tho, Hau Giang, Soc Trang, Bac Lieu, Ca Mau.
For the purposes of this study, a three-step sequence was performed. First of all, the author presents an overview of regional economic and investment situation of the regions based on a basis of processed statistical data. Then, competitive position of the regions are discussed and compared based on the analysis of composite scores, rankings and PCI component indexes of the provinces. In order to visualize the evaluation results, the competitiveness polygons were constructed. Finally, problems for improving the competitiveness across regions will be discussed. The information obtained on the strong relationships that occur can be used to improve the quality of governance in the region, which may also contribute to increasing the level of competitiveness of a given region in the future.
Results
Overview of the economic and investment status among regions in Vietnam
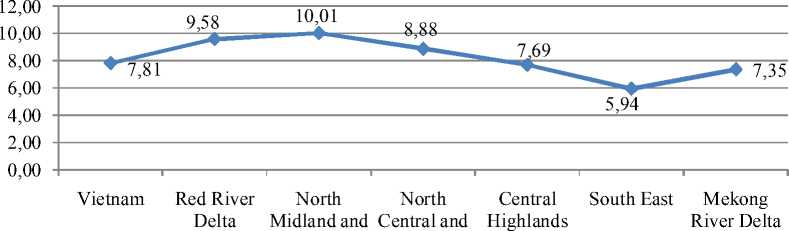
Vietnam has made numerous achivements and rapid transformation in society after more than 30 years of economic reform, with an average annual economic growth rate of 6.73% from 2015 to 2018. However, economic development among regions is unequal. Gross Regional Domestic Product (GRDP) in the Northern Midlands and Mountains witnessed the highest increase with 10.0%, more than the Vietnam’s average Gross Domestic Product (GDP) growth rate of 2.2% (Fig. 1), followed by the Red River Delta and the North Central and Central Coast regions (1.77% and 1.07%, respectively). The growth rate of GRDP of the remaining three regions is lower than the growth rate of GDP as these regions have many localities with growth rate much lower than GDP growth rate, even with negative growth rate. In particular, the Southeast region’s growth rate is lower than GDP growth rate of 1.87% in recent years as the world oil price has continuously decreased, affecting crude oil production in the region and reducing the growth rate of GDP. In particular, the GRDP of Ba Ria – Vung Tau province in 2016 decreased by 3.49% compared to 2015 and decreased by 4.92% in 2017. In 2018, the average GRDP of the province in the period 2011–2017 comtinued to decrease by 3.02%. Thus, the growth rate of GRDP shows that there is uneven economic growth among regions of Vietnam due to the differences in economic development rate between provinces in Vietnam.
The growth rate of GRDP per capita of all regions increased more than the growth rate of GDP per capita (Table 1). The highest is in the Red River Delta at 13.83%, 2.5 times higher than the GDP per capita growth rate. It is an exception that in the North
Central and Central Coast regions, the growth rate of GRDP per capita (3.95%) is lower than the growth rate of GDP per capita (1.63%). This fact reflects the uneven quality of economic growth across regions in Vietnam today.
Local and regional economic growth is mostly centered in the industrial sector though it depends heavily on foreign investment. The investment environment in economic regions has steadily improved and the investment capital of the entire community has expanded significantly over time with an emphasis on critical infrastructure projects in provinces.
The local government has launched an institutional reform in order to faciliate the growth of domestic businesses and elevates it to new heights. In the period 2015–2018, the total social investment capital of the entire country is 9158.1 trillion VND. The Red River Delta region reached the highest level of 2870.1 trillion VND (accounting for 31.34% of the total investment capital of the country). Ranking below are the Southeast region (2335.4 trillion VND); the North Central region (1755.9 trillion VND); the Mekong River Delta (1000.3 trillion VND); the
Mountainous South
Central Coast
Fig. 1. Average growth rate among regions in Vietnam in the period 2015–2018
Note. Author’s calculation based on socio-economic data of 63 provinces in 2020 [Socio-Economic Statistical ... , 2020].
Table 1
GRDP per capita of the region compared to GDP per capita of the entire economy in the period 2015–2018 (Unit: Times)
|
Regions |
Years |
|||
|
2015 |
2016 |
2017 |
2018 |
|
|
Red River Delta |
1,56 |
1,24 |
1,92 |
1,95 |
|
North Midland and Mountainous |
0,77 |
0,61 |
0,82 |
0,83 |
|
North Central and South Central Coast |
0,96 |
0,72 |
0,89 |
0,91 |
|
Central Highlands |
0,72 |
0,61 |
0,79 |
0,79 |
|
South East |
2,45 |
2,12 |
2,68 |
2,65 |
|
Mekong River Delta |
0,85 |
0,67 |
0,87 |
0,88 |
Note. Author’s calculation based on socio-economic data of 63 provinces in 2020 [Socio-Economic Statistical ... , 2020].
Northern Midlands and Mountainous region (886.8 trillion VND) and the lowest one is the Central Highlands with 308.6 trillion VND).
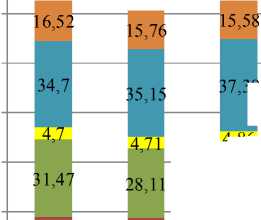
The Red River Delta and the Southeast region attract more social investment than the other four economic regions. In the period 2015–2018, the proportion of investment capital in the Red River Delta accounted for from 41.74% to 44.81% of the total investment capital of the country; Southeast region occupies from 34.70% to 36.42%. The proportion of total investment in the Central Highlands is at the lowest level, from 4.7% to 5.02% (Fig. 2). The high proportion of investment capital in the Red River Delta and the Southeast region in total domestic investment reflects the comparative advantages of these two regions, which have been effectively utilized to attract domestic investment and promote economic development.
In terms of foreign investment attraction, the cumulative total number of licensed projects until December 2021 of all 6 economic regions is 34447 projects (accounting for 91.9% of the total FDI projects of the whole country). The Southeast region has 17491 projects, with a total registered capital of more than 159.25 billion USD, accounting for 50.73% of total projects and 40.58% in capital compared to the whole country; The Red River Delta region has 11 626 projects, with a total registered capital of 121709 billion USD, accounting for 33.72% and 30.03%; The Northern Midlands and Mountains region has 1 187 projects, with a total registered capital of 22.16 billion USD, accounting for 3.44% and 5.47%; The Central Highlands region has only 164 projects with a total registered capital of 1.71 billion USD, accounting for 0.47% and 0.42% (Table 3).
Table 2
Socially realized investment capital in economic regions in the period 2015–2018 (Unit: trillion Vietnam Dong)
|
Regions |
Years |
||||
|
2015 |
2016 |
2017 |
2018 |
2015–2018 |
|
|
Vietnam |
1985,73 |
2099,72 |
2426,92 |
2644,70 |
9157,06 |
|
Red River Delta |
570,30 |
657,15 |
807,74 |
834,89 |
2870,08 |
|
North Midland and Mountainous |
221,26 |
197,04 |
227,48 |
241,02 |
886,80 |
|
North Central and South Central Coast |
430,03 |
418,14 |
425,71 |
481,97 |
1755,85 |
|
Central Highlands |
64,24 |
70,03 |
81,15 |
93,20 |
308,62 |
|
South East |
474,21 |
522,87 |
624,55 |
713,76 |
2335,39 |
|
Mekong River Delta |
225,69 |
234,49 |
260,29 |
279,86 |
1000,32 |
Note. Author’s calculation based on socio-economic data of 63 provinces in 2020 [Socio-Economic Statistical ... , 2020].
4,86
25,49
13,62
13,25
16,19
41,74
44,17
48,3
15,07
15,73
36,42
38,43
44,96
2018 2015-2018
-
■ Mekong River Delta
-
■ South East
Central Highlands
-
■ North Central and South Central Coast
-
■ North Midland and Mountainous
-
■ Red River Delta
2021. The lowest is the North Central and Central Coast regions from 62.81 points in 2017 to 64.46 points in 2021.
Fig. 2. Ratio of investment capital in regions to the total investment capital of the whole country in the period 2015–2018 Note. Author’s calculation based on socio-economic data of 63 provinces in 2020 [Socio-Economic Statistical ... , 2020].
Competitive position of the regions based on provincial competitiveness index ranking results
The analysis of the causes of uneven development among regions above has shown that regions without a well-developed resource basis or with strongly spcialized industry have more problems than other regions. In addition, the most important factor affecting the level of regional economic development is the quality of management, both in the public and private sectors.
Table 4 presents the ranking results and median PCI scores of 6 regions across the country in the period 2017–2021. The continuous and strong reforms of the provincial governments have had a significant impact on the business community’s perception of operating quality and business environment as the average scores of all regions across the country increased during this period. The score increase of the Red River Delta region is the strongest from 61.97 points in 2017 to 67.65 points in
If we consider regions as a “locality” in the PCI ranking and based on the current operating grop, the results of the years from 2017 to 2021 of the “locality” will be as follows: the Red River, the Mekong River Delta, the Southeast (from “average” to “fair”); Northern Midlands and Mountains and Central Highlands (from “relatively low” to “medium”). In particular, the North Central Coast and the Central Coast region have a low difference, so they are still in the “good” managment group.
To better define the changing trends of regional economic governance quality, Table 5 below shows the changes of the PCI subindeces across regions. For example, the business environment of the Northern Midlands and Mountains in 2021 is still not really attractive and creates favorable conditions for businesses and investors compared to the rest of the country. The Northern Midlands and Mountains region has 4
Table 3
Number of projects and licensed registered capital (accumulated to December 2021)
|
Regions |
Projects |
Registered capital |
||
|
Total |
Rate, % |
Total (triеu USD) |
Rate, % |
|
|
Vietnam |
34477 |
100,00 |
405325 |
100,00 |
|
Red River Delta |
11626 |
33,72 |
121709 |
30,03 |
|
North Midland and Mountainous |
1187 |
3,44 |
22161 |
5,47 |
|
North Central and South Central Coast |
2170 |
6,29 |
61303 |
15,12 |
|
Central Highlands |
164 |
0,48 |
1708 |
0,42 |
|
South East |
17491 |
50,73 |
164474 |
40,58 |
|
Mekong River Delta |
1839 |
5,34 |
33970 |
8,38 |
Note. Author’s compilation based on data of Vietnam Foreign Investment Agency in 2021 [Situation of Attracting Foreign Investment ... , 2021].
Table 4
Median PCI scores by regions for the period 2017–2021
|
Regions |
Years |
|||||
|
2017 |
2018 |
2019 |
2020 |
2021 |
Increase level in 2021 compared to 2017 |
|
|
Red River Delta |
61,97 |
63,55 |
65,38 |
63,84 |
67,65 |
5,68 |
|
North Midland and Mountainous |
59,99 |
61,75 |
63,98 |
62,71 |
62,89 |
2,90 |
|
North Central and South Central Coast |
62,81 |
63,96 |
65,42 |
63,67 |
64,46 |
1,75 |
|
Central Highlands |
60,91 |
62,48 |
64,81 |
63,12 |
64,20 |
3,29 |
|
South East |
64,13 |
64,28 |
67,00 |
65,02 |
66,63 |
2,50 |
|
Mekong River Delta |
62,16 |
63,43 |
64,99 |
63,11 |
64,74 |
2,58 |
Note. Author’s compilation based on VCCI data in the period 2017–2021 [Provincial Competitiveness Index-PCI 2017 ... , 2017; Provincial Competitiveness Index-PCI 2018 ... , 2018; Provincial Competitiveness Index-PCI 2019 ... , 2019; Provincial Competitiveness Index-PCI 2020 ... , 2020; Provincial Competitiveness Index-PCI 2021 ... , 2021].
Table 5
Comparison of PCI subindexes across regions in 2021
|
Regions |
Ingredient index |
|||||||||
|
Entry Costs (1) |
Land Access & Tenure (2) |
Transparency (3) |
Time Costs (4) |
Informal Charges (5) |
Policy Bias (6) |
Proactivity (7) |
Business Support Services (8) |
Labor Training (9) |
Law & Order (10) |
|
|
Red River Delta |
6,73 |
7,14 |
5,63 |
8,14 |
7,24 |
6,29 |
7,07 |
6,56 |
6,74 |
7,21 |
|
North Midland and Mountainous |
6,69 |
6,78 |
6,18 |
7,07 |
6,62 |
6,04 |
6,98 |
6,25 |
5,37 |
7,23 |
|
North Central and South Central Coast |
7,04 |
6,96 |
6,06 |
7,52 |
7,13 |
5,61 |
6,76 |
6,96 |
5,98 |
7,07 |
|
Central Highlands |
6,39 |
7,28 |
5,57 |
6,84 |
6,77 |
6,70 |
6,59 |
6,81 |
5,95 |
7,68 |
|
South East |
6,43 |
7,17 |
6,03 |
7,75 |
6,88 |
5,79 |
6,75 |
7,60 |
6,06 |
6,70 |
|
Mekong River Delta |
7,16 |
7,28 |
5,95 |
7,57 |
7,35 |
5,76 |
7,13 |
6,95 |
5,44 |
7,23 |
Note. Author’s compilation based on VCCI data in the period 2017–2021 [Provincial Competitiveness Index-PCI 2017 ... , 2017; Provincial Competitiveness Index-PCI 2018 ... , 2018; Provincial Competitiveness Index-PCI 2019 ... , 2019; Provincial Competitiveness Index-PCI 2020 ... , 2020; Provincial Competitiveness Index-PCI 2021 ... , 2021].
component indexes with median scores at the bottom of the 6 regions ranking, including: Access to land; Informal expenses; Business support services and Labor Training. In addition, the region has only performed best in one area of economic management compared to other regions, which is creating an open and transparent business environment. This shows that the government’s response and policies have not been timely and flexible towards the private sector under the negative impact of the Covid epidemic.
In contrast, the Red River Delta is assessed to be the region with the most favorable business environment for the private sector. The region has two indexes ranked 1/6 (Time cost and Labor training); 3 indexes ranked 2/6 (Informal Costs, Proactivity and Policy Bias); but only 1 index (Transparency) ranked 6/6 regions across the country.
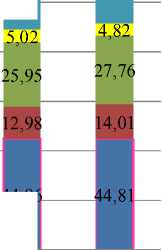
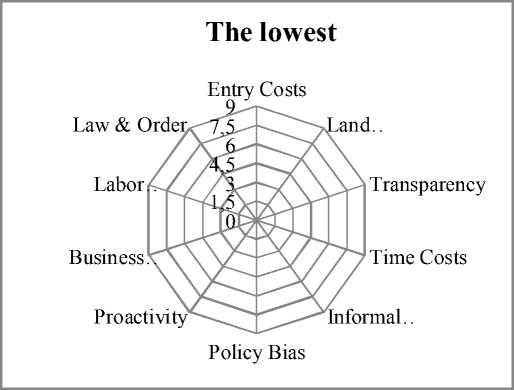
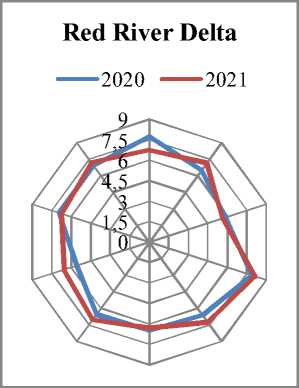
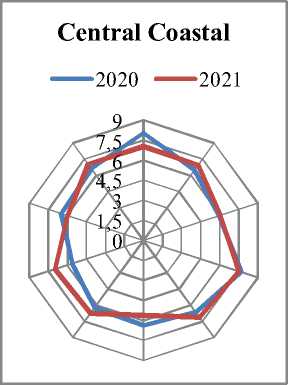
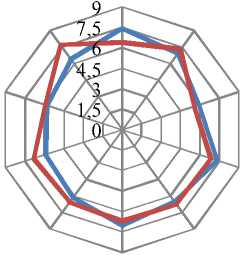
To determine the common factors affecting the quality of economic governance of regions, the author compares the change of the component indexes of each region in 2021 compared with 2020 (see Fig. 3 blow). The Red River Delta region has 6/4 improved indicators such as Land Access & Tenure, Time cost, Informal costs, Proactivity, Business support services, Law & Order (increase from 0.2 to 1 point in 2021 compared to 2020). The remaining indexes had a worrying drop such as the Costs of market Entry decreased by nearly 1 point; Transparency and Labor Training decreased by 0.2 points; Policy Bias decreased 0.17 points.
and a general decline in other regions’ indexes (market Entry Costs, Transparency).
The above results reflect the generally positive trend of business environment reform activities of regions in Vietnam over the past 5 years. However, reform activities need to be further promoted in these areas. The degree of change is not uniform across areas and still a significant proportion of businesses have not noticed an improvement over time.
It is obvious that the trend of improving the local business environment is also consistent with the movement trend of Vietnam’s business environment. From 2014 up to now, the Government of Vietnam has also identified improving the business environment and enhancing national competitiveness as one of the economic policy focuses. This is evident in the fact that the Government has continuously issued Resolution 19 (2014–2018) [Resolution No. 19-2018/NQ-CP ... , 2018] and Resolution 02 (2019 to present) [Resolution 02/NQ-CP ... , 2019] requesting ministries, branches and local authorities to carry out many tasks, solve measures to create a favorable business environment for enterprises. Most recently, the Government continued to issue Resolution 02 dated January 10, 2022 [Resolution 02/NQ-CP ... , 2022] setting goals, tasks and key solutions for 2022 and a vision to 2025 with specific solutions as follows: Cut down on the list of investment and conditional business conditions; Focus on removing legal barriers to investment activities; Renovate administrative management of land; Continue to support people and businesses to restore production; Developing an innovation ecosystem.

Central Highlands
^^^^^^e 2020 ^^^^^^e 2021
South East
^^^^w 2020 ^^^^w 2021
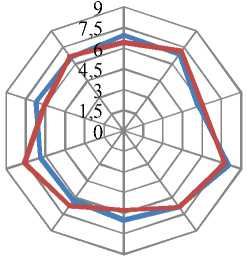
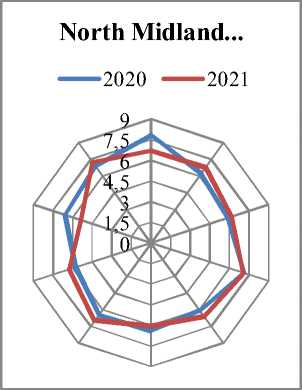
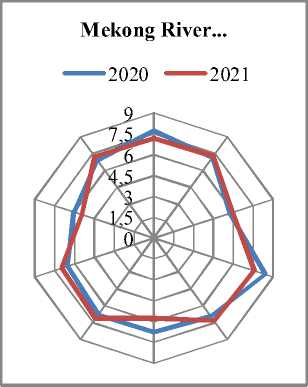
Fig. 3. PCI subindexes among regions in 2021 compared to 2020
Note. Source: Author’s compilation based on VCCI data in 2020 and 2021 [Provincial Competitiveness Index-PCI 2020 ... , 2020; Provincial Competitiveness Index-PCI 2021 ... , 2021].
Conclusion and recommendation
The level of competitiveness of regions is determined by the presence of competitive advantages, as well as the effectiveness of managing these advantages. Competitive advantages are factors that allow regions to occupy higher positions relative to other regions in terms of socioeconomic development. Based on the findings of economic data, investment and comparative analysis of the component indexes of the PCI period 2017– 2021, the Red River Delta is now a place of development socioeconomic status is higher than many other regions. It also has the highest PCI among the 6 regions of the whole country. This region therefore has claimed its leading competitive position in comparison to other regions. As a result, sources of visible competitiveness advantages of Vietnam’s regions were the visible sources of competitive advantage of Vietnam’s regions are the effective management of resources (related to indicators of economic growth and investment attractiveness) as well as good state of business environment (depending on the operating ability of the authorities).
Comparable analysis and evaluation of aspects of PCI subindexes proved, that the business environment across regions in Vietnam will improve if local governments pay attention to, promote and support enterprises the corporate community’s perspective during difficult time. It is obvious that it must be supported with dynamism, reform innovation and persistence in executing institutional reforms, including in “tough” areas such as Market entry costs, Policy Bias, Transparency, Time cost and Labor training are all important factors. Finally, to promote the private sector, regional development plans must be coordinated with the State’s programs.
To increase competitiveness and further promote enterprise attraction, priority solutions need to be implemented across regions in the coming years, including: 1) promote reform and simplification of administrative procedures; publicize and produce transparent information on administrative procedures regarding land, business; 2) reduce job training costs and improve business satisfaction with labor quality; 3) strengthen communication and cooperation with the private sector through routine local activities and planning, for example, through private sector involvement in using the PCI; 4) renovate the operating methods of the administrative system, appropriate with the process of applying information and digital technology in state management activities.
References Competitive position of Vietnamese regions: analysis of results of provincial competitiveness index
- Bruneckiene J., Cincikaite R., Kilijoniene A., 2012. The Specifics of Measurement the Urban Competitiveness at the National and International Level. Inèinerinė ekonomika [Engineering Economics], vol. 23, no. 3, pp. 256-270. DOI: 10.5755/j01.ee.23.3.1272
- Delgado M., Ketels C.H.M., Porter M.E., Stern S., 2012. The Determinants of National Competitiveness. NBER Working Paper No. w18249. Cambridge, MAб National Bureau of Economic Research, Inc. 48 p. DOI: 10.3386 / w18249
- Huggins R., 2003. Creating a UK Competitiveness Index: Regional and Local Benchmarking. Regional Studies, vol. 37, no. 1, pp. 89-96. DOI: 10.1080/0034340022000033420
- Krugman P.R., 1994. Competitiveness: A Dangerous Obsession. Foreign Affairs, vol. 73 (2), pp. 28-44. DOI: 10.2307/20045917
- Malesky E.J., 2007. Provincial Governance and Foreign Direct Investment in Vietnam. Saigon Economic Times, Knowledge Publishing House. 17 p. URL: https://sites.duke.edu/malesky/files/2014/07/Provincial-Governance.pdf
- Porter M.E., 1990. The competitive advantage of nations. New York, Free Press. 21 p.
- Provincial Competitiveness Index-PCI 2017: Evaluating Quality of Economic Governance to Promote Business Development, 2017. Hanoi, VCCI. URL: https://pcivietnam.vn/uploads/ENBao-cao-dai/2017_PCI_Report_final.pdf (accessed 30 March 2022).
- Provincial Competitiveness Index-PCI 2018: Evaluating Quality of Economic Governance to Promote Business Development, 2018. Hanoi, VCCI. URL: https://pcivietnam.vn/uploads//ENBao-cao-dai/2018_PCI_Report_final.pdf (accessed 30 March 2022).
- Provincial Competitiveness Index-PCI 2019: Evaluating Quality of Economic Governance to Promote Business Development, 2019. Hanoi, VCCI. URL: https://pcivietnam.vn/uploads/ENBao-cao-dai/2019_PCI_Report_final.pdf (accessed 30 March 2022).
- Provincial Competitiveness Index-PCI 2020: Evaluating Quality of Economic Governance to Promote Business Development, 2020. Hanoi, VCCI. URL: https://pcivietnam.vn/uploads/ENBao-cao-dai/2020_PCI_Report_final.pdf (accessed 30 March 2022).
- Provincial Competitiveness Index-PCI 2021: Evaluating Quality of Economic Governance to Promote Business Development, 2021. Hanoi, VCCI. URL: https://pcivietnam.vn/uploads/ENBao-cao-dai/2021_PCI_Report_final.pdf (accessed 30 March 2022).
- Rodionov D.G., Konnikov E.A., Nasrutdinov M.N., 2021. A Transformation of the Approach to Evaluating a Region’s Investment Attractiveness as a Consequence of the COVID-19 Pandemic. Economies, vol. 9, no. 2: 59. DOI: 10.3390/economies9020059
- Sadki T., Nmili M., Jalal C., 2020. Regional Competitiveness: A Critical Theoretical Review and Managerial and Political Implications. Revue Alternatives Manageriables et Economiques, vol. 2, no. 4, pp. 194-216. DOI: 10.48374/IMIST.PRSM/amev2i4.23419
- Situation of Attracting Foreign Investment in 2020, 2021. Department of Foreign and Investment. URL: https://fia.mpi.gov.vn/Detail/CatID/f3cb5873-74b1-4a47-a57c-a491e0be4051/NewsID/5d476094-8272-4d9d-b810-1609ce7b67b3/MenuID (accessed 10 March 2022).
- Snieska V., Zykiene I., 2015. City Attractiveness for Investment: Characteristics and Underlying Factors. Procedia – Social and Behavioral Sciences, vol. 213, pp. 48-54. DOI: 10.1016/j.sbspro.2015.11.402
- Socio-Economic Statistical Data of 63 Provinces and Cities, 2020. Hanoi, Statistical Publishing House. 1065 p.
- General Statistic Office. URL: https://www.gso.gov.vn/en/data-and-statistics/2020/05/socioeconomic-statistical-data-of-63-provinces-andcities/ (accessed 22 March 2022).
- Resolution No. 19-2018/NQ-CP on Сontinuing to Perform Key Tasks and Solutions to Improve the Business Environment and Enhance National Competitiveness in 2018 and the Following Years, 2018. URL: https://vanban.chinhphu.vn/default.aspx?pageid=27160&docid=193672 (accessed 10 March 2022).
- Resolution 02/NQ-CP of the Government on Continuing the Key Tasks and Solutions to Improve Business Environment and National Competitiveness in 2019 and Orientations Towards 2021, 2019. URL: https://vanban.chinhphu.vn/default.aspx?pageid=27160&docid=195714 (accessed 10 March 2022).
- Resolution 02/NQ-CP Regarding the Key Tasks and Solutions to Improve Business Environment and National Competitiveness in 2022, 2022. URL: https://vanban.chinhphu.vn/?pageid=27160&docid=205075&classid=509 (accessed 10 March 2022).
- Uruzbayeva N.A., 2016. Problemy i puti uluchshenija delovogo klimata v regionah [Problems and Ways to Improve the Business Climate in the Regions]. Jekonomika regiona [Economy of the Region], vol. 12, no. 1, pp. 150-161. DOI: 10.17059/2016-1-11
