Comprehensive Evaluation of Energy Transportation Corridor in China

Автор: Guang-jun Jiang
Журнал: International Journal of Information Technology and Computer Science(IJITCS) @ijitcs
Статья в выпуске: 4 Vol. 3, 2011 года.
Бесплатный доступ
In order to offer reference for the energy transportation channels in future, we evaluated the existing system with the information entropy theory. By calculating the base value for the scale of construction and the equilibrium degree with the data of annual investment in the fixed assets from 1986 to 2010, we measured the scale and its rationality, and analyzed the relation between transportation channels and the information entropy combined with the maximum entropy methods. Empirical results show that the partial information entropy Si still have certain rising space. We can improve the rationality of the energy transportation channels by improving the partial information entropy Si. And we should not let the rail transportation channels have excessive investment growth, and then secondly transfer some of the highway investment to the transportation channels of waterway or pipeline while finally advance the construction step of the pipeline transportation channels. This conclusion provides a quantitative basis for measuring the rationality of the construction scale of the energy transportation channels. The quantitative evaluation of the construction scale of energy transportation channels is a important supplement to the traditional research and provide evidence for further development. And we can obtain more suggestions on the development strategy emphasis in future.
Energy transportation corridor, investment in the fixed assets, information entropy, scale of construction, equilibrium degree, dominance degree
Короткий адрес: https://sciup.org/15011633
IDR: 15011633
Текст научной статьи Comprehensive Evaluation of Energy Transportation Corridor in China
Published Online August 2011 in MECS
In China, the conventional primary energy resources mainly distribute in the West and the North while the oil and natural gas are in the Northeast, North China, Northwest, and the sea [1]. Above 70% of the coal resources are in the province of Inner Mongolia, Shaanxi, Shanxi, and Xinjiang, etc[2]. The energy transportation pattern is determined by the converse distribution between the energy resource and the consumer market [3]. It is well known that the conventional energy corridor in China is, respectively, the railway, the highway, the harbor/waterway, and the oil/gas pipeline. The railway and pipeline play key roles on the transportation of oil and gas. And the long distance transportation in energy is dramatically dependent on the railway and waterway. Besides, the highway, which is an important supplement, fulfills the role of convergence. After many years of development and construction, the elementary corridor system of energy transportation has been formed in our country, which can cover the producer and consumer of energy resource. However, the energy demand is increasing with China's rapid economic development. The global economic downturn is triggered by the U.S. sub-prime mortgage crisis in 2008. Although the energy market is inverted from the tension supply to the local excess supply, our energy transportation is still facing a serious challenge, i.e., there are still serious structural problems, environmental pressure is out of the limit, and the deficiencies in the production layout are very significantly [4]. Accordingly, to solve these problems, the relevant departments adopt active measures to accelerate investment, control the overseas energy resources, establish the national energy supply, vigorously promote the western energy base, and gradually carry out the development of transferring energy resources exploitation to the West. With the West's rapid growth in energy production, the pressure on large-scale transportation and adjustments in energy is increased.
Economic development inevitably leads to structural transformation [2]. For a country or region, the structural transformation manifest features in two aspects. The industrial structure upgraded, at the same time, the urbanization level increased. For the objective requirements on the evolution of economic structure and spatial structure, energy consumption structure has changed significantly in regularity. When the economy is in the early years of industrialization, the energy consumption structure depends on energy resources, and energy consumption mode manifested as the supply restrained form. With the level of economic development and opening degree continues to increase, energy consumption structure will continuously change. Clean energy will replace traditional energy and high efficiency energy will replace low efficiency energy. The influence of energy resources on energy consumption structure has been remarkably weakened. Finally the energy consumption structure has evolved into requirement guide form. It was an automatic and reversible process. Energy transportation mode will have corresponding change.
By the end of 2009, the rail coal turnover volume was 847.819 billion tons-kilometers, the rail coke turnover volume were 83.952 billion tons-kilometers, the rail petroleum turnover volume was 119.234 billion tons-kilometers. Although the annual investment in fixed assets for the transportation corridor is up to 23271.3 billion yuan in 2009, the energy transportation bottleneck problem has been increased.
This paper attempts to introduce the information entropy theory to the evaluation on the scale of the energy transportation corridor. By calculating the base value for the scale of construction and the equilibrium degree with the data of annual investment in the fixed assets from 1986 to 2009, we measured the scale and its rationality, and analyzed the relation between transportation corridor and the information entropy.
-
II. Quantitative Calculation for the Construction Scale based on the Information
-
A. Information entropy theory
"Entropy" is generally defined as the thermodynamic entropy and the generalized entropy in two forms. Thermodynamic entropy is a thermodynamic system concept in physics [5]. General entropy refers to a measure of physical state of the system and the possibility of the material system state. Information entropy is generalized entropy [6,7].
In 1908, an average uncertainty measure H for a signal source with a certain probability distribution is defined by Shannon [8], who proves that measure H and the macroscopic quantity entropy on the statistical realization form for the entropy can be interchanged, using the methods of equal a priori probabilities. The detailed form is the following,
Regarding a uncertain system, let X be the state characteristic of the random variable and assume that this variable can be written in the discrete form as X = { x 1 , x 2 ••• x n }( n > 2 ) .Then, the corresponding probability is in the form p = { p 1 , p 2 ... p n }( o < p i < 1, - = 1,2, - •• , n ) , where T p = 1 . Thus, the measure H of the uncertainty system can be expressed as,
n
H = — C T p i ln p i . (1) i = 1
The measure H in (1) mentioned above is the expected information entropy, which is also known as the Shannon formula. The Shannon formula was widely used to describe the random events uncertainty and disorder in natural and social sciences [8].
The order degree in local land utilization system has been studied by Tan, et al [9]. by calculating the information entropy of land utilization structure. Geng [10], introduce the information entropy theory to the evolution of energy consumption structure, who investigates the energy consumption structure of local residents in Wuxi, by calculating the equilibrium and dominance degrees to measure the energy consumption structure. In addition, new suggestions are given by Tian, et al [11], who further considers more effects on the energy consumption and increase energy supply capability index in their calculation.
-
B. Definition of information entropy in scale of construction in energy transportation corridor
In the nonlinear open system, there are extensive exchange in material, energy and information. The energy transportation corridor system has the property of spontaneous and irreversible evolution and change through time, which meet the assumption of dissipative structure. Therefore, we can introduce the information entropy to describe its character. When one applies the information entropy to study the system character, it is well known that the dimension should be consistent [4]. In this paper, we select the data of annual investment in the fixed assets to describe the construction scale of energy transportation corridor. Consequently, the dimension uniformity can be satisfied.
Here, we assume that the total amount of species is n in. The index values for every transportation corridor are K 1 , K 2, ••• , Kn , respectively, and the total amount is K = T K i ( i = 1,2, ••• , n ) . Then, the ratio of every K i to total amount K can be written as p 1 , p 2 • •• p n , where pi = K i I K , T p i = 1. Therefore, referring the Shannon formula, we can define the information entropy for the construction scale as,
n
-
5 = —T p. ln pi-. (2)
i = 1
-
C. Definition of information equilibrium indexes
The formula (2) indicates that such a situation. When p 1 = p 2 =•••= p n = 11 n, i.e., when the construction scale of energy transportation corridor is equal to the size, information entropy S gets maximal value 5 max = ln n ; i.e., when there is only transportation mode in the energy transportation corridor system, information entropy S gets minimum value S mm= 0 . Entropy is a measure of the degree of disorder, a large number of microscopic particles in the system. When entropy S gets maximal value, system is the most chaotic; when entropy S gets minimum value, system is the most orderly. In reality, the two limit state will not occur, entropy is usually in between. i.e., the excellent state of dissipative systems should be in between order and chaos. Geng, et al [8]. introduce the information entropy theory to the evolution of energy consumption structure by calculating the equilibrium and dominance degree to measure the energy consumption structure. Therefore, referring the formula about the equilibrium and dominance degree, we can define the equilibrium degree E for the construction scale of the energy transportation corridor as,
n
E=-T p--ln p. Iln n. (3)
i = 1
The formula (3) indicates that the equilibrium degree is equal to the ratio of entropy S and maximum entropy, and
E ∈ [0,1]. We describe the difference between the construction scale of the energy transportation corridor by E. In addition, the higher the balance, the smaller the size difference between the percentage. Dominance degree D is defined as D=1-E [5]. So dominance degree describes the degree of being dominated by the scale of construction about the whole system. In addition, when the dominance degree is lower, the limited extent is smaller.
The entropy methods increase is widely used in thermodynamic statistical physics. Corresponding, there is another famous theorem on the entropy in information theory, i.e., the maximum entropy methods. The entropy can be can be used as a quantitative description for the chaotic state and complexity in the various elements. When the entropy reach its maximum, the richness of element state reach its vertex.
The maximum entropy method is suggested by E.T. Jaynes in 1957 [12]. His main idea is that the standard for selecting the "best" or "most rationality" in a compatible distribution is the information entropy in the state of maximum[13]. According to this methods, when the construction scale of energy transportation corridor achieves its best or its most rationality, the information entropy in this system should correspondingly arrive at its peak. Although this condition noted above belong to ideal state or ultimate goal and it cannot be realized in practice, the maximum entropy methods can also help us to estimate the general direction of the construction scale of energy transportation corridor.
-
III. Energy Transportation Evaluation on Information Entropy for Construction Scale
-
A. Definition of Pi based on annual investment in fixed assets
It is well know that investment in the fixed assets can be effected by the industrial scale. Therefore, when we calculate the information entropy of the investment in the fixed assets, we define pi in the form,
Ki= LJ M . (4)
Where L i represents the annual investment in the fixed assets of transportation corridor, M corresponds to the total investment in the fixed assets in transportation sector. When K i is normalized, the formula for p i is,
n p,= KJ IK,. (5)
i = 1
-
B. Quant tat ve calculat on for nformat on entropy for construct on scale
According to the data of annual investment in the fixed assets in China from 1986 to 2009 and utilizing the formula noted above (2), the information entropy S i for the four kinds of the construction scale can be achieved.
The total amount of Si is the information entropy of the construction scale about the current year, i.e., 5 = I S i ,as shown in table I. Based on the data in table
I, we can draw the change map about the information entropy as shown in Fig. 1.
|
Year |
1986 |
1987 |
1988 |
1989 |
1990 |
1991 |
1992 |
1993 |
1994 |
1995 |
1996 |
1997 |
|
S(en trans) |
1.09399 |
1.04467 |
0.99351 |
1.08247 |
1.01662 |
1.01761 |
1.01703 |
0.93509 |
0.92835 |
0.95436 |
0.92895 |
0.85989 |
|
S(railway) |
0.32843 |
0.32831 |
0.31840 |
0.35802 |
0.33465 |
0.33471 |
0.33469 |
0.31083 |
0.31895 |
0.34314 |
0.35604 |
0.36351 |
|
S(highway) |
0.31277 |
0.33447 |
0.34778 |
0.36076 |
0.35963 |
0.35960 |
0.35967 |
0.35941 |
0.36566 |
0.36676 |
0.35551 |
0.33699 |
|
S(waterway) |
0.33759 |
0.33020 |
0.29872 |
0.34344 |
0.29979 |
0.29986 |
0.29969 |
0.24791 |
0.22348 |
0.21012 |
0.15569 |
0.12585 |
|
S(pipeline) |
0.11520 |
0.05169 |
0.02861 |
0.02026 |
0.02254 |
0.02344 |
0.02299 |
0.01695 |
0.02026 |
0.03434 |
0.06171 |
0.03354 |
|
Year |
1998 |
1999 |
2000 |
2001 |
2002 |
2003 |
2004 |
2005 |
2006 |
2007 |
2008 |
2009 |
|
S(en trans) |
0.78953 |
0.81035 |
0.82149 |
0.82852 |
0.87482 |
0.82806 |
0.76548 |
0.80947 |
0.86021 |
0.88736 |
0.95223 |
0.92920 |
|
S(railway) |
0.36788 |
0.36765 |
0.36679 |
0.36467 |
0.36169 |
0.28992 |
0.27282 |
0.29690 |
0.32586 |
0.34041 |
0.36426 |
0.36750 |
|
S(highway) |
0.30594 |
0.31352 |
0.29739 |
0.29375 |
0.29006 |
0.22775 |
0.20988 |
0.23376 |
0.26151 |
0.27795 |
0.31694 |
0.32606 |
|
S(waterway) |
0.09409 |
0.10141 |
0.10769 |
0.15315 |
0.09700 |
0.20099 |
0.21230 |
0.23169 |
0.23615 |
0.23627 |
0.22212 |
0.21401 |
|
S(pipeline) |
0.02163 |
0.02778 |
0.04961 |
0.01695 |
0.12607 |
0.10941 |
0.07049 |
0.04713 |
0.03670 |
0.03273 |
0.04891 |
0.02163 |
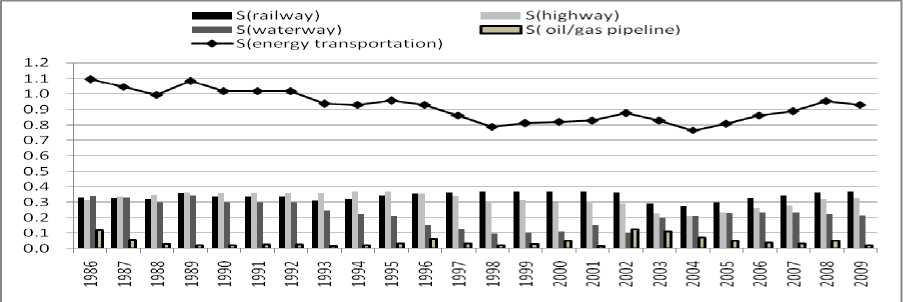
Figure 1. Information entropy S and Si about construction scale of energy transportation corridor (1986-2009)
From 1986 to 2004, the information entropy for the scale construction of energy transportation corridor decreased slowly. The minimum value is 0.76548. After 2004 it began to increase slowly.
The information entropy for the scale of railway and highway construction of energy transportation corridor show similar trends and smaller differences. In 2003, the information entropy value for the scale construction of railway and highway decreased rapidly. But the values still keep increasing after 2003.The scale information entropy for waterway started to decline from 1992 to 2002. In 2003, it leaped rapid increases from 0.097 to 0.20099 and always gets higher value. The scale information entropy for pipeline has been the lowest in the four kinds of the construction scale. The average of the scale information entropy for pipeline always keeps 0.0451. The annual largest increase is 0.109 in 2002. But the value always decreased after 2002. The minimum value only gets 0.017. The average increase of the information entropy is -0.005 form 1986 to2009.
-
C. Quantitative calculation for equilibrium degree and dominance degree for construction scale
We can calculate equilibrium degree and dominance degree, as shown in table II. Based on these data, we can draw the change map about equilibrium degree and dominance degree, as shown in Fig. 2.
|
Year |
1986 |
1987 |
1988 |
1989 |
1990 |
1991 |
1992 |
1993 |
1994 |
1995 |
1996 |
1997 |
|
D |
0.21085 |
0.24643 |
0.28333 |
0.21917 |
0.26666 |
0.26595 |
0.26637 |
0.32548 |
0.33034 |
0.31157 |
0.32991 |
0.37972 |
|
E |
0.78915 |
0.75357 |
0.71667 |
0.78083 |
0.73334 |
0.73405 |
0.73364 |
0.67452 |
0.66966 |
0.68843 |
0.67009 |
0.62028 |
|
Year |
1998 |
1999 |
2000 |
2001 |
2002 |
2003 |
2004 |
2005 |
2006 |
2007 |
2008 |
2009 |
|
D |
0.43047 |
0.41545 |
0.40742 |
0.40235 |
0.36895 |
0.40268 |
0.44782 |
0.41609 |
0.37949 |
0.35990 |
0.31311 |
0.32973 |
|
E |
0.56953 |
0.58455 |
0.59258 |
0.59765 |
0.63105 |
0.59732 |
0.55218 |
0.58391 |
0.62051 |
0.64010 |
0.68689 |
0.67027 |
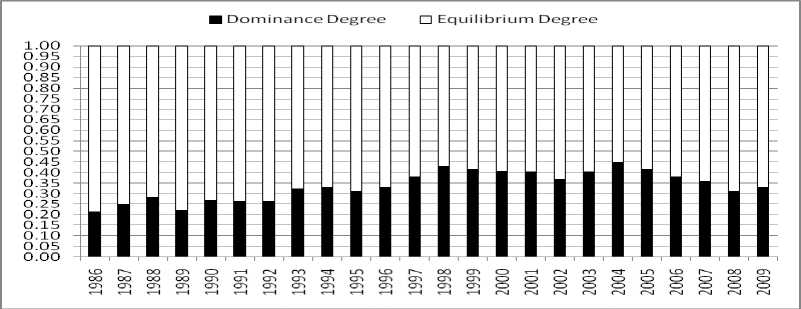
Figure 2. Dominance Degree and Equilibrium Degree about construction scale of energy transportation corridor change maps (1986-2009)
The minimum value of degree of disorder appeared in 2004. It was further verified that the difference of the four kinds of the construction scale was the largest, i.e., the equilibrium degree reached the minimum value and it gets 0.5522. When the dominance reached the maximum value, the degree which the overall scale construction was dominated by a certain scale construction of energy transportation corridor reached the maximum value. The further analysis showed that the scale construction in the highways was main reason. In 2004, the percent of the annual highways investment in the fixed assets get 75.8%. The conclusion is the same as that of the analysis results by annual newly increased production capacity.
-
D. Relationship Analysis of Pi and Si
According to the data of annual investment in the fixed assets in China from 1986 to 2009 and utilizing the formula noted above ( 2 ) , the information entropy Si for the four kinds of the construction scale and the calculation parameters Pi for fixed assets investment can be achieved, as shown from table III to table IV.
|
Year |
1986 |
1987 |
1988 |
1989 |
1990 |
1991 |
1992 |
1993 |
|
S(railway) |
0.32843 |
0.32831 |
0.31840 |
0.35802 |
0.33465 |
0.33471 |
0.33469 |
0.31083 |
|
p(railway) |
0.55098 |
0.55131 |
0.57455 |
0.45625 |
0.53478 |
0.53468 |
0.53483 |
0.59101 |
|
Year |
1994 |
1995 |
1996 |
1997 |
1998 |
1999 |
2000 |
2001 |
|
S(railway) |
0.31895 |
0.34314 |
0.35604 |
0.36351 |
0.36788 |
0.36765 |
0.36679 |
0.36467 |
|
p(railway) |
0.57332 |
0.51079 |
0.46511 |
0.42597 |
0.36931 |
0.38094 |
0.33993 |
0.32037 |
|
Year |
2002 |
2003 |
2004 |
2005 |
2006 |
2007 |
2008 |
2009 |
|
S(railway) |
0.36169 |
0.28992 |
0.27282 |
0.29690 |
0.32586 |
0.34041 |
0.36426 |
0.36750 |
|
p(railway) |
0.30251 |
0.15608 |
0.13753 |
0.16447 |
0.20668 |
0.23521 |
0.31754 |
0.35127 |
|
Year |
1986 |
1987 |
1988 |
1989 |
1990 |
1991 |
1992 |
1993 |
|
S(highway) |
0.31277 |
0.33447 |
0.34778 |
0.36076 |
0.35963 |
0.35960 |
0.35967 |
0.35941 |
|
p(highway) |
0.18586 |
0.22267 |
0.25318 |
0.29792 |
0.29268 |
0.29256 |
0.29288 |
0.29179 |
|
Year |
1994 |
1995 |
1996 |
1997 |
1998 |
1999 |
2000 |
2001 |
|
S(highway) |
0.36566 |
0.36676 |
0.35551 |
0.33699 |
0.30594 |
0.31352 |
0.29739 |
0.29375 |
|
p(highway) |
0.32818 |
0.39690 |
0.46728 |
0.52859 |
0.60117 |
0.58522 |
0.61801 |
0.62501 |
|
Year |
2002 |
2003 |
2004 |
2005 |
2006 |
2007 |
2008 |
2009 |
|
S(highway) |
0.29006 |
0.22775 |
0.20988 |
0.23376 |
0.26151 |
0.27795 |
0.31694 |
0.32606 |
|
p(highway) |
0.63191 |
0.73287 |
0.75820 |
0.72410 |
0.68123 |
0.65358 |
0.57779 |
0.55677 |
|
TABLE V. |
Information Entropy S(waterway) about Scale of Energy Transportation Corridor in China |
|||||||
|
Year |
1986 |
1987 |
1988 |
1989 |
1990 |
1991 |
1992 |
1993 |
|
S(waterway) |
0.33759 |
0.33020 |
0.29872 |
0.34344 |
0.29979 |
0.29986 |
0.29969 |
0.24791 |
|
p(waterway) |
0.22905 |
0.21447 |
0.16677 |
0.24219 |
0.16807 |
0.16819 |
0.16809 |
0.11428 |
|
Year |
1994 |
1995 |
1996 |
1997 |
1998 |
1999 |
2000 |
2001 |
|
S(waterway) |
0.22348 |
0.21012 |
0.15569 |
0.12585 |
0.09409 |
0.10141 |
0.10769 |
0.15315 |
|
p(waterway) |
0.09487 |
0.08538 |
0.05298 |
0.03875 |
0.02566 |
0.02853 |
0.03101 |
0.05173 |
|
Year |
2002 |
2003 |
2004 |
2005 |
2006 |
2007 |
2008 |
2009 |
|
S(waterway) |
0.09700 |
0.20099 |
0.21230 |
0.23169 |
0.23615 |
0.23627 |
0.22212 |
0.21401 |
|
p(waterway) |
0.02676 |
0.07932 |
0.08688 |
0.10110 |
0.10459 |
0.10469 |
0.09387 |
0.08810 |
|
Year |
1986 |
1987 |
1988 |
1989 |
1990 |
1991 |
1992 |
1993 |
|
S(pipeline) |
0.11520 |
0.05169 |
0.02861 |
0.02026 |
0.02254 |
0.02344 |
0.02299 |
0.01695 |
|
p(pipeline) |
0.03411 |
0.01155 |
0.00550 |
0.00364 |
0.00422 |
0.00423 |
0.00420 |
0.00293 |
|
Year |
1994 |
1995 |
1996 |
1997 |
1998 |
1999 |
2000 |
2001 |
|
S(pipeline) |
0.02026 |
0.03434 |
0.06171 |
0.03354 |
0.02163 |
0.02778 |
0.04961 |
0.01695 |
|
p(pipeline) |
0.00363 |
0.00694 |
0.01463 |
0.00670 |
0.00386 |
0.00531 |
0.01105 |
0.00289 |
|
Year |
2002 |
2003 |
2004 |
2005 |
2006 |
2007 |
2008 |
2009 |
|
S(pipeline) |
0.12607 |
0.10941 |
0.07049 |
0.04713 |
0.03670 |
0.03273 |
0.04891 |
0.02163 |
|
p(pipeline) |
0.03882 |
0.03173 |
0.01739 |
0.01033 |
0.00749 |
0.00652 |
0.01080 |
0.00385 |
By comparing the entropy of the four conventional energy transportation corridors, it is found that there are some relations between Si and pi. Tan, et al [5]., believe that p i =0.3 is a base value. In the present work, we further study the formula (2) combined with our data and it is found that the base value is p i =0.3342, i.e., when p i >0.3342, p i decreases with S i , but, when p i <0.3342, p i increases with S i .
To take railway transportation corridor for an example, it is a major way for energy transportation and pays key role in the four kinds of energy transportation corridor.
It can be seen in figure 3 and table III, from 1986 to 2000, the values of p (railway) are all above 0.3342 and p (railway) decrease with S (railway) while in 2001, p (railway) reduces to 0.3204. Until to 2008, there are p (railway) <0.3342 and p (railway) increase with S (railway) . Likewise, the other three energy transportation corridor can be investigated and the same conclusion can be obtained, as shown from figure 4 to figure 6.
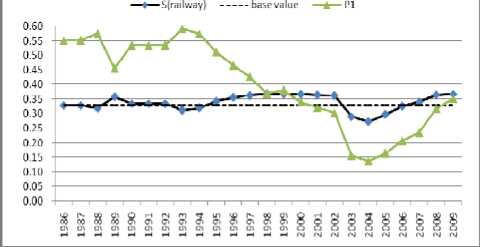
Figure 3. Relation between S(railway) and p(railway) about the scale of road transportation channels (1986-2009)
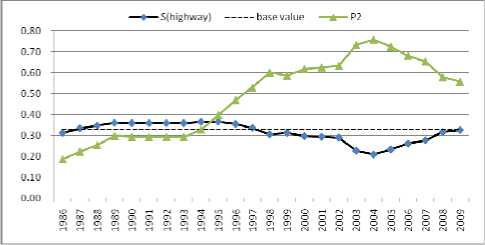
Figure 4. Relation between S(highway) and p(highway) about the scale of road transportation channels (1986-2009)
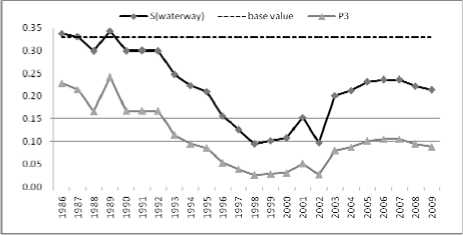
Figure 5. Relation between S(waterway) and p(waterway) about the scale of road transportation channels (1986-2009)
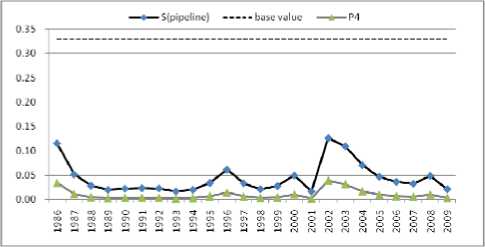
Figure 6. Relation between S(pipeline) and p(pipeline) about the scale of road transportation channels (1986-2009)
-
E. Directions in corridor construction scale
Based on the maximum entropy methods and combined with the value of Si and pi mentioned above, it is found that Si can be increased by control the values of p i and the maximum entropy can be achieved, where the total construction scale in energy transportation come to its "best". According to the calculated date from 1986 to 2009, as shown in table III, it can be summarized as follows,
With regard to rail transportation, between 1986 and 1996, the ratio of annual investment to the total investment is kept above 50% and p(railway) tends to total reduction. In 2001, p(railway) becomes less than 0.3342. In 2004, p(railway) arrive at its minimum value 0.138. After 2004, there is p(railway)<0.3342. If one wants to increase S(railway), one can slightly improve the value of p(railway) below the base value 0.3342.
With regard to the highway, the ratio of the annual investment to the total investment increases year by year. In other words, p(highway) tends to climb up totally. It is noteworthy that this ratio is as high as 75.8% in 2004. The transportation highway corridor is still higher than the other three. Reducing the value p(highway) is helpful to increase the highway entropy.
Regarding waterway, only the six years between 1986 and 1992, the average investment ratio remained at 19%, but, thereafter, from 1993 to 2004, the annual investment ratio did not exceed 10%.The lowest value is only 2.6%. After 2005, this ratio was maintained at 10%, i.e., p(waterway) has never exceeded the baseline value 0.3342. If one wants to increase S(waterway), one should improve p(waterway) in the following years.
Pipeline construction of the four transportation corridor, is always in a low ratio between 1986 and 2009. There are only 3 years the annual investment ratio above 3%, and only 6 years above 1%, while the lowest value is only 0.29 %. It is an effective way to increase the value p(pipeline) to improve the total entropy .
By further analyzing and integrating (4) and (5), it is found that the value of p i is directly controlled by the annual investment in fixed assets for a particular transportation corridor and the total investment in the transportation sector. Therefore, the analysis mentioned above can open the direction for the construction scale of the energy transportation corridor. The direction is the following. First, we should decrease the construction investment in the highway transportation corridor.
Second, we must quicken the construction of the pipeline and waterway transportation corridor. Especially, the pipeline of the construction efforts should be greatly enhanced. On this basis, we should keep to the construction scale of the rail transportation corridor, not a big increase.
-
F. Conclusions
The present work which focuses on the construction scale of energy transportation corridor is based on the assumption that all of the four conventional energy transportation corridors have the property of sufficient substitutability.
In some condition, this assumption can be established. The scope and extent o the substitutability still need further discussion and analysis. With the maximum entropy principle, we can know the conclusion. If we should make the construction scale of the energy transportation corridor achieve "best" or "most rationality" state, we should increase the partial information entropy Si to maintain total entropy at a high level. The above analysis showed that the conclusion. The percent of the scale information entropy for waterway is about half of highway and railway. The percent of the scale information entropy for pipeline is about 13% of highway and railway. The two types partial information entropy was easy to increase, especially pipeline.
Under this assumption, it is found that, in the process of our future energy transportation corridor construction, firstly, we should not let the rail transportation corridor have excessive investment growth, and then secondly transfer some of the highway investment to the transportation corridor of waterway or pipeline, while finally advance the construction step of the pipeline transportation corridor. Respect to the problems of the detailed amplitude ratios on the four corridor, the dedicated energy line construction, and energy conversion transportation, which still need further discussion and analysis, are not investigated here, however, and will be reported elsewhere.
We can increase any partial information entropy to improve the state of energy transportation corridor. This conclusion provides a quantitative basis for measuring the rationality of the scale of construction for the energy transportation corridor. And we can obtain some suggestions on the development strategy emphasis in future.
-
[1] Jun-zhang Xu, Ru-yuan Zhang, “Energy Use,” Energy Press, 1982.
-
[2] Ming-li Pang, “Problem about the Natural Gas Market of China,” The Energy of China (in Chinese) , vol. 144(11), 2001, pp. 17–21.
-
[3] Kang Zhang, “Petroleum Development Strategy in China,” Geological Publishing House, Petroleum Industry Press, China Petrochemical Press, 2002.
-
[4] National Bureau of Statistics of China, China Statistical Yearbook 2009 (in Chinese), Beijing: China Statistics Press, 2009.
-
[5] Yan-guang Chen, Ming-hua Liu, “The Basic Laws of the Shannon Entropy Value of Urban Land-use Composition,” Human Geography (in Chinese) , vol. 16(4), 2001, pp. 20– 24.
-
[6] Bo-xun Dai, Hong-da Shen, “Modern Industry
Economics,” Economy &Management Press, 2001.
-
[7] Ken-hua Zhan, Xiao-feng Wang, “Prigogine and the Dissipation Structure Theory,” Shaanxi Science and Technology Press, 1998.
-
[8] Gen-xiu Han, “Entropy and Its Applications,” Journal of Inner Mongolia Normal University (Educational Science) (in Chinese) , vol. 14, Aug. 2001, pp. 9–11.
-
[9] Yong-zhong Tan, Ci-fang Wu. “The Laws of the Information Entropy Values of Land Use Composition,” Journal of Natural Resourses (in Chinese) , vol. 18, Jan. 2003, pp. 112–117.
-
[10] Hai-qing Geng, Shu-zhong Gu, Dong-mei Guo. “Analyses on Evolution of Household Energy Consumption Structure Based on Information Entropy,” Journal of Natural Resourses (in Chinese) , vol. 19, Mar. 2004, pp. 257–262.
-
[11] Zhi-yong Tian, Si-qiang Wang, “Evolution of Energy Consumption Structure Based on Information Entropy,” Journal of Transportation Systems Engineering and Information Technology (in Chinese) , vol. 9, Feb. 2009, pp. 117–121.
-
[12] E.T. Jaynes. “Information Theory and Statistical Mechanics”. Physical review , vol 106(4), 1957, pp. 620– 630.
-
[13] Kai-rong Zhao, “Complexity: the Mystery of Human Understandings,” China Social Science Press, 2001.
Guang-jun Jiang received the BS and MS degrees in mechanical engineering from the Inner Mongolia University of Technology, Hohhot, in 2003 and 2008, respectively. He is currently working toward the PhD degree in management science at the China University of Mining & Technology at Beijing.
Список литературы Comprehensive Evaluation of Energy Transportation Corridor in China
- Jun-zhang Xu, Ru-yuan Zhang, “Energy Use,” Energy Press, 1982.
- Ming-li Pang, “Problem about the Natural Gas Market of China,” The Energy of China (in Chinese), vol. 144(11), 2001, pp. 17–21.
- Kang Zhang, “Petroleum Development Strategy in China,” Geological Publishing House, Petroleum Industry Press, China Petrochemical Press, 2002.
- National Bureau of Statistics of China, China Statistical Yearbook 2009 (in Chinese), Beijing: China Statistics Press, 2009.
- Yan-guang Chen, Ming-hua Liu, “The Basic Laws of the Shannon Entropy Value of Urban Land-use Composition,” Human Geography (in Chinese), vol. 16(4), 2001, pp. 20–24.
- Bo-xun Dai, Hong-da Shen, “Modern Industry Economics,” Economy &Management Press, 2001.
- Ken-hua Zhan, Xiao-feng Wang, “Prigogine and the Dissipation Structure Theory,” Shaanxi Science and Technology Press, 1998.
- Gen-xiu Han, “Entropy and Its Applications,” Journal of Inner Mongolia Normal University (Educational Science) (in Chinese), vol. 14, Aug. 2001, pp. 9–11.
- Yong-zhong Tan, Ci-fang Wu. “The Laws of the Information Entropy Values of Land Use Composition,” Journal of Natural Resourses (in Chinese), vol. 18, Jan. 2003, pp. 112–117.
- Hai-qing Geng, Shu-zhong Gu, Dong-mei Guo. “Analyses on Evolution of Household Energy Consumption Structure Based on Information Entropy,” Journal of Natural Resourses (in Chinese), vol. 19, Mar. 2004, pp. 257–262.
- Zhi-yong Tian, Si-qiang Wang, “Evolution of Energy Consumption Structure Based on Information Entropy,” Journal of Transportation Systems Engineering and Information Technology (in Chinese), vol. 9, Feb. 2009, pp. 117–121.
- E.T. Jaynes. “Information Theory and Statistical Mechanics”. Physical review, vol 106(4), 1957, pp. 620–630.
- Kai-rong Zhao, “Complexity: the Mystery of Human Understandings,” China Social Science Press, 2001.
