Computer-aided research and analysis of biomechanical indicators in starting acceleration of sprint running

Author: Bachev V., Gadev M., Groshev O., Yordanov P., Zlatev B.
Journal: Человек. Спорт. Медицина @hsm-susu
Section: Спортивная тренировка
Article in issue: 1 т.18, 2018.
Free access
Aim. The aim of this research is to develop objective quantitative criteria to characterize and assess the leading components of a low start in athletic sprint. Materials and Methods. The experiment involved 14 athletes of different qualification, age, height and weight. We registered 42 starts at 30 m. maximum sprint.Using original computer-based testing methodology with a three-dimensional force platform and specialized software, we distinguished 11 strength and time partials, 8 integral strength impulses and 7 complex indicators, characterizing the third step. Results. It was found that among the achievements of a 30 m. and 5 m. max sprint from a low start there is r = 0.96. The Parameter “Effort Time to Maximum Power Value” has a value of r = 0.83. The integral “Impulse of the force in front support” is equal r = -0.40 and the complex “Time criteria - K6” equals 0.81. Conclusions. It is found that a significant criterion for the evaluation of sport technique is the “Time for the whole process of force impact during the third step of the start” while the “average strength during the entire supporting phase of the third step after the start” is notinformative for a micro modeling. For the level of sports performance, the shortest moment of ejection is positive compared to a depreciation phase. Conclusions set out top-level benchmarks criteria and models and outline an objective basis for optimizing performance in athletic sprint.
Computer-aided research, athletic sprint, quantitative criteria
Short address: https://sciup.org/147153400
IDR: 147153400 | UDC: 159.9:796.01, | DOI: 10.14529/hsm180108
Аппаратные исследования и анализ биомеханических показателей стартового ускорения в спринтерском беге
Цель данного исследования - разработать объективные количественные критерии характеристики и оценки эффективности ведущих компонентов низкого старта в атлетическом спринте. Материалы и методы. В эксперименте приняли участие 14 спортсменов различной квалификации, отличающиеся по возрасту, весу и росту. Было зарегистрировано 42 старта в беге на 30 м. Благодаря использованию оригинальной аппаратной методики с трехмерной тензометрической платформой и специализированного программного обеспечения были установлены 11 силовых и временных показателей, 8 интегральных импульсов силы и 7 комплексных показателей, характеризующие третий шаг после старта. Результаты. Установлено, что корреляция между достижениями на 30 и 5 м максимального спринта из низкого старта r = 0,96. Параметр «время усилия до достижения максимальной силы» равен r = 0,83. Интегральный показатель «импульс силы в передней опоре» соответствует значению r = -0,40, а параметр комплексные «временные критерии - K6» равняется r = 0,81. Выводы. Нами было установлено, что важным критерием для оценки спортивной техники выступает «период воздействия силы во время третьего шага после старта», в то время как критерий «средняя мощность в течение всего этапа, сопровождающего третий шаг после старта» и «средняя сила на протяжении всего этапа, сопровождающего третий шаг после старта» не являются информативными для моделирования на микроуровне. Положительное влияние на уровень спортивной техники оказывает более короткий момент отталкивания по сравнению с фазой амортизации. В статье были изложены критерии и модели, а также представлена объективная основа для улучшения показателей в спринтерском беге.
Text of the scientific article Computer-aided research and analysis of biomechanical indicators in starting acceleration of sprint running
There are many analyzes of sport technique in sprint running in available scientific and methodical literature. In this sense, the works of L. Stoner et al. (1979) [27], M. Gadev (1997; 1998) [17, 18], A. Slavtchev (2006) [25], M. Coh, et al. (2007) [10], M. Bracic (2010) [8], J. Slawinski et al. (2012) [26], D. Dimitrov (1988, 2002, 2004, 2013) [11–14, 16], V. Bachev et al. (2014) [5, 6], M. Gadev et al. (2014) [19], M. Ga-dev (2015) [20], D. Dimitrov, Hr. Stoyanov (2017) [15] should be mentioned. It is also necessary to enlarge the list with recently published results and conclusions of the authors of this paper. Mostly, they all deal with the issue of quantitative determination of partial indicators and, to a lesser extent, of integral ones. All of this determined the direction and purpose of our research [9].
The purpose of this research is to reveal and define objective parameters and quantitative criteria to estimate the effectiveness of sport technique in the implementation of starting acceleration in sprint running.
Materials and Methods
One of the main factors of sports achievements in a 100-meter running is starting acceleration, which is to be tested through a sports and pedagogical test and 30-meter running from a crouch start position. In the studies of V. Ba-chev et al. (2014) [5] and M. Gadev et al. (2014) [19], a correlation coefficient (r = 0.96) was found between the achievements in the tests of 30 m and 5 m running from a crouch start. This allows us to assert that the research of the third step (5 m after the start) provides reliable information in terms of the analysis of starting acceleration technique in the sprint running. We performed time recording with a photoelectric system. Measurements of the reaction forces of the support are carried out with the help of a complex instrumental system (Fig. 1): a three-dimensional tensometric platform (overall dimensions – 1000/500/200 mm; weight – 90 kg; measuring ranges: axis X – 4000 N; axis Y – 1000 N; axis Z – 4000 N), multi-channel amplifier, cable and telemetry connection kit, analog-digital converter,
computer, monitor, external print device, and specialized software – “Record 5” program [2, 3].
The changes of 11 force and time parameters named as partial indicatorsare measured in three coordinates – х, y and z. 7 different impulses of force are defined as complex indicators and 8 specific indices and criteria are characterized as integral indicators [4, 7]. Through them objective quantitative evaluation criteria of sport technique during the start and starting acceleration in sprint running are defined [21, 24, 28, 30]. The indica-
tors included in first two groups are listed in T a ble 1.
The selection of these indicators is based on the authors’ research [1, 5, 19, 23, 29], in which w e established high values of correlation coeffici e nts with sporting achievement – “time from force application to maximum force v alue” (r = = 0 .83), “amortization force impulse” (R = –0.40).
14 athletes – sprinters of high and medium qualification (Table 2) a r e involved in the test. 42 executions of crouch st a rt are registered.
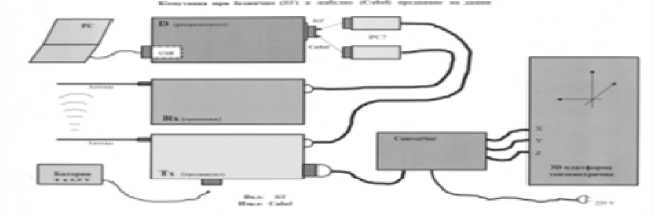
Fig. 1. Block diagram of the instrumental system applied in the research
Table 1
Tested indicators of the third-step after the start
|
Indicators |
|
|
Partial (Units of measurement are according to SI, – N; S) |
F max1 – maximum force of front support; F max2 – maximum for c e at the time of the vertical; F max3 – maximum take-off force; Т 1 – Т to F max1 –time from the start o f action to the moment of reaching F max1 ; Т 2 – Т to F max2 time from the start of action to the moment of reaching F max2 ; Т 3 – Т to F max3 –time from the start of action to the moment of reaching Fmax3; Т4 – time after the m oment of reaching Fmax2 to the end of the entire action, i.e. the moment of complete take off of the foot from the tensometric platform;Т5 – time from the start of action to the time of its end; F mean1 – mean force to fr o nt support; F mean2 – mean force at the time of the vertical; F mean3 – mea n take-off force; F mean4 – mean force after the moment of reaching F max2 to the end of the entire action, i.e. the moment of complete take off of the foot from the tensometric platform; F mean5 – mean force from the start of action to the moment of its end |
|
Complex (Units of measurement are according to SI I = F mean Т – N/S) |
IF 1 – amortization force impulse; I = F mean1 . Т 1 ; IF 2 – force i m pulse at the time of the vertical; I = F mean2 . Т 2 ; IF 3 – take-off force impulse; I = F mean3 . Т 3 ; IF 4 – fo r ce impulse after the moment of reaching F max2 to the end of the entire action, i.e. the moment of complete take off of the foot from the tensometric platform; I F 5 – force impulse from the moment of the start of action to the end of the entire action, i.e. the moment of complete take off of the foot from the te n sometric platform |
Table 2
Achievements characterizing speed capabilities of tested athletes at the start
|
Test |
Range |
Minimum |
Maximum |
Mean |
Std. Deviation |
Skewness |
Kurtosis |
V % |
|||
|
Statistic |
Statistic |
Statistic |
Statistic |
Std. Error |
Statistic |
Statistic |
Std. Error |
Statistic |
Std. Error |
||
|
30 start |
2,12 |
4,10 |
6,22 |
4,50 |
0,15 |
0,59 |
2,13 |
0,56 |
4,16 |
1,09 |
13,9 |
|
30 m flying start |
2,09 |
3,30 |
5,39 |
3,72 |
0,16 |
0,64 |
1,84 |
0,56 |
2,47 |
1,09 |
17,1 |
|
5 m start |
0,21 |
1,12 |
1,33 |
1,23 |
0,02 |
0,08 |
–0,28 |
0,56 |
–2,05 |
1,09 |
6,7 |
|
5 m flying start |
0,29 |
0,63 |
0,92 |
0,69 |
0,02 |
0,08 |
1,71 |
0,56 |
2,68 |
1,09 |
11,6 |
The data obtained are statistically processed with the help of SPSS 19 and Microsoft Excel 2010 programs.
Results
The results of the variance analysis for partial and integral indicators are summarized in
Tables 3, 4. Figs. 2, 3 and 4 present actual data from tests of 2 high-qualified athletes identified for ethical reasons with the initials “A” and “B”. Relationships resulting in respective correlation coefficients between partial and integral indicators are integrated in Table 5 and Table 6.
Тable 3
Values of partial indicators characterizing the speed capabilities of athletes at the start
|
Index |
Range |
Minimum |
Maximum |
Mean |
Std. Deviation |
Skewness |
Kurtosis |
V % |
|||
|
Statistic |
Statistic |
Statistic |
Statistic |
Std. Error |
Statistic |
Statistic |
Std. Error |
Statistic |
Std. Error |
||
|
max1 |
598,5 |
488,9 |
1087,4 |
699,9 |
40,2 |
160,9 |
1,1 |
0,6 |
1,2 |
1 |
22,9 |
|
F max2 |
493,8 |
298,2 |
792 |
582,5 |
28,9 |
115,6 |
–0,8 |
0,6 |
1,7 |
1 |
19,8 |
|
max3 |
458,7 |
537,30 |
996 |
695,9 |
35,3 |
141,3 |
1,2 |
0,6 |
0,9 |
1 |
20,3 |
|
t1 |
0,06 |
0,01 |
0,07 |
0,03 |
0,003 |
0,01 |
1,5 |
0,6 |
3,5 |
1 |
46,2 |
|
t2 |
0,06 |
0,03 |
0,09 |
0,04 |
0,003 |
0,02 |
1,7 |
0,6 |
4 |
1 |
35,7 |
|
t3 |
0,09 |
0,04 |
0,13 |
0,07 |
0,005 |
0,02 |
1,9 |
0,6 |
4,7 |
1 |
30,2 |
|
t4 |
0,06 |
0,04 |
0,1 |
0,07 |
0,004 |
0,02 |
–0,5 |
0,6 |
–0,2 |
1 |
21,9 |
|
t5 |
0,15 |
0,09 |
0,24 |
0,15 |
0,008 |
0,03 |
1,6 |
0,6 |
5,7 |
1 |
21,6 |
|
Fx1 |
445 |
281 |
726 |
490,9 |
32,8 |
131,5 |
–0,3 |
0,6 |
–0,5 |
1 |
26,8 |
|
Fx2 |
450,3 |
417,5 |
867 |
573 |
30,6 |
122,5 |
0,6 |
0,6 |
0,6 |
1 |
21,4 |
|
Fx3 |
395,2 |
438,8 |
834 |
624,9 |
24,8 |
99,6 |
–0,02 |
0,6 |
0,4 |
1 |
15,9 |
|
Fx4 |
252,7 |
325,8 |
578,6 |
444,3 |
20,9 |
83,9 |
0,2 |
0,6 |
–1,1 |
1 |
18,9 |
|
Fx5 |
280,0 |
342 |
622 |
457,9 |
24,2 |
96,9 |
0,6 |
0,6 |
–0,8 |
1 |
21,2 |
Тable 4
Values of integral indicators characterizing the speed capabilities of athletes at the start
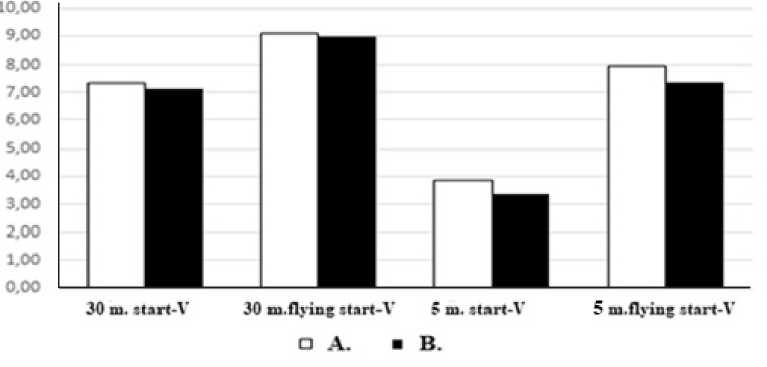
Fig. 2. Achievements characterizing the speed capabilities of 2 high-qualified athletes
|
Index |
Range |
Minimum |
Maximum |
Mean |
Std. Deviation |
Skewness |
Kurtosis |
V % |
|||
|
Statistic |
Statistic |
Statistic |
Statistic |
Std. Error |
Statistic |
Statistic |
Std. Error |
Statistic |
Std. Error |
||
|
IF1 |
36,5 |
5,3 |
41,8 |
15,1 |
2,3 |
9,2 |
1,6 |
0,6 |
3,9 |
1,091 |
61,1 |
|
IF2 |
50,3 |
10,4 |
60,7 |
25,8 |
3,1 |
12,5 |
1,3 |
0,6 |
3 |
1,091 |
48,5 |
|
IF3 |
62,1 |
30,1 |
92,1 |
43,8 |
3,9 |
15,6 |
2,3 |
0,6 |
5,9 |
1,091 |
35,5 |
|
IF4 |
34,2 |
18,7 |
52,9 |
33,1 |
2,8 |
11,2 |
0,7 |
0,6 |
–0,4 |
1,091 |
33,9 |
|
IF5 |
102,8 |
43,9 |
146,8 |
66,3 |
6 |
24 |
2,7 |
0,6 |
9,1 |
1,091 |
36,2 |
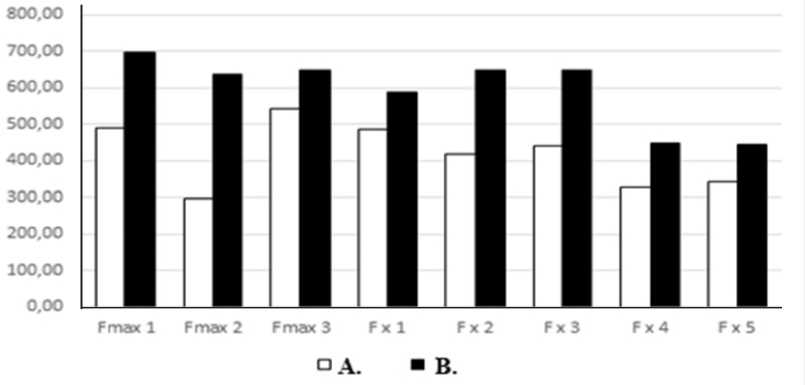
Fig. 3. Values of partial indicators characterizing the speed capabilities of 2 high-qualified athletes
DA. ■ В.
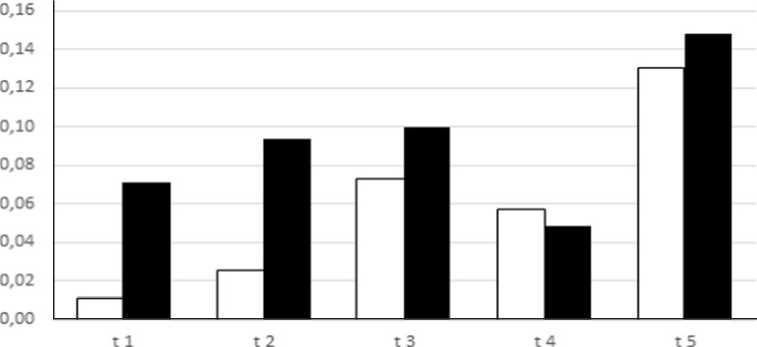
Fig. 4. Time intervals of 2 high-qualified athletes
Тable 5
Correlation analysis – partial indicators
|
Index |
г 1 max1 |
max2 |
F max3 |
T 1 |
T 2 |
T 3 |
T 4 |
T 5 |
F x1 |
F x2 J |
F x3 J |
F x4 |
F x5 |
|
|
Fmax1 |
1 |
0,678 |
0,268 |
–0,021 |
0,165 |
–0,215 |
–0,503 |
–0,347 |
0,205 |
0,87 |
0 |
0,760 |
0,326 |
0,566 |
|
max2 |
0,678 |
1 |
0,600 |
0,277 |
0,250 |
–0,225 |
–0,268 |
–0,292 |
–0,093 |
0,70 |
5 |
0,903 |
0,717 |
0,622 |
|
max3 |
0,268 |
0,600 |
1 |
–0,203 |
–0,295 |
–0,180 |
0,137 |
–0,045 |
–0,472 |
0,080 |
0,659 |
0,887 |
0,145 |
|
|
T 1 |
–0,021 |
0,277 |
–0,203 |
1 |
0,872 |
0,305 |
–0,157 |
0,097 |
0,254 |
0,179 |
0,045 |
–0 , 069 |
0,110 |
|
|
T 2 |
0,165 |
0,250 |
–0,295 |
0,872 |
1 |
0,459 |
–0,381 |
0,109 |
0,395 |
0,380 |
0,115 |
–0 , 095 |
0,246 |
|
|
T 3 |
–0,215 |
–0,225 |
–0,180 |
0,305 |
0,459 |
1 |
0,284 |
0,109 |
0,346 |
0,029 |
–0,024 |
0,089 |
0,260 |
|
|
T 4 |
–0,503 |
–0,268 |
0,137 |
–0,157 |
–0,381 |
0,284 |
1 |
0,710 |
–0,092 |
–0,520 |
–0,214 |
0,108 |
–0,142 |
|
|
T 5 |
–0,347 |
–0,292 |
–0,045 |
0,097 |
0,109 |
0,109 |
0,710 |
1 |
0,134 |
–0,221 |
–0,101 |
0,104 |
0,076 |
|
|
F x1 |
0,205 |
–0,093 |
–0,472 |
0,254 |
0,395 |
0,346 |
–0,092 |
0,134 |
1 |
0,309 |
–0,055 |
–0 , 221 |
0,388 |
|
|
F x2 |
0,870 |
0,705 |
0,080 |
0,179 |
0,380 |
0,029 |
–0,520 |
–0,221 |
0,309 |
1 |
0,787 |
0,331 |
0,814 |
|
|
F x3 |
0,760 |
0,903 |
0,659 |
0,045 |
0,115 |
–0,024 |
–0,214 |
–0,101 |
–0,055 |
0,787 |
1 1 |
0,815 |
0,731 |
|
|
F x4 |
0,326 |
0,717 |
0,887 |
–0,069 |
–0,095 |
0,089 |
0,108 |
0,104 |
–0,221 |
0,331 |
0,815 |
1 |
0,517 |
|
|
F x5 |
0,566 |
0,622 |
0,145 |
0,110 |
0,246 |
0,260 |
–0,142 |
0,076 |
0,388 |
0,814 |
0,731 |
0,517 |
1 |
|
Тable 6
Correlation analysis – partial indicators to integrated indicators
|
Index |
1 max1 |
max2 |
F max3 max3 |
T 1J |
T2 J |
T 3 |
T 4 |
T 5 |
F x1 |
F x2 |
F x3 |
F x4 |
F x5 |
|
IF1 |
0,076 |
0,225 |
–0,274 |
0,923 |
0,925 |
0,482 |
–0,198 |
0,186 |
0,547 |
0,300 |
0,083 |
–0,044 |
0,289 |
|
IF2 |
0,432 |
0,422 |
–0,187 |
0,786 |
0,942 |
0,431 |
–0,456 |
0,075 |
0,421 |
0,630 |
0,361 |
0,045 |
0,440 |
|
IF3 |
0,121 |
0,140 |
0,081 |
0,291 |
0,458 |
0,916 |
0,208 |
0,773 |
0,320 |
0,340 |
0,369 |
0,388 |
0,525 |
|
IF4 |
–0,174 |
0,196 |
0,661 |
–0,178 |
–0,341 |
0,302 |
0,785 |
0,627 |
–0,270 |
–0,214 |
0,319 |
0,679 |
0,151 |
|
IF5 |
0,055 |
0,116 |
0,020 |
0,131 |
0,220 |
0,801 |
0,447 |
0,791 |
0,357 |
0,307 |
0,329 |
0,363 |
0,664 |
Discussion
The first group of analyzes relates to the shown quantitative values of partial indicators in Table 3.
Measured values of force reaction – maximum force in the amortization phase of ground reaction (F max1 ) – are within the range of 488 N to 1087.4 N, which can be considered as a wide range. There are individual differences in this component essential for the technique of sprint start component. Differences are also established with respect to the quantitative values of two other partial force parameters – maximum force at the time of the vertical (minimum value F max2 – 298,2 N, maximum value – 792 N) and maximum take-off force (minimum value – F max3 – 537,3N, maximum value – 996 N).
Comparisons with the data published by D. Dimitrov, Hr. Stoyanov [15], A. Mero et al. [22] show that these are high values forming a model for the comparative analysis in the athletes of different qualification. Objectively, it can be argued that force values within 700–900 N range in the amortization and take-off phases are arguments for a positive evaluation of sport technique at the start.
Time intervals for these efforts are also significant for the evaluation of sport technique. They vary in the range of 0.01 to 0.07 s with respect to the time from the start of action to the moment of reaching F max1 (Т 1 ) and from 0.09 to 0.24 s for the entire duration of the ground period (Т 5 ). Obviously, it can be argued that the speedforce realization of explosive nature at smaller values is more efficient and sport technique is better. In other words, lower values lead to the improvement of sport performance. The data obtained allow us to assume that the explosive nature of muscle effort at start and starting acceleration may be perceived as an objective criterion for technique evaluation at this part of the distance.
Sports and pedagogical analysis of the data shows that the process from a take-off moment (Т4) compared to the amortization phase of the ground reaction (Т1) is shorter. This is a positive evaluation of a sport technique level, which affects directly the achievement of a better sport performance. In our research, they range from 0.04–0.10 s at (Т4) and from 0.01 to 0.07 s at (Т1), which reveals a significant reserve to improve the technique of the athletes tested.
The analyzes of the quantitative values of IF1, IF2, IF3, IF4, IF5 summarized in Table 4 indicate that higher values, respectively speedforce muscle capacities already realized at the start, are also a positive indicator for a better sport technique.
Specifically, IF3 (impulse of take-off force) values are 62.1 N/S on average at a range of 30.1 N/S – 92.1 N/S , IF4 (impulse of force after the moment of reaching F max2 until the end of the entire action) values are 33.1 N/S on average at a minimum of 18.7 N/S and a maximum of 52.9 N/S , and IF5 (impulse of force from the start of action to the point of its end, i.e. the moment of complete take off of the foot from the tenso-metricplatform) values are 66.3 N/S on average at a range of 43.9 N/S to 146.8 N/S.
For IF5, the above statement is true only when the corresponding values of IF 1 – impulse of amortization force – and IF 3 are high that characterizes the explosive nature of a muscle power realization. In the absence of such a characteristic, a high IF 5 value is the diametrical evaluation of the sport technique.
On an individual basis, the data of two unintentionally selected competitors from the group studied are shown in Fig. 2, 3 and 4.
Comparative evaluations regarding the level of their sport and technical performance at starts can be respectively – excellent for the competitor “A” and low for the competitor “B”. The first achieves higher speed abilities with considerably lower measured values of partial force indicators at lower periods. It can be argued that his/her sport technique is undoubtedly better as he/she manages to realize his/her force potential at a shorter time interval in adequately more effec- tive technique in terms of physical capacity that characterizes the starting acceleration.
The recommendation for the competitor “B” is to include a targeted training for a sport technique improvement in the training process.
The analyzes of correlation coefficients in Table 5 and Table 6 also form indicators for the sport technique evaluation. The following indicators received a positive and correspondingly high evaluation: integrated force increases the maximum force in the amortization phase and at the time of the vertical (F max1 ) (r = 0,678); mean force at the time of the vertical (r = 0,870); mean takeoff force (r = 0,760); mean force from the beginning to the end of the third step0,566. In the same direction are the significant values of the correlation coefficients between F max1 and the time after reaching the maximum vertical force (r = –0,503) and the time to complete the entire third step (r = –0,347).
The established facts are complemented by the results of our above-cited studies, where the partial conclusion is that the mean force during the entire ground phase of third step after the start – Fx5 – is an indicator that cannot be taken into account in the micro modeling of sport technique only with quantitative value. As already mentioned, not the high value of force impacts but their explosive character at the start is of primary importance.
The analyzes of correlation coefficients in Table 6 confirm and complement the conclusions made. In this sense, a high correlation value (r = 0.925) between the IF1 – impulse of amortization force – and t2 shows that a decrease in a duration of this part will also help to reduce values of the impulse of force. In other words, the loss of speed in the amortization phase will also be reduced. Alternatively, we can claim that this is an integral indicator allowing objectivity in the evaluation of starting acceleration technique.
At the same time, it should be noted that regarding a differentiated correlation coefficient (r = 0,801) between IF5 and t3 – the time to reach the maximum take-off force, it is reasonable to assume that there is a high level of consistency between the maximum effort and effective period for its implementation when executing the starting acceleration.
Conclusion
-
1. Our research confirms that the explosive nature of muscle effort during the start is an objective criterion for sport technique evaluation in
-
2. Partial time indicators that characterize a take-off process duration compared to the amortization phase are found to be shorter, and it is a positive indicator of a sport technique level at start-up, which affects directly the achievement of a better sport performance.
-
3. According to the changes in the integrated indicators examined we formed individual evaluation criteria for the assessment of a sport technique level. The evaluation of high impulse values of the applied force during the entire duration of the third step after the start signal is positive only at respectively high values of the impulses of amortization and take-off force. The evaluation is diametrical in the absence of such characteristics.
athletic sprint. An increase in integrated power of the maximum force in the amortization phase and the maximum force at the time of the vertical are a positive indicator of their status, as input maximum power values for highly qualified male sprinters need to be in a quantitative range 700 N – 900 N.
References Computer-aided research and analysis of biomechanical indicators in starting acceleration of sprint running
- Arakelyan E., Primakov Yu., Umarov A., Tyupa V. Vertical Mechanical Working in the Aspect of Running Technique Estimation//Journal Theory and practice of physical culture, 1998, vol. 2, pp. 46-48.
- Bachev V. Osnovi na Nauchnite Izsledvaniyata v Sporta. Fundamentals of Scientific Research in Sport. Sofia, BPS Publ., 2017. 309 p.
- Bachev V., Stoyanov H., Dimitrov D., Hristov O., Zlatev B. Changes in Biomechanics of Sprint Jogging Depending on the Radius of the Curve//Journal of Sport Sciences, 2017, vol. 1, pp. 56-61.
- Bachev V., Yordanov P., Groshev O. Criteria for Determining the Correctness of Various Methods for Research Through Motion Testing. Metrology and Metrological Assurance// XXIII National Scientific Symposium with International Participation, Sozopol, Bulgaria, 2013, pp. 293-298.
- Bachev V., Gadev M., Arakchisy Z., Traykova Bl., O. Groshev O., Yordanov P., Tatsov A. On the Ambiguity of the Digitalized Recordings of Dynamic Actions in Sport. Metrology and Metrological Assurance//XXIV National Scientific Symposium with International Participation, Sozopol, Bulgaria, 2014, pp. 329-333.
- Bachev V., Gadev M., Groshev O., Yordanov P. Metrological Aspects of Research Associated with Partial Evaluation Criteria of Sports Equipment in Sports with Speed-Power Manifestation//Journal Activities in Physical Education and Sport, 2014, vol. 2, pp. 191-193.
- Beletsky V. Dvunogaya hodyba: modelynaye zadach i dinamiki i upravleniya . Moscow, Nauca Publ., 1984. 288 p.
- Bracic М., Supej M., Peharec S., Bacic P., Coh M. (2010) An Investigation of the Influence of Bilateral Deficit on the Counter-Movement Jump Performance in Elite Sprinters//Journal Kinesiology, 2010,vol. 1, pp. 73-81.
- Churchill S., Salo A., Trewartha G. The Effect of the Bend on the Technique and Performance During Maximal Speed Sprinting//Journal of Sport Sciences, 2011, vol. 2, pp. 471-474.
- Čoh M., Peharec S., Bačić P., Polyclinic P. The Sprint Start Biomechanical Кinematic, Dynamic and Eletromyographic Parameters//Journal New studies in athletics, 2007, vol. 22, pp. 29-38.
- Dimitrov D. Biomechanical Performance of Running at Maximum Speed//Journal Sport and Science, 2004, vol. 1, pp. 131-140.
- Dimitrov D. Biomechanical Starts Acceleration Indicators//Journal Athletics and Science, 2004, vol. 1, pp. 3-10.
- Dimitrov D. . National Sports Academy . Sofia, 2002. 280 p.
- Dimitrov D. Biomehanichni pokazateli na starta i startovoto uskorenie v sprint ovite byaganiya . Sofia, Krisans Publ., 2013. 130 p.
- Dimitrov D., Stoyanov H. Biomehanichen analiz na sprintovo tobyagane . Sofia, Tip-Top Publ., 2017. 151 p.
- Dimitrov D., Zhukov I. Cinematic, Dynamic and Energy Performance Criteria for Sprint Running//Journal Coaching Thought, 1988, vol. 5, pp. 46-52.
- Gadev M. Kinematic Characteristic of the Maximal Speed Factor in Low-Qualified Sprinters. Journal Sport and Science, 1997, vol. 4, pp. 38-42.
- Gadev M. Kinematic Characteristic of the Maximum Speed Factor in Highly Qualified Sprinters//Journal Sport and Science, 1998, vol. 3, pp. 24-29.
- Gadev M., Naumovsky A., Milanova S., Ivanova G., Niagin P., Groshev O., Yordanov P. A Quantitative Approach for Studying the Sport Technique in Sprint Running.Metrology and Metrological Assurance//XXIV National Scientific Symposium with International Participation, Sozopol, Bulgaria. 2014, pp. 334-341.
- Gadev M., Tehnika na Gladkoto Sprintovo Byagane . Sofia, Bolid Ins Publ., 2015. 176 p.
- Harland М., Steela J. Biomechanics of the Sprint Start//Journal Sports Medicine, 1997, vol. 23, pp. 11-20.
- Mero A., Komi P., Gregor J. Biomechanics of Sprint Running//Journal Sport Medicine, 1992, vol. 13, pp. 376-381.
- Saculin N. Analysis of Sports Techniques//Journal Theory and Practice of Physical Culture, 1996, vol. 12, pp. 78-86.
- Schot P., Knutzen K. A Biomechanical Analysis of Four Sprint Start Positions//Journal Research quarterly for exercise and sport, 1992, vol. 63, pp. 137-147.
- Slavchev A., Niskiyat Start . Sofia, NSA Publ., 2006. 76 p.
- Slawinski J., Dumas R., Cheze L., Ontanon G., Miller C., Mazure-Bunnefoy A. 3D Kinematik of Bunched, Medium and Elongated Sprint Start//Journal Sports Medicine, 2012, vol. 33, pp. 555-560.
- Stoner L., Ben-Sira D. Sprinting on the Curve//Journal Terauds& G.G. Dale (Eds.), Science in Athletics, 1979, pp. 167-173.
- Tyupa V. On the Mechanism of Interaction of Sprinters with a Support//Journal Theory and Practice of Physical Culture, 1978, vol. 6, pp. 32-39.
- Zhukov I., Priluckit B., Rapcin L. Criteria for Effective Techniques Sprinter's Run//Journal Theory and Practice of Physical Culture, 1983, vol. 9, pp. 15-23.
- Zhukov I., Shabanov B. The Effectiveness of Using Facilitating Leadership in the Preparation of Sprinters//Journal Theory and Practice of Physical Culture, 1983, vol. 7, pp. 9-15.
