Content Based Image Recognition by Information Fusion with Multiview Features

Author: Rik Das, Sudeep Thepade, Saurav Ghosh
Journal: International Journal of Information Technology and Computer Science(IJITCS) @ijitcs
Article in issue: 10 Vol. 7, 2015.
Free access
Substantial research interest has been observed in the field of object recognition as a vital component for modern intelligent systems. Content based image classification and retrieval have been considered as two popular techniques for identifying the object of interest. Feature extraction has played the pivotal role towards successful implementation of the aforesaid techniques. The paper has presented two novel techniques of feature extraction from diverse image categories both in spatial domain and in frequency domain. The multi view features from the image categories were evaluated for classification and retrieval performances by means of a fusion based recognition architecture. The experimentation was carried out with four different popular public datasets. The proposed fusion framework has exhibited an average increase of 24.71% and 20.78% in precision rates for classification and retrieval respectively, when compared to state-of-the art techniques. The experimental findings were validated with a paired t test for statistical significance.
Local Threshold, Partial DCT coefficient, KNN Classifier, Fusion based Recognition, t test
Short address: https://sciup.org/15012391
IDR: 15012391
Text of the scientific article Content Based Image Recognition by Information Fusion with Multiview Features
Published Online September 2015 in MECS DOI: 10.5815/ijitcs.2015.10.08
Content based feature extraction has become an active area of research in the last few decades with proliferation of digital images from various image capturing sources and the internet [1, 40, 41]. Extraction of meaningful information from image content has been well perceived in spatial domain and in frequency domain [2]. Spatial domain techniques have considered binarization of images as a popular method for feature extraction [3, 4, 42, 43, 44, 45]. In the frequency domain, discrete cosine transform has proved to be an efficient tool to extract features from transformed images [5, 6]. Partial coefficient selection from transformed images has shown considerable improvement in retrieval results in the past
-
[7] . Consequently, the process of content based feature extraction from images can be aimed for better description of the input data to facilitate image classification and retrieval with lesser computation load [8]. However, it has been observed that traditional feature extraction algorithms take out large size of feature set which scales up the space complexity and increases the training time [9, 10, 11]. In this paper, the authors have proposed two novel feature extraction techniques namely feature extraction by image binarization by applying Sauvola's local threshold selection technique and feature extraction by customized Discrete Cosine Transform (DCT). At the outset, the proposed techniques of feature extraction were evaluated for classification performances with Wang dataset (1000 images), Corel dataset (10,800 images), Caltech dataset (8,127 images) and OT Scene dataset (2,688 images). The authors have further proposed a fusion framework for content based image classification which has outclassed the existing techniques and has shown statistical significance in boosting up the content based image identification process. Subsequently, a retrieval process with focused query has been formulated which has outperformed the contemporary techniques of content based image retrieval.
-
II. Related Work
Existing methods for feature extraction using binarization have been divided into three different techniques of threshold selection namely mean threshold selection, local threshold selection and global threshold selection. Extraction of features from bit planes and even and odd image varieties has been performed by mean threshold selection for better classification results [12, 13]. Feature extraction using ternary mean threshold [14] and multilevel mean threshold [15] for binarization has also considered mean value of the grey levels for selecting the threshold for binarization. But the spread of data was not considered for threshold selection process in the aforesaid techniques. Traditional Otsu's method of global threshold selection [16, 17] was based on image variance. Local threshold selection techniques [18, 19, 20, 21, 22, 23, 24] have considered image variance and contrast as factors for image binarization. But the image recognition process was slowed down due to hefty feature vector size generated by the majority of the aforesaid procedures. Image retrieval with partial transform coefficient was successfully implemented for improved content based image identification [25, 26]. In [27], Genetic Algorithm was exploited to obtain the most favourable boundaries of the numerical intervals, and to decrease the space complexity of features used for image identification. In [28], local descriptors of color and texture were calculated from the color moments and moments on Gabor filter responses to facilitate retrieval. In [29], visually significant point features were chosen as image features, which were identified by a fuzzy set theoretic approach for image recognition. In [30], retrieval accuracy was improved by combining color layout descriptor and Gabor texture descriptor. In [31], feature vectors were constructed from color, texture and spatial structure descriptors. In [32], neural network architecture was proposed for content based image identification. Wavelet packets and Eigen values of Gabor filters were used as feature extraction techniques. In [33], a method was proposed based on intra-class and inter-class features. In [34], a modified color motif cooccurrence matrix (MCMCM) was proposed for contentbased image retrieval. In [35], the Edge Histogram Descriptor (EHD) and Angular Radial Transform (ART) features were resourcefully deployed for signature generation from images for image retrieval in hybrid environment. The proposed architecture has outclassed the existing techniques discussed in this literature and has revealed noteworthy enhancement in content based image recognition.
-
III. Proposed Methodologies
-
3.1 Generation of Odd Images
The proposed methodologies were divided into two different domains namely spatial domain and frequency domain. The feature extraction process with each of the techniques has been enlisted in the following subsections.
A generic image was flipped horizontally across X and Y axis. The Odd Image was created by subtracting the flipped image from the generic Image as given in equation 1.
(Im - Im) Im odd =------- 2
where, Im denoted generic image and I m denoted the flipped image
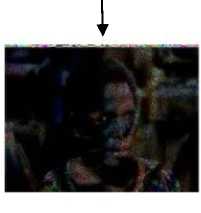
The flipped version of the same image was used in order to explore the option of extracting more information from the same given data. Creation of odd image by subtraction of the flipped image from the main image was aimed at highlighting the foreground of the image by diminishing the background. The odd image variety has been given in fig. 1.
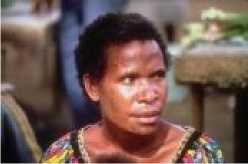
Generic Image
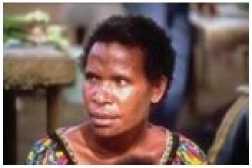
Flipped Image
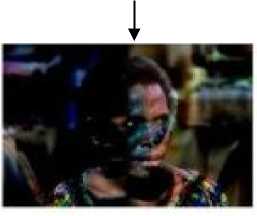
Generic - Flipped (Odd)
Fig.1. Odd Images
-
3.2 Selection of Bit Planes
Bit plane slicing has been considered as an effective method to understand the contribution of each bit in the formation of a digital image. Eight different bit planes were extracted from the combination of generic and odd image variety, starting from the least significant bit to the most significant bit. Intensity value of each pixel was represented by an 8 bit binary vector as shown in Fig. 2 and the bit planes were expressed as in equation 2.
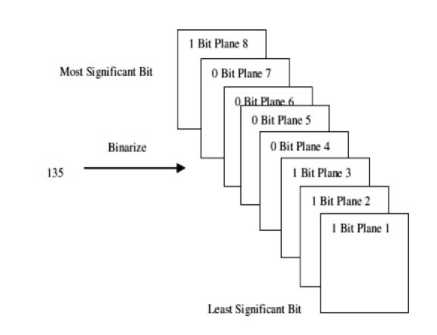
Fig.2. Binarized to 8 bit vector
Ibitplane ( i , j ) = Re m { floor [ i I ( i , j )]}
I(i,j) has represented the original fused image, remainder has been denoted by Rem and floor(I) stands for rounding the elements to I nearest integers less than or equal to I .
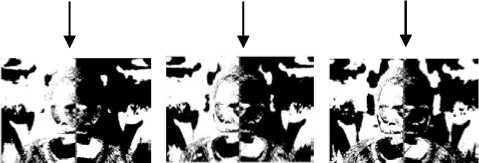
Each bit plane was signified by a binary matrix which was further utilized to produce image slices for corresponding bit planes as in fig. 3. Equation 3 has shown the process for identification of significant bit planes starting from bit plane 5 upto bit plane 8 and the identified bit planes were considered for feature extraction by binarization.
The rest of the bit planes as shown in fig. 3 contained noise in higher proportion and were discarded.

Bit Plane 4 (Odd Image)
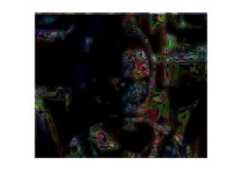
Bit Plane 5 (Odd Image)
hi
where x= R, G and B respectively for each color component
The process of bit plane extraction from odd images has been illustrated in fig. 3.
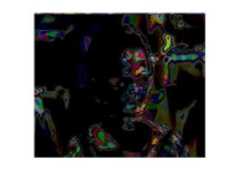
Bit Plane 6 (Odd Image)

(a) Odd Image

Bit Plane 7 (Odd Image)
(b) Bit Plane 1 (Odd Image)

Bit Plane 8 (Odd Image)

Bit Plane 2 (Odd Image)

Amalgamated Image of Bit Plane 1, 2, 3 and 4

Bit Plane 3 (Odd Image)

Amalgamated Image of Bit Plane 5, 6, 7 and 8
Fig.3. Process of Bit Plane Slicing and Amalgamation for Odd Image
3.3 Feature Extraction in Spatial Domain
Initially, three color components namely, Red (R), Green (G) and Blue (B) were extracted from the odd image variety created by combining bit plane 5, 6, 7 and 8. The process was followed by binarization of each of the extracted color components with Sauvola's threshold selection. Sauvola's threshold is a local- variance based method. The thresholding method was an improvement over Niblack's method and the threshold calcutation formula for each color component Red (R), Green (G) and Blue (B) has been given by equation 4.
о (i, j)
T(i,j) = A (i,j)*[1 + k(--1)] (4)
R where, µ = mean and σ = standard deviation k = 0.5 and R=128
The resultant images after binarization with Sauvola's threshold has been shown in fig.4

Odd Image
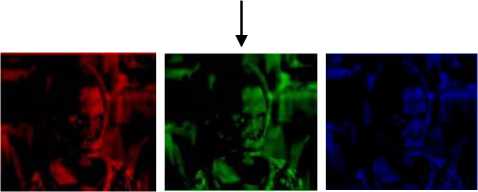
Red Component Green Component Blue Component
Binarized Red Binarized Green Binarized Blue
Component Component Component
Fig.4. Binarization Using Sauvola's Threshold
Bitmapx ( i , j )
| 1. if .. x ( i , j ) > Tx
[ O- if .. x ( i , j ) <= Tx
x = R, G and B
T x = Threshold
The thresholds were calculated for each pixel of individual color component R, G and B in the odd image. Binary image map for individual pixel was calculated for each color component as in equation 5. The values greater than threshold were assigned with value 1 and the values lesser than or equal to the threshold were assigned with value 0.
The mean of the values assigned with 1 were calculated to form the higher intensity feature vector and the mean of the values assigned with 0 was computed to form the lower intensity feature vector as per equation 6 and 7. The size of feature vector per image was 12.
Xupmean = * X X BitMap ( i , j ) * X ( i , j )
m n i=1 j=1
X X BitMap (i, j) i=1 j=1
Xlomean =-------- —^ --------------* X X (1 - BitMapx ( i , j )) * X ( i , j )
m * n - X X Bitmap ( i , j ) i 1j 1
i=1 j=1
Xupmean = higher intensity feature vector
Xlomean = lower intensity feature vector
-
3.4 Feature Extraction in Frequency Domain
Two dimensional discrete cosine transform (2D DCT) was applied on significant bit planes of Red (R), Green (G) and Blue (B) components in odd image variety to extract feature vector in the frequency domain. Discrete Cosine Transform (DCT) has been considered as a separable linear transformation process which has close link to discrete Fourier transform. Application of two dimensional DCT for the significant bit planes of an input image P to produce an output image Q can be demonstrated as in equation 8.
n(2 u + 1) i n (2 v + 1) j
Q ( i , j ) = a i a j XX A ( u , v ) cos----------cos----------
, , 2 A 2 B (8)
[ 1/ 4л , i = o
-
ai = < _____
[ 4474 , 1 < i < A - 1

1/ 4b , j = o 444b , 1 < j < в - 1
A and B are the size of rows and columns respectively for the considered image P.
The significance of an image transform has been to transfer the higher energy coefficients of the image towards the upper end of the image and the lower energy coefficients of the image toward the lower end of the image. Hence, the property has been manipulated to radically reduce the feature size by attempting to locate the higher energy components as image features as shown in fig. 5. The extracted feature vectors from each of the components in the form of transform coefficients were stored as complete set of feature vectors. Further, partial coefficients from the entire feature vector set were extracted to form the feature vector database. Feature vector database with partial coefficients were constructed starting from consideration of 50% of the complete set of feature vectors till 0.06% of the complete set of feature vectors. The feature vector size of 0.012% of the complete set of DCT coefficients had the maximum F1 Score for classification and was chosen as the optimal feature vector size with dimension 24.
of the whole DCT coefficient generated. Consequently, the number of iterations required for computing feature vectors with 0.012% of DCT coefficients was much less than 3L. Thus the computation for feature extraction was reduced to 0.012% of (3L). Thus, total number of iterations can be given by O (0.036N). Therefore, it is evident that time complexity is linear for both the processes in spatial and frequency domain respectively.
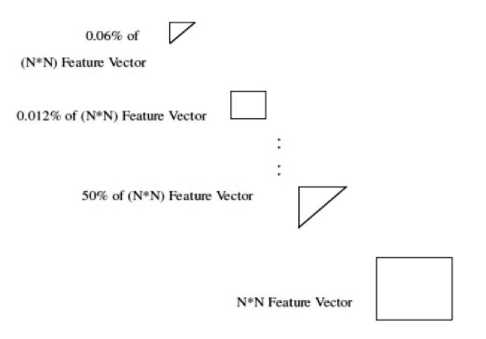
Fig.5. Extraction of Features with partial DCT Coefficients
-
V. Framework of Classification Process
The course of classification has been conducted based on similarity function between two instances using Euclidian Distance and City Block Distance for spatial domain and frequency domain respectively as in equation 9 and 10. An instance based classifier named K -Nearest neighbour (KNN) classifier was used for the purpose. The value of K was determined as less than or equal to the square root of the number of instances in the dataset [36, 37].
12 2
Dspatial = i = 1 i i
D frequency = i ∑ 1 | Qi - Ti |
-
IV. Complexity Analysis
-
5.1 Framework of Retrieval Process
Time complexity of the proposed algorithms was estimated by counting the number of elementary functions carried out by the algorithms. An algorithm can be considered as efficient if its time complexity is of the form of a polynomial in 'n' , where n is the size of the input. The performance of an algorithm can be measured in three different cases, namely, Best case, Average case and Worst Case for analyzing the time complexity. The Best case scenario lets the inputs to be provided in such way so that they can be processed in minimum time. The Average case scenario studies the average behavior of algorithm for diverse inputs. The Worst case scenario takes place when maximum time has been consumed for the processing of provided inputs. In this work, three color components were separated as non overlapping blocks from each of the images in the datasets for feature vector extraction with the proposed methodologies in each case. In case of spatial domain, each color component was considered as a series of gray values for computation of threshold. If the total number of gray values were assumed to be G for each color component then the threshold selection has consumed linear time O (G). Hence, for three color components and G number of distinct gray values per color component, the total number of iteration can be given by O (3G). In case of frequency domain, let the separable linear transform method for the DCT has taken L number of iteration for calculating the DCT coefficients. Thus for three color components a total of 3L iterations was required. However, the selected partial coefficient was of 0.012%
The distances computed by individual techniques were normalized before fusion by using the Z score normalization. Z score normalization was assessed by deriving the mean and standard deviation of the given data. The equation for the normalized distance has been given by equation 11.
distx - µ distx =
σ (11)
where, µ = mean and σ = standard deviation.
The process of distance normalization for the individual techniques was followed by derivation of the combined distance of the two techniques. The distances were combined as the weighted sum of the distances of the individual techniques. The weights were calculated from the individual average precision of the spatial domain technique and the frequency domain technique. Z score normalization have used the weighted sum of the ranks calculated by the individual technique for the fusion purpose and thus generated a new rank based on which the classification was carried out with fusion framework as in fig. 6.
The retrieval process has used the classification process as a antecedent of retrieval by classifying the query image into the nearest matched image category. The selection of category for the query image was made on the basis of the fusion based distance measure of comparison with all the classes in the dataset. This was followed by the process of content based retrieval which was limited only within the class of interest in contrast to searching the entire dataset. The process of fusion based classification and formation of focused query have been illustrated in fig. 6.
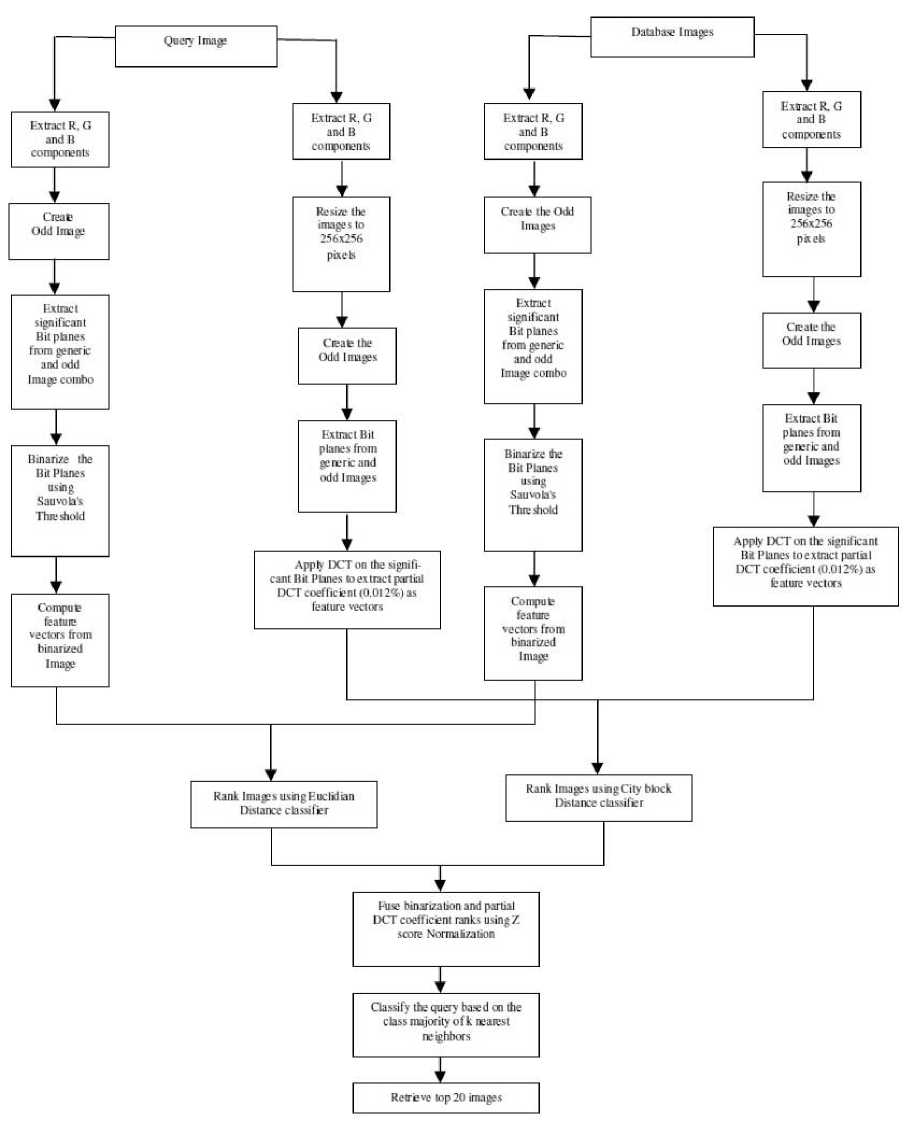
Fig.6. Framework for fusion based classification and retrieval with focused query
-
VI. Datasets Used
-
6.1 Wang's Dataset
It is a widely used public dataset provided by Wang et al. [26]. It has 10 different categories of 1000 images.
-
-
6.2 Oliva and Torralba (OT-Scene) Dataset
This dataset comprises of 2688 images and is divided into eight different categories. The dataset is provided by MIT [26]. The different categories in the dataset are Coast and Beach (with 360 images), Open Country (with 328 images), Forest (with 260 images), Mountain (with 308 images), Highway (with 324 images), Street (with 410 images), City Centre (with 292 images) and Tall Building (with 306 images). A sample collage for OT Scene dataset is given in fig. 8.
-
6.3 Corel Dataset
Every image is of dimension 256x384 or 384x256 and each category comprises of 100 images. The different classes in this dataset are Tribals, Sea Beaches, Gothic Structures, Buses, Dinosaur, Elephants, Flowers, Horses, Mountains and Food. A sample collage for Wang's dataset has been given in fig. 7.
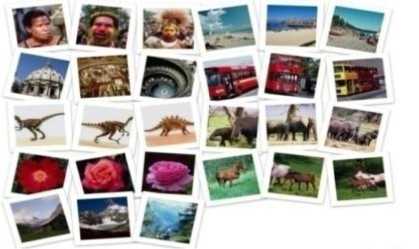
Fig.7. Sample of Wang Dataset

Fig.8. Sample of OT Scene Dataset
The dataset comprised of 10,800 images [39]. It has 80 different categories of images of dimension 80x120 or 120x80. Some of the categories are art, antique, cyber, dinosaur, mural, castle, lights, modern, culture, drinks, feast, fitness, dolls, aviation, balloons, bob, bonsai, bus, car, cards, decoys, dish, door, easter eggs, faces etc. A sample collage of the Corel dataset is given in fig. 9.

Fig.9. Sample of Corel Dataset
-
6.3 Caltech Dataset
The dataset includes 8,127 images divided into 100
different categories [26]. Each of the categories has different number of images with a dimension of 300x200. Some of the categories are accordion, airplanes, anchor, ant, Background google, barrel, bass, beaver, binocular, bonsai, brain, brontosaurus, buddha, butterfly, camera, cannon, car side, ceiling fan, cellphone, chair etc. A sample collage for the Caltech dataset has been given in fig. 10.
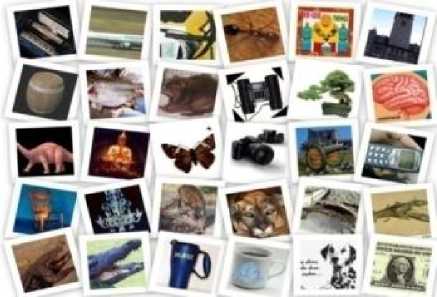
Fig.10. Sample of Caltech Dataset
-
VII. Evaluation Parameters
-
7.1 Evaluation Metric for Classification
-
Primarily, two different parameters were used to measure the classification performance with the individual techniques in spatial domain and frequency domain respectively. The parameters were misclassification rate (MR) and F1 Score. Further, Precision and Recall were used for comparison of the proposed technique to the state-of-the art methods.
The error rate of the classifier that indicates the proportion of instances that have been wrongly classified has been defined as misclassification rate (MR) as in equation 12.
FP + FN
MR =-------------
TP + TN + FP + FN
where
True Positive (TP) = Number of instances classified correctly.
True Negative (TN) = Number of negative results created for negative instances
False Positive (FP) = Number of erroneous results as positive results for negative instances
False Negative (FN) = Number of erroneous results as negative results for positive instances
Comparison of Misclassification Rate (MR) for proposed techniques in spatial domain
Precision and Recall (TP Rate) can be combined to produce a metric known as F1 Score as in equation 13. It is considered as the harmonic mean of precision and
Recall. Higher value of F1 Score indicates better classification results.
2 * Pr ecision * Re call
F 1 score =-------------------- (13)
Pr ecision + Re call where,
Precision = the probability that an object is classified correctly as per the actual value
Recall = the probability of a classifier that it will produce true positive result
Comparison of misclassification rate (MR) and F1 Score of ten different categories of images for feature extraction by binarization with Sauvola's threshold selection technique has been shown in fig.11. The category named Dinosaur has shown the highest F1 Score of 0.99 and the lowest MR whereas the category named Mountains have the least F1 Score of 0.21 and maximum MR of 0.09 compared to the rest of the image classes. The categories named horses, roses and tribals have shown better classification results with higher F1 Score values of 0.92, 0.82 and 0.74 respectively with corresponding lower misclassification rates of 0.02, 0.04 and 0.05. Moderate classification performances has been portrayed by the categories named food, bus, elephant and gothic structure with respective F1 Scores of 0.69, 0.64, 0.62 and 0.53 and with corresponding misclassification rates of 0.05, 0.09, 0.09 and 0.13. Low classification accuracy was observed with the category named Sea Beach with a F1 Score of 0.36.
Comparison of Category wise MR and F1 Score for feature extraction with binarization
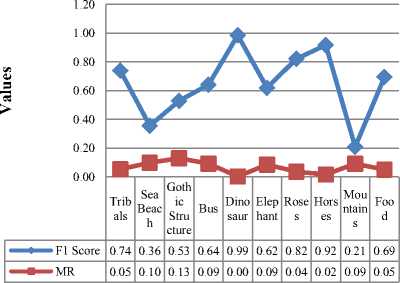
Fig.11. Category wise comparison of F1 Score and MR for Classification by feature extraction with Binarization
Different values of fractional DCT coefficients were tested for the minimum MR and highest F1 Score as in fig. 12.
The illustration shown in Fig. 12 has clearly revealed maximum classification results with 0.012% of full feature size. It was observed that classification with 0.012 % of full feature size of DCT coefficients has the maximum F1 Score of 0.76 and minimum MR of 0.052 compared to the remaining partial coefficients. The classification results with 100% of the feature size has the least F1 Score of 0.34 and highest misclassification rate of 0.13. The F1 Score has increased gradually for the reduced percentage of feature vector sizes and the misclassification rates have also been minimized correspondingly. However, it was observed that the F1 Score has decreased to 0.72 and misclassification rate increased to 0.06 for classification with 0.006% of feature vector size compared to the classification results with 0.012% of feature vector size.
Comparison of Average F1 Score and MR for feature extraction with different partial coefficients of DCT
|
0.8 0.7 0.6 0.5 0.4 0.3 0.2 0.1 |
||||
|
II |
||||
|
F1 Score |
MR |
|||
|
100% feature size |
0.34 |
0.15 |
||
|
50% of feature size |
0.45 |
0.1 |
||
|
25% of feature size |
0.45 |
0.1 |
||
|
12.5% of feature size |
0.46 |
0.1 |
||
|
6.25% of feature size |
0.46 |
0.1 |
||
|
3.125% of feature size |
0.47 |
0.09 |
||
|
1.5625% of feature size |
0.5 |
0.09 |
||
|
0.7813% of feature size |
0.52 |
0.09 |
||
|
0.39% of feature size |
0.58 |
0.08 |
||
|
0.195% of feature size |
0.65 |
0.07 |
||
|
0.097% of feature size |
0.7 |
0.06 |
||
|
0.048% of feature size |
0.73 |
0.058 |
||
|
0.024% of feature size |
0.73 |
0.057 |
||
|
0.012% of feature size |
0.76 |
0.052 |
||
|
0.006% of feature size |
0.72 |
0.06 |
||
Fig.12. Comparison of average F1 Score and MR for classification by feature extraction with fractional DCT coefficients
-
7.2 Evaluation Metric for Retrieval
Retrieval Performance was measured in terms of Precision-Recall ratio. The Precision and Recall were determined for individual categories along with average precision for each technique.
Precision and Recall ratio was measured by equation 14 and 15
-
VIII. Results and Discussions
7.11.0(R2010b) on Intel core i5 processor with 4 GB RAM under Microsoft Windows environment. Primarily, the experiments for classification were performed on Wang's, Corel, Caltech and OT Scene datasets for precision and recall values. The odd image variety was created by subtracting the flipped image from the generic image for all the images in the datasets. Further, the images were tested for classification performance as in Fig. 13.
The experiments were carried out with Matlab version
Precision and Recall Values on different datasets for feature extraction with binarization
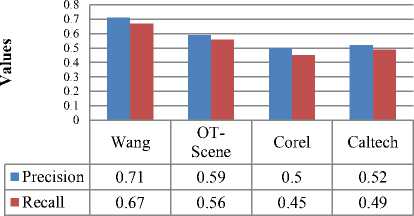
Fig.13. Comparison of precision and recall values of four public datasets for classification by feature extraction with binarization
Henceforth, the odd images were tested for precision and recall values for classification by feature extraction with 0.012% of full feature set of DCT coefficients as in Fig. 14.
Precision and Recall Values on different datasets for feature extraction with partial DCT Coefficients
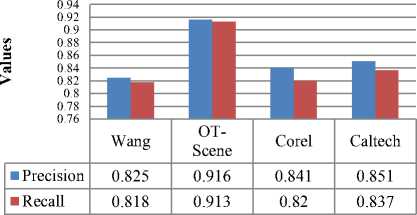
Fig.14. Comparison of precision and recall values of four public datasets for classification by feature extraction with partial DCT coefficients
Application of two different feature extraction processes for estimating classification outcomes on same datasets has revealed to different inferences. It was found that the frequency domain method of feature extraction has shown better classification results with respect to the spatial domain method.
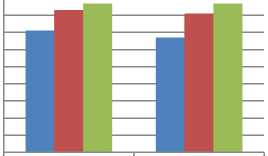
Subsequently, the classification decision with two different methods of feature extractions was fused with Z score normalization to examine the classification performance with the hybrid architecture on Wang dataset. The results in Fig. 15 have revealed that the fused technique has better precision and recall values compared to the individual techniques.
1 0.9 0.8
Comparison of Precision and Recall for classification with individual technique of feature extraction and fusion method with Z score normalization
0.7
0.6
0.5
0.4
Precision
Recall
«
0.3
0.2
0.1
|
■ Classification with feature extraction by binarization |
0.71 |
0.67 |
|
■ Classification with feature extraction by partial DCT coefficients |
0.83 |
0.81 |
|
Classification by fusion with Z score normalization |
0.87 |
0.87 |
Fig.15. Comparison of precision and recall values for classification by individual techniques and fused technique
Therefore, the precision, recall and F1 score values for classification with the proposed technique was compared to the state-of-the art techniques as in fig. 16. The evaluation was assessed on Wang dataset. It was deduced from the comparison in fig. 16 that the proposed technique of classification has outclassed all the state-of-the art techniques.
Comparison of Precision, Recall and F1 Score for Classification
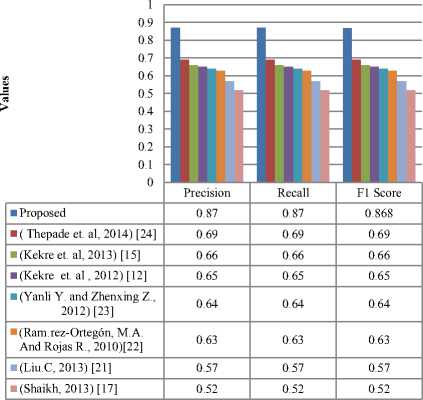
Fig.16. Comparison of precision, recall and F1 Score for classification with the proposed technique with respect to the existing techniques
A paired t -test (2 tailed) was performed to compute the p -values of the existing techniques with respect to the proposed technique [38] as in Table 1. The actual difference between the two means for variation in precision results of the proposed technique and the existing techniques in fig. 16 was statistically validated by the test.
The test was executed to assess whether the differences in precision values were originated from a population with zero mean:
H0 : µd = 0 vs. H1 : µd < 0
The p -values in Table 1 have determined the potency of evidence against the null hypothesis. The p -values generated after the comparison has divulged noteworthy distinction in precision results of the proposed technique compared to the existing techniques as seen in Table 1. Hence, the null hypothesis was rejected and it was well inferred that the proposed technique has prospective contribution for improved content based classification results with respect to the state of the art techniques.
Table 1. Paired t-test for significance of precision values for classification with proposed technique
|
Comparison |
t -calc |
p -value |
Significance of difference in value |
|
Feature Extraction by binarization using bit plane slicing with Niblack's local threshold method( Thepade et. al, 2014) |
4.1692 |
0.0031 |
Significant |
|
Feature Extraction by binarization with multilevel mean threshold (Kekre et. al, 2013) |
3.2722 |
0.0113 |
Significant |
|
Feature Extraction by binarization using Bit Plane Slicing with mean threshold(Kekre et. al, 2012) |
4.6355 |
0.0017 |
Significant |
|
Feature Extraction by binarization of original + even image with mean threshold(Thepade et. al , 2013) |
4.5331 |
0.0019 |
Significant |
|
Traditional Feature Extraction by binarization with Bernsen's local threshold method (Yanli Y. and Zhenxing Z. (2012)) |
4.9957 |
0.0011 |
Significant |
|
Traditional Feature Extraction i ari ati it h a a a thre h meth Ramíre -Ortegó M.A. And Rojas R., (2010)) |
6.6486 |
0.0002 |
Significant |
|
Traditional Feature Extraction by binarization with Niblack's local threshold method (Liu.C (2013)) |
5.1358 |
0.0009 |
Significant |
|
Traditional Feature Extraction by binarization with Otsu's global threshold method(Shaikh (2013)) |
5.6956 |
0.0005 |
Significant |
Hereafter, classification has been used as a precursor to the retrieval process to generate focussed query. The process of retrieval was assessed with Wang dataset. On the whole, 50 random images were selected as queries for the retrieval purpose which comprised of 5 arbitrary images from each category. Primarily, the classification of the query image was done to formulate the focused query by classifying the query image to the nearest class measured by using the fusion based distance measure using Z score normalization. Further, the classified query was used to retrieve images by searching only within the class of interest instead of searching the entire dataset as in the case for a generic query without classification. In both the cases of focused and unclassified query for retrieval, the retrieved images were ranked using Euclidian Distance measure. Ranking process was followed by retrieval of top 20 images. A comparison of precision and recall values with focused query and generic query has been given in Fig. 17.
Comparison of retrieval with focussed query and generic query
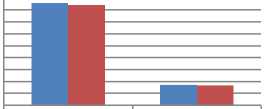
Precision
Recall
>
Retrieval with Focussed Query
Retrieval with Generic Query

17.2
16.86
-
Fig.17. Comparison of precision and recall for retrieval with focused query and generic query
The illustration in Fig. 17 has shown the superiority of retrieval with focused query over retrieval with generic query. Comparison of a sample retrieval process with focused query and generic query has been given in Fig. 18.

Query Image

Retrieved Images with Generic Query
Ь^ 311F* д» ^ ^ % В ^® ^ ^ Т^ ««ГТ •• «цЦ >>-mi ь^лЯ^и HakJ Т
Retrieved Images with Focused Query
-
Fig.18. Comparison of Retrieval with generic query and focused query
The results in Fig. 18 have shown that retrieval with focused query from the category gothic structure has generated the output with all the 20 images from the category gothic structure itself. On the other hand, retrieval with generic query with the same image from the category gothic structure has generated the output with 17 images from the class gothic structure, 1 image each from the classes named buses, elephants and mountains. The proposed retrieval technique with focused query was further compared with state-of-the art techniques of retrieval for precision and recall values as shown in Fig. 19.
Comparison of Precision and Recall for Retrieval with proposed technique with respect to state-of-the art techniques
|
100 90 80 70 60 50 > 40 30 20 10 0 |
|||||||||
|
Average Precision |
Average Recall |
||||||||
|
■ Proposed |
86 |
17.2 |
|||||||
|
■ Walia et al. (2014) [35] |
75.8 |
15.16 |
|||||||
|
■ Shenn & Wu (2013) [31] |
72.8 |
14.56 |
|||||||
|
■ Banerjee et al. (2009) [29] |
72.7 |
14.54 |
|||||||
|
■ Subrahmanyam et al. (2012) [34] |
72.5 |
14.5 |
|||||||
|
■Jalab (2011) [30] |
58.2 |
11.64 |
|||||||
|
Hiremath & Pujari, (2007) [28] |
54.9 |
10.98 |
|||||||
|
■ Rahimi & Moghaddam (2013) [33] |
49.6 |
9.92 |
|||||||
Fig.19. Comparison of average precision and recall for retrieval with the proposed technique with respect to state-of-the art techniques
The proposed technique of retrieval has outclassed all the existing techniques in Fig. 19 and has shown higher precision and recall values for retrieval. Hence, the authors were successful in designing fusion technique for fusing multi view feature vectors for retrieval with focused query which has outclassed the contemporary techniques of retrieval.
-
IX. Conclusion
The paper has presented two different techniques of feature extraction in spatial domain and in frequency domain. The spatial domain methodology has explored the binarization technique using local threshold for feature extraction. The methodology in frequency domain has implemented feature extraction using partial Discrete Cosine Transform coefficient. The feature vector size for both the techniques were significantly small and have outperformed the classification and retrieval results for existing state-of-the art techniques. The proposed fusion framework for image classification has proved its efficacy over existing classification techniques. The retrieval method with focussed query has outperformed well established fusion based techniques discussed in the literature. The work can have varied applications for feature extraction of images required for image retrieval and classification in the areas of medical imaging, defence, surveillance, and media and also in different areas of e commerce for increased revenue generation.
References Content Based Image Recognition by Information Fusion with Multiview Features
- Lee, Y., Kim, B., Rhee, S.: Content-based Image Retrieval using Spatial-color and Gabor Texture on a Mobile Device. Computer Science and Information Systems, Vol. 10, No. 2, 807-823. (2013).
- Chandrashekar, G. & Sahin, F.: A survey on feature selection methods. Computers & Electrical Engineering, 40(1), 16-28. (2014).
- Chen, Y. et al.: Otsu?s thresholding method based on gray level-gradient two-dimensional histogram. 2nd International Asia Conference on Informatics in Control, Automation and Robotics, 282-285 (2010).
- Farid, S. & Ahmed, F.: Application of Niblack?s method on images. In 2009 International Conference on Emerging Technologies, ICET 2009. pp. 280-286. (2009).
- Goto, H.: Redefining the DCT-based feature for scene text detection. International Journal on Document Analysis and Recognition, 11(1), p.1-8. (2008).
- Sisodia, D., Singh, L. & Sisodia, S.: Incremental learning algorithm for face recognition using DCT. IEEE International Conference ON Emerging Trends in Computing, Communication and Nanotechnology (ICECCN). IEEE, 282-286. (2013).
- Kekre, H.B., Thepade, S., Banura, V.K. & Bhatia, A.: Image Retrieval using Fractional Coefficients of Orthogonal Wavelet Transformed Images with Seven Image Transforms. International Journal of Computer Applications (0975 – 8887). Vol 30(1), 14-20. (2011). 8.
- Chang, R., Lin, S., Ho, J., Fann, C., Wang, Y.: A Novel Content Based Image Retrieval System using K-means/KNN with Feature Extraction. Computer Science and Information Systems, Vol. 9, No. 4, 1645-1662. (2012).
- Wang, X.Y., Yu, Y.J. & Yang, H.Y.: An effective image retrieval scheme using color, texture and shape features. In Computer Standards and Interfaces. 59-68. (2011).
- Park, D.K., Jeon, Y.S. & Won, C.S.: Efficient use of local edge histogram descriptor. In MULTIMEDIA ’00 Proceedings of the 2000 ACM workshops on Multimedia. 51-54.(2000).
- Kim, W.Y. & Kim, Y.S.: Region-based shape descriptor using Zernike moments. Signal Processing: Image Communication, 16(1), 95-102. (2000).
- Kekre HB, Thepade S, Das RKK & Ghosh S.: Perfor-mance Boost of Block Truncation Coding based Image Classification using Bit Plane Slic-ing. International Journal of Computer Applications 47(15): 45-48, (ISSN:0975-8887) (2012).
- Thepade, S, Das, R & Ghosh, S.: Performance Comparison of Feature Vector Extraction Techniques in RGB Color Space using Block Truncation Coding or Content Based Image Classification with Discrete Classifiers. In: India Conference (INDICON), IEEE Digital Object Identifier: 10.1109/INDCON.2013.6726053, 1 – 6 (2013).
- Thepade S, Das RKK & Ghosh S: Image classification using advanced block truncation coding with ternary image maps. Advances in Computing, Communication and Control, Volume 361, DOI: 10.1007/978-3-642-36321-4_48, pp.500-509: Springer Berlin Heidelberg (2013).
- Kekre H.B., Thepade S, Das R & Ghosh S.: Multilevel Block Truncation Coding With Di-verse Colour Spaces For Image Classification. IEEE-International conference on Advances in Technology and Engineering (ICATE), 1-7 (2013).
- Otsu,N.: A Threshold Selection Method from Gray-Level Histogram. IEEE Transactions on Systems, Man, and Cybernetics, vol. 9, 62-66. (1979).
- Shaikh, S. H., Maiti, A. K., & Chaki, N.: A new image binarization method using iterative partitioning. Machine Vision and Applications, 24(2), 337-350 (2013).
- Niblack,W.: An Introduction to Digital Image Processing: Prentice Hall, Eaglewood Cliffs (1986).
- Sauvola, J., Pietikainen, M.: Adaptive document image binarization. Pattern Recogn. 33(2), 225–236 (2000).
- Bernsen, J.: Dynamic thresholding of gray level images.In: ICPR’86: Proceedings of the International Conference on Pattern Recognition, pp. 1251–1255 (1986).
- Liu.C.:A new finger vein feature extraction algorithm. IEEE 6th. International Congress on Image and Signal Processing (CISP),: 1, 395-399. (2013)
- Rami?rez-Ortego?n, M.A. & Rojas R.: Unsupervised Evaluation Methods Based on Local Gray-Intensity Variances for Binarization of Historical Documents, IEEE 20t. International Conference on Pattern Recognition (ICPR); 2029- 2032. (2010).
- Yanli, Y. & Zhenxing, Z.: A novel local threshold binarization method for QR image, IET International Conference on Automatic Control and Artificial Intelligence; 224-227. (2012).
- Thepade,S., Das, R. & Ghosh, S.: A Novel Feature Extraction Technique Using Bi-narization of Bit Planes for Content Based Image Classification. Journal of Engineering, vol. 2014, Article ID 439218, 13 pages. doi:10.1155/2014/439218 Hindawi Publishing Corporation (2014).
- Kekre, H.B., Thepade, S., Viswanathan, A., Varun, A., Dhwoj, P. & Kamat, N.: Palm print identification using fractional coefficients of Sine/Walsh/Slant transformed palm print images. Communications in Computer and Information Science. 214-220. (2011).
- Thepade, S., Das, R., & Ghosh, S.:Feature Extraction with Ordered Mean Values for Content Based Image Classification. Advances in Computer Engineering, vol. 2014, Article ID 454876, 15 pages. (2014) doi:10.1155/2014/454876. (2014).
- El Alami, M.E.: A novel image retrieval model based on the most relevant features. Knowl.-Based Syst. 24, 23–32. (2011).
- Hiremath, P. S., & Pujari, J.: Content Based Image Retrieval Using Color, Texture and Shape Features. In: 15th International Conference on Advanced Computing and Communi-cations , 9(2), 780-784. (2007).
- Banerjee, M., Kundu, M. K., & Maji, P.: Content-based image retrieval using visually significant point features. Fuzzy Sets and Systems, 160(23), 3323-3341 (2009).
- Jalab, H.A.: Image retrieval system based on color layout descriptor and Gabor filters. In: IEEE Conf. Open Syst. (ICOS) 32-36 (2011).
- Shen, G.L. & Wu, X.J.: Content based image retrieval by combining color texture and CENTRIST, IEEE internationalworkshoponsignal processing, vol. 1, 1–4 (2013).
- Irtaza, A. Jaffar, M.A. Aleisa, E., Choi, T.S.: Embedding neural networks for semantic as-sociation in content based image retrieval. Multimedia Tool Appl. 1–21 (2013).
- Rahimi, M., Moghaddam, M.E.: A content based image retrieval system based on Color ton Distributed descriptors. Signal image and video processing, 1–14 (2013).
- Subrahmanyam, M., Maheshwari, R.P. & Balasubramanian, R. : Expert system design using wavelet and color vocabulary trees for image retrieval. Expert Systems with Applications, 39(5).5104-5114 (2012).
- Walia, E., Vesal, S. & Pal. A.: An Effective and Fast Hybrid Framework for ColorImage Retrieval, Sensing and Imaging. DOI: 10.1007/s11220-014-0093-9, Springer US (2014).
- Sridhar.,S. : Digital Image Processing : Oxford University Press (2011).
- Dunham, M.H.: Data Mining Introductory and Advanced Topics: Pearson Education, p. 127 (2009).
- Y?ld?z O.T., Aslan, and Alpayd?n E,: Multivariate Statistical Tests for Comparing Classi-fication Algorithms : Lecture Notes in Computer Science Volume 6683, 1-15, Springer Berlin Heidelberg (2011).
- Liu, G-H. & Yang, J-Y.: Content-Based Image retrieval using color difference histogram, Pattern Recognition, 46(1) 188-198 (2013).
- Arai,K.: Method for Object Motion Characteristic Estimation Based on Wavelet Multi-Resolution Analysis: MRA, IJITCS, vol.6, no.1, pp.41-49, 2014. DOI: 10.5815/ijitcs.2014.01.05.
- Barde, S., Zadgaonkar, A S, Sinha, G R: PCA based Multimodal Biometrics using Ear and Face Modalities, IJITCS, vol.6, no.5, pp.43-49, 2014. DOI: 10.5815/ijitcs.2014.05.06.
- Das, R. and Bhattacharya, S., A Novel Feature Extraction Technique for Content Based Image Classification in Digital Marketing Platform, American Journal Of Advanced Computing, Vol. 2(1), 2015, pp. 17-24.
- Thepade, S., Das, R. & Ghosh, S.: Novel Technique in Block Truncation Coding Based Feature Extraction for Content Based Image Identification, Transactions on Computational Science XXV, Springer Berlin Heidelberg, 2015, pp. 55-76.
- Thepade, S., Das, R. & Ghosh, S.: A Novel Feature Extraction Technique with Binarization of Significant Bit Information, International Journal of Imaging and Robotics?, Vol. 15 (3), 2015, pp. 164-178.
- Thepade, S., Das, R. & Ghosh, S.: Content Based Image Classification with Thepade's Static and Dynamic Ternary Block Truncation Coding, Vol.4 (1), 2015, pp. 13-17.
