Content-Based Image Retrieval Using Color Layout Descriptor, Gray-Level Co-Occurrence Matrix and K-Nearest Neighbors

Author: Md. Farhan Sadique, S.M. Rafizul Haque
Journal: International Journal of Information Technology and Computer Science @ijitcs
Article in issue: 3 Vol. 12, 2020.
Free access
Content-based image retrieval (CBIR) is the process of retrieving similar images of a query image from a source of images based on the image contents. In this paper, color and texture features are used to represent image contents. Color layout descriptor (CLD) and gray-level co-occurrence matrix (GLCM) are used as color and texture features respectively. CLD and GLCM are efficient for representing images with local dominant regions. For retrieving similar images of a query image, the features of the query image is matched with that of the images of the source. We use cityblock distance for this feature matching purpose. K-nearest images using cityblock distance are the similar images of a query image. Our CBIR approach is scale invariant as CLD is scale invariant. Another set of features, GLCM defines color patterns. It makes the system efficient for retrieving similar images based on spatial relationships between colors. We also measure the efficiency of our approach using k-nearest neighbors algorithm. Performance of our proposed method, in terms of precision and recall, is promising and better, compared to some recent related works.
Color layout descriptor, gray-level co-occurrence matrix, KNN, corel-1k, dominant color, scale invariant
Short address: https://sciup.org/15017451
IDR: 15017451 | DOI: 10.5815/ijitcs.2020.03.03
Text of the scientific article Content-Based Image Retrieval Using Color Layout Descriptor, Gray-Level Co-Occurrence Matrix and K-Nearest Neighbors
Published Online June 2020 in MECS
The necessity of making computer human-like is increasing in day-to-day life with the increased amount of computer applications. Making computer that perceives things like human does is the main concern of computer vision. Content-based image retrieval (CBIR) is one of the important areas of computer vision. In general, CBIR means retrieving similar images of a query image according to the contents of the image. It also means recognizing images according to their contents.
The investigation of CBIR has been going on since
1990s [10]. Toshikazu Kato [11] proposed a similar graphic symbol retrieval system of a given sketch. This system uses spatial distribution of the gray level, spatial frequency, local correlation measure and local contrast measure for representing the contents of the sketch and graphic symbols. Maria Tzelepi and Anastasios Tefas [10] proposed a deep convolutional neural network based CBIR system. Deep convolutional neural network based CBIR systems are considered as one of the most effective options for building a CBIR system. However, to build an effective CBIR system using deep neural network, a lot of training data are required. Moreover, there is no way to know why a set of features are selected after training. In [15], Famao Ye et al. proposed a remote sensing image retrieval system which uses convolutional neural network (CNN) for classification purpose, whereas most of the works use CNN for extracting features. S.M. Mohidul Islam and Rameswar Debnath [12] proposed a rotation, scale and translation invariant CBIR approach. This approach uses color moments and wavelet entropy as image features.
In our proposed CBIR method, we have used color layout descriptor and gray-level co-occurrence matrix for representing the contents of the images. Scale invariant color layout descriptor represents color and gray-level cooccurrence matrix represents texture of an image. We have used k-nearest neighbors (KNN) algorithm for similar image retrieval and for training and testing images for performance evaluation. Our proposed method outperforms some related methods in terms of precision, recall, F-score and accuracy. Moreover, we believe that our feature extraction methods are better for the following reasons:
-
• Color layout descriptor extracts color information from several blocks of an image. Thus, it provides local color information. Therefore, local dominant color makes a large impact in this feature. It is suitable for representing images containing few objects in front of a large background.
-
• Color layout descriptor is scale invariant.
-
• Gray-level co-occurrence matrix generates features based on the spatial relationship between pixels. It is simple but very useful when an image contains one or more notable areas with same color pattern.
The rest of the paper is organized as follows. Section II describes some related works. Section III outlines our proposed method in details. Experimental results and comparison are shown in section IV. Section V concludes our work.
II. Related Works
Sawet Somnugpong and Kanokwan Khiewwan [7] proposed a CBIR system using color correlograms and edge direction histogram. Color correlograms represent the information about the relative locations of color values. Edge direction histogram makes the system suitable for matching similar images of different colors. Five types of shapes are determined using edge direction histogram. Euclidean distance is used to find the distance between the features of the images. It uses Corel-1K dataset [4, 5] for its performance evaluation. This method shows its efficiency using precision and recall values. Atif Nazir et al. [8] proposed a CBIR system using a combination of color and texture features. In this system, color histogram is used as color features and discrete wavelet transform and edge histogram descriptor are used as texture features. Color histogram shows the number of occurrence of each color values. This approach calculates color histogram from HSV color space. Daubechies wavelet filter is used to compute discrete wavelet transform. This method evaluates its performance on Corel-1K dataset [4, 5] by showing precision and recall values. Manhattan metric is used here for similarity measurement. Md. Farhan Sadique et al. [13] proposed an unsupervised CBIR approach using both global and local features. This methods uses gray-level co-occurrence matrix as global features and combination of Speeded Up Robust Features (SURF) and color moments as local features. Gray-level co-occurrence matrix is calculated in both horizontal and vertical directions. It shows the spatial relationships between the pixel values. SURF detects blob points. SURF descriptors are calculated around the detected blob points. Color moments are merged with SURF descriptor to obtain color information. Accuracy value is used here to determine its performance on Corel-1k (WANG) dataset [4, 5]. SURF is considered as an upgraded version of Scale Invariant Feature Transform (SIFT). A SIFT based CBIR system was proposed by Prashant Srivastava and Ashish Khare [14]. In this work, SIFT is used as local features and geometric moments are used as global features. It calculates precision and recall values on Corel-1K dataset [4, 5] for performance evaluation.
III. Methodology
Content-based image retrieval mainly involves two steps. They are feature extraction and feature matching [1]. In computer vision and image processing, feature means some numeric values which can represent the contents of an image. Generally, a digital image is formed using a two dimensional or a three dimensional array. Each pixel of the image is represented by a cell of the array. Therefore, the array is as large as the number of pixels of the image. It would be very tedious to work with the array as the representative of the contents of an image. This is the reason, features are computed from images to do image processing tasks. Several feature extraction techniques are common among the researchers. Each feature extraction technique extracts different kinds of features. There are mainly three types of features: color, texture and shape features. In our proposed method, we use color and texture features. We have not used shape features because they are affected a lot by edges, corners etc. The images whose features are most similar with the features of the query image, are the similar images of that query image. If the images have same number of features and the features of each image are sorted in same manner then feature matching step can be conducted using pairwise distance. In the following subsections, we have described our CBIR system. We extract color layout descriptor and gray-level cooccurrence matrix which represent color and texture information of the images. Cityblock distance based k-nearest neighbors algorithm is used to retrieve k similar images of a query image from the image dataset. K-nearest neighbors algorithm is applied on the feature vectors of the images.
-
A. Color Feature Extraction Using Color Layout Descriptor
0.2989
x
R
+
0.5870
x
G
+
0.1140
x
B
(3)
Color layout descriptor (CLD) gives spatial color information of an image. It is invariant to scale [2]. We obtain CLD in three different steps. They are dividing the image into 8×8 blocks, finding representative color for each block and discrete cosine transformation (DCT).
To find the number of pixels in each block, we divide the number of rows of the image by 8 and number of columns of the image by 8 which gives the number of rows and columns of each block respectively. If the number of rows or columns of the image is not divisible by 8, we take the maximum number of rows/columns that is divisible by 8 and eliminate the remaining rows/columns from the image. The 64 blocks are extracted from each color channel of the image. In each of the 64 blocks, a representative color is obtained. We use the average of the pixel values as a representative color which gives better accuracy [2]. Considering the representative colors as pixel values, an 8 × 8 matrix is obtained for each color channel of the image. Fig. 1 shows the representative colors of each block of an image.
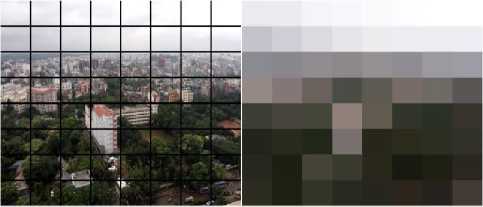
Fig.1. Representative colors of each block.
into a grayscale image.
where R , G and B are corresponding pixel values of a RGB image. Since pixel values range from 0 to 255, the GLCMs will be very large. To solve this problem, we transform the range into 0 to 7. Now the image contains pixel values from 0 to 7. Therefore, the size of a GLCM will be 8 × 8. Fig. 2 shows the structure of a GLCM.
Now the RGB color space is converted into YCbCr color space using (1).
Y = 0.299 x R + 0.587 x G + 0.114 x B - 128
Cb = 0.169 x R - 0.331 x G + 0.500 x B (1)
Cr = 0.500 x R - 0.419 x G - 0.081 x B
where R , G and B are corresponding pixel values of red, green and blue channels of an image respectively [2]. In the last step, DCT is performed on the 64 representative color values. Equation (2) is used to perform DCT.
B pq
= aa У У, A pq m
cos
n (2 m + 1) p n(2 n + 1) q cos
2 M 2 N
0 1 2 3 4 5 6 7
|
Count (0.0) |
Count (0.1) |
Count (0.2) |
Count (0.3) |
Count (0.4) |
Count (0. 5) |
Count (0.6) |
Count (0.7) |
|
Count |
Count |
Count |
Count |
Count |
Count |
Count |
Count |
|
(1.0) |
(1.1) |
(1.2) |
(1.3) |
(1.4) |
(1.5) |
(1.6) |
(1.7) |
|
Count |
Count |
Count |
Count |
Count |
Count |
Count |
Count |
|
(2.0) |
(2.1) |
(2.2) |
(2.3) |
(2.4) |
(2. 5) |
(2.6) |
(2-7) |
|
Count |
Count |
Count |
Count |
Count |
Count |
Count |
Count |
|
(3.0) |
(3.1) |
(3.2) |
(3.3) |
(3.4) |
(3. 5) |
(3.6) |
(3.7) |
|
Count |
Count |
Count |
Count |
Count |
Count |
Count |
Count |
|
(4.0) |
(4.1) |
(4.2) |
(4.3) |
(4. 4) |
(4.5) |
(4.6) |
(4.7) |
|
Count |
Count |
Count |
Count |
Count |
Count |
Count |
Count |
|
(5.0) |
(5.1) |
(5.2) |
(5.3) |
(5.4) |
(5. 5) |
(5.6) |
(5- 7) |
|
Count |
Count |
Count |
Count |
Count |
Count |
Count |
Count |
|
(6.0) |
(6.1) |
(6.2) |
(6.3) |
(6.4) |
(6. 5) |
(6.6) |
(6-7) |
|
Count |
Count |
Count |
Count |
Count |
Count |
Count |
Count |
|
(7.0) |
(7.1) |
(7,2) |
(7.3) |
(7.4) |
(7. 5) |
(7.6) |
(7.7) |
Fig.2. Structure of a gray-level co-occurrence matrix.
0 < p < M - 1,
0 < q < N - 1,
a
p
,---, p = 0
M
— ,1 < p < M - 1
M
—t= , q = 0
a
q
,1 < q < N - 1
where M is the number of rows and N is the number of columns of the image [2]. Now to make the features easy for matching, we transform the three 8×8 matrices into three arrays of size 1 × 64 each. After merging the three arrays one after another, we get the color layout descriptor of size 1×192 for an image.
-
B. Texture Feature Extraction using Gray-Level CoOccurrence Matrix
Gray-level co-occurrence matrix (GLCM) shows the spatial relationship between the pixels of a grayscale image. GLCM determines how many times two pixels with fixed values are adjacent. Two pixels are adjacent, if they are situated side by side horizontally, vertically or in any other direction. In our proposed method, we use two GLCMs for horizontal and vertical directions. For calculating the GLCMs, the RGB image is converted into grayscale image. We use (3) to convert an RGB image
Here, Count( i , j ) means the number of times pixels i and j are adjacent, where i = 0, 1, ..., 7 and j = 0, 1, ..., 7. We simplify each of the two GLCMs by converting them into an array of size 1 × 64. After merging the two arrays, we get the gray-level co-occurrence values of size 1 × 128.
-
C. K-nearest Neighbors
The k-nearest neighbors (KNN) technique is a lazy learning classification method. It actually does not create any model during training. Rather it memorizes the training data. KNN mainly does the hard part during testing by identifying an unknown sample using the votes of its k-nearest neighbors. Here, nearest means the samples or features which have smallest distance from the unknown sample or feature. The distance is calculated using a distance matric. In this proposed method, we use Cityblock distance to calculate the distance. Cityblock distance is also known as Manhattan metric or Taxicab distance [3]. The formula of Cityblock distance is
n
Distance(x,y) = ^|x -y| i=1
where x and y are two set of features [3].
-
D. Similar Image Retrieval
We create feature vector for each image which represents the image contents. Feature vector is created using CLD and GLCM. We combine the CLD and GLCM features which are described in section III-A and III-B respectively. Thus, we get the feature vector.
Feature vector = [CLD GLCM] (5)
Recall shows the percentage of positive samples that are classified as positive [6]. The formula for precision is
Similar images of a query image are retrieved using k-nearest neighbors search. The k-nearest images of a query image are the k similar images of that query image.
Precision =
TP
TP + FP
IV. Experiment and Results
For testing the performance of our proposed CBIR method, we use Corel-1K dataset [4, 5]. It has 10 classes of images. Each class contains 100 images. The classes are named as Africa, Beach, Building, Bus, Dinosaur, Elephant, Flower, Horse, Mountain and Food. Fig. 3 shows some sample images of Corel-1K [4, 5] dataset. The images of this dataset are diverse like real world images. Therefore, the performance rate using this dataset gives reflection of the performance rate using real world data.
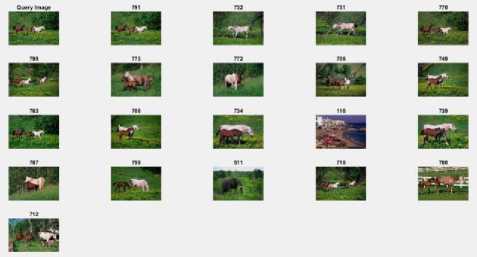
Fig.5. Similar images of a query image using our proposed method.
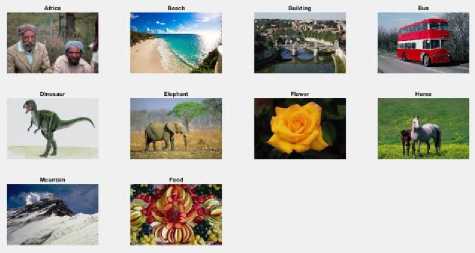
Fig.3. Some sample images of Corel-1K dataset.
where TP = number of true positives and FP = number of false positives. The formula for recall is
Recall =
TP
TP + FN
where FN = number of false negatives. TP is the number of positive samples that are classified as positive. FP is the number of negative samples that are classified as positive. FN is the number of positive samples that are classified as negative. These can be clarified from the confusion matrix in table 1.
Fig. 4 shows the similar images of a query image using our proposed method. Top 20 similar images are shown in the figure. All of the 20 retrieved images are correct for the given query image. The top-left image is the query images, whose serial number is 600 in the dataset. The serial numbers of all the retrieved images are in the range 600-699. Since Corel-1K dataset contains images of same class in every hundred range, the retrieved images are similar to the query image. Similar images of another query image are shown in fig. 5. Among the top 20 retrieved images, 18 images are correctly retrieved.
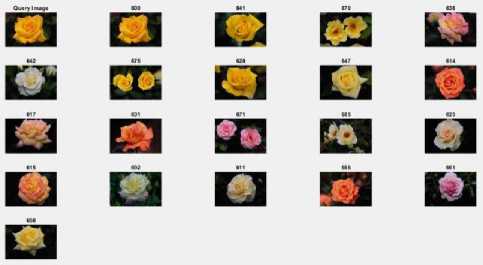
Fig.4. Similar images of a query image using our proposed method.
We use precision and recall to justify our method’s performance. Precision shows the percentage of samples that are classified as positives are actually such [6].
Table 1. Confusion Matrix
|
Predicted Class Actual Class |
Positive |
Negative |
|
Positive |
TP |
FN |
|
Negative |
FP |
TN |
To get an overall performance score of our proposed method, we calculate F-score. F-score reflects the values of both precision and recall. The formula of F-score is
2 x Precision x Recall
F =-------------
Precision + Recall
We also calculate the accuracy of our proposed method. Accuracy defines the ratio between the number of correct outputs and total number of outputs. The formula of accuracy is
Accuracy =
TP + TN
TP + TN + FP + FN
where TP , TN , FP and FN are the number of true positives, number of true negatives, number of false positive positives and number of false negatives respectively.
-
A. Performance Evaluation
To test our method on Corel-1K dataset, we choose first 20 images of each class as test images and remaining 80 images of each class as training images. We train KNN using the 800 images. Table 2 shows the confusion matrix ( M ) using k = 5. Now we calculate the precision, recall and accuracy values from the confusion matrix in table 2. Precision, recall and accuracy in (6), (7) and (9) respectively are used to determine the performance of binary classifier, but Corel-1K [4, 5] dataset has 10 classes. To calculate precision, recall and accuracy for our multiclass problem, we consider the class containing the current test image as positive class and remaining classes as negative class. Therefore we find the precision from the confusion matrix using the following formula:
M
Precision(p) = p-p— (10)
Z M , p i = 1
where M is the confusion matrix, p is the index of the positive class and i is the index of the rows. We use the following formula for finding recall from the confusion matrix:
M
Recall(p) = ^ p- , p Z M. j = 1
where M is the confusion matrix, p is the index of the positive class and j represents the columns. We use the following formula for finding accuracy from the confusion matrix:
10 10
M p , p + ZZ M- j
=1, j =1,
ACCUIaCyp) =------- 10-10---- * p-^ ------1-----
Mp, p+ZZ Mu+Z M, p+Z mp ,j i=1, j =1, i=1, j =1,
-
- * p j * p - * p j * p
where M , p , i , and j are the confusion matrix, index of the positive class, index of the rows and index of the columns respectively. Table 3 shows the precision, recall, F-score and accuracy values of our proposed method.
Table 2. Confusion Matrix ( M ) Using Our Proposed Method on Corel-1K Dataset
|
Predicted Class Actual Class |
Africa |
Beach |
Building |
Bus |
Dinosaur |
Elephant |
Flower |
Horse |
Mountain |
Food |
|
Africa |
7 |
5 |
4 |
0 |
0 |
0 |
0 |
0 |
4 |
0 |
|
Beach |
0 |
15 |
2 |
0 |
0 |
1 |
0 |
0 |
2 |
0 |
|
Building |
0 |
4 |
16 |
0 |
0 |
0 |
0 |
0 |
0 |
0 |
|
Bus |
0 |
4 |
5 |
11 |
0 |
0 |
0 |
0 |
0 |
0 |
|
Dinosaur |
0 |
0 |
0 |
0 |
20 |
0 |
0 |
0 |
0 |
0 |
|
Elephant |
3 |
1 |
1 |
0 |
0 |
13 |
0 |
0 |
2 |
0 |
|
Flower |
0 |
0 |
0 |
0 |
0 |
0 |
20 |
0 |
0 |
0 |
|
Horse |
0 |
1 |
1 |
0 |
1 |
2 |
0 |
15 |
0 |
0 |
|
Mountain |
3 |
4 |
2 |
0 |
0 |
1 |
0 |
0 |
10 |
0 |
|
Food |
1 |
5 |
8 |
0 |
0 |
2 |
0 |
0 |
2 |
2 |
Table 3. Performance Rate of Our Proposed CBIR Approach
|
Category |
Performance Rate |
||
|
Precision |
Recall |
Accuracy |
|
|
Africa |
0.50 |
0.35 |
0.90 |
|
Beach |
0.38 |
0.75 |
0.86 |
|
Building |
0.41 |
0.80 |
0.87 |
|
Bus |
1 |
0.55 |
0.96 |
|
Dinosaur |
0.95 |
1 |
1 |
|
Elephant |
0.68 |
0.65 |
0.94 |
|
Flower |
1 |
1 |
1 |
|
Horse |
1 |
0.75 |
0.98 |
|
Mountain |
0.50 |
0.50 |
0.90 |
|
Food |
1 |
0.10 |
0.91 |
|
Average |
0.742 |
0.645 |
0.932 |
|
F-score |
0.690 |
||
Table 4 shows the comparison of our proposed method with the methods in [7, 8, 14] in terms of precision, recall and F-score. In [7], color correlograms and edge direction histogram are used as image contents. HSV color histogram, discrete wavelet transform and edge histogram descriptor are used as image contents in [8]. Combination of Scale Invariant Feature Transform (SIFT) and geometric moments are used as image contents in [14]. The precision and recall values are also calculated on Corel-1K dataset in [7, 8, 14]. The chart in fig. 6 shows the comparison of precisions and the chart in fig. 7 shows the comparison of recalls for each class of Corel-1K [4, 5] dataset.
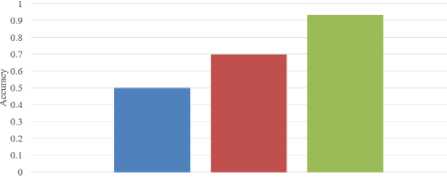
Table 5 shows the comparison between our proposed method and the method in [12, 13] in terms of accuracy. The method in [12] is based on color moments and wavelet packet entropy. Several combinations of feature
extraction methods are experimented in [13]. Combination of global and local features using gray-level co-occurrence matrix, SURF and color moments is found as the best approach based on the experiment in [13]. Both [12] and [13] evaluate their performances on Corel-1K [4, 5] dataset. The method in [12] only shows their precision and recall values. The method in [13] compares their result with [12] in terms of accuracy by calculating the accuracy value of [12]. The chart in fig. 8 shows the comparison of accuracies.
From table 4 and 5 and from fig. 6, 7 and 8, it is evident that our proposed method gives better performance than the methods in [7, 8, 12, 13, 14].
Table 4. Comparison of Our Proposed Method with the Methods in [7, 8, 14] in Terms of Precision, Recall and F-score
|
Category |
Method in [7] |
Method in [8] |
Method in [14] |
Our Proposed Method |
||||
|
Precision |
Recall |
Precision |
Recall |
Precision |
Recall |
Precision |
Recall |
|
|
Africa |
0.54 |
0.08 |
0.85 |
0.17 |
0.33 |
0.18 |
0.50 |
0.35 |
|
Beach |
0.42 |
0.06 |
0.50 |
0.10 |
0.23 |
0.12 |
0.38 |
0.75 |
|
Building |
0.44 |
0.07 |
0.75 |
0.15 |
0.32 |
0.23 |
0.41 |
0.80 |
|
Bus |
0.90 |
0.14 |
1 |
0.20 |
0.62 |
0.46 |
1 |
0.55 |
|
Dinosaur |
0.99 |
0.15 |
1 |
0.20 |
0.66 |
0.39 |
0.95 |
1 |
|
Elephant |
0.46 |
0.07 |
0.55 |
0.11 |
0.36 |
0.22 |
0.68 |
0.65 |
|
Flower |
0.81 |
0.12 |
0.95 |
0.19 |
0.38 |
0.22 |
1 |
1 |
|
Horse |
0.86 |
0.13 |
0.90 |
0.18 |
0.53 |
0.23 |
1 |
0.75 |
|
Mountain |
0.35 |
0.05 |
0.30 |
0.06 |
0.23 |
0.13 |
0.50 |
0.50 |
|
Food |
0.34 |
0.05 |
0.55 |
0.11 |
0.33 |
0.21 |
1 |
0.10 |
|
Average |
0.611 |
0.092 |
0.735 |
0.147 |
0.399 |
0.239 |
0.742 |
0.645 |
|
F-score |
0.160 |
0.245 |
0.299 |
0.690 |
||||
Table 5. Comparison of Our Proposed Method with the Methods in [12, 13] in Terms of Accuracy
|
Method |
Accuracy |
|
[12] |
0.50 |
|
[13] |
0.70 |
|
Our proposed method |
0.932 |
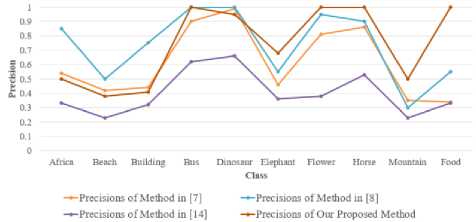
Fig.6. Comparison chart between our proposed method and the methods in [7, 8, 14] in terms of precision.
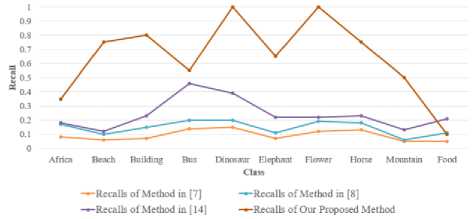
Fig.7. Comparison chart between our proposed method and the methods in [7, 8, 14] in terms of recall.
■ [12] ■ [ 13] ■ Our Proposed Method
Fig.8. Comparison chart between our proposed method and the methods in [12, 13] in terms of accuracy.
V. Conclusion
Our proposed CBIR method uses color layout descriptor (CLD) as color features and gray-level cooccurrence matrix (GLCM) as texture features. Shape features are neglected due to the high effect of noise on it. Cityblock distance is used here to find the k-nearest images of a query image. KNN is also used to determine the efficiency of our proposed method. Our method gives better result than some related works in terms of precision, recall, F-score and accuracy. The features of the images used in our system also provide better representation of images especially when images contain local dominant color and color pattern. Although CLD considers local information of images, some established local descriptors such as SIFT, SURF, FAST, BRISK have not been investigated in our work. SURF, FAST and BRISK have been investigated in [13], which make the system time- consuming. On the other hand, calculating CLD is faster than calculating SIFT, SURF, FAST and BRISK descriptor. CBIR system based on features which represent shapes without the effect of noise might bring better performance. Future scope of CBIR system is huge since CBIR is not only a standalone system but also a part of other large systems. For example, video processing, image based search system etc. Medical applications, biodiversity information systems, digital libraries etc [9] are also some sectors where CBIR is used. The more a CBIR system can see an image like human does, the more efficient it is. Better representation of image contents is unavoidable in this process.
References Content-Based Image Retrieval Using Color Layout Descriptor, Gray-Level Co-Occurrence Matrix and K-Nearest Neighbors
- D. A. Kumar and J. Esther, “Comparative study on CBIR based by color histogram, Gabor and wavelet transform,” International Journal of Computer Applications, vol. 17, no. 3, pp. 37-44, 2011.
- S. Laencina Verdaguer, “Color based image classification and description,” MS thesis, Universitat Politcnica de Catalunya, 2009.
- E. Gose, “Pattern recognition and image analysis,” Second printing, p. 159, 2000.
- J. Li and J. Z. Wang, “Automatic linguistic indexing of pictures by a statistical modeling approach,” IEEE Transactions on Pattern Analysis and Machine Intelligence, vol. 25, no. 9, pp. 1075-1088, 2003.
- J. Z. Wang, J. Li and G. Wiederhold, “SIMPLIcity: Semantics-sensitive integrated matching for picture libraries,” IEEE Transactions on Pattern Analysis and Machine Intelligence, vol. 23, no. 9, pp. 947-963, 2001.
- J. Han, M. Kamber and J. Pei, “Data mining: concepts and techniques,” Elsevier, p. 368, 2011.
- S. Somnugpong and K. Khiewwan, “Content-based image retrieval using a combination of color correlograms and edge direction histogram,” 2016 13th International Joint Conference on Computer Science and Software Engineering (JCSSE), 2016.
- A. Nazir, R. Ashraf, T. Hamdani and N. Ali, “Content based image retrieval system by using HSV color histogram, discrete wavelet transform and edge histogram descriptor,” 2018 International Conference on Computing, Mathematics and Engineering Technologies (iCoMET), 2018.
- J. A. da Silva Junior, R. Elias Marcal and M. Aurelio Batista, “Image retrieval: importance and applications,” Workshop de Visao Computacional - WVC, 2014.
- M. Tzelepi and A. Tefas, “Deep convolutional learning for content based image retrieval,” Neurocomputing, vol. 275, pp. 2467-2478, 2018.
- T, Kato, “Database architecture for content-based image retrieval,” in image storage and retrieval systems, vol. 1662, pp. 112-123, International Society for Optics and Photonics, 1992.
- S.M. M. Islam and R. Debnath, “An RST invariant image retrieval approach using color moments and wavelet packet entropy,” 2016 5th International Conference on Informatics, Electronics and Vision (ICIEV), pp. 747-752, 2016.
- M. F. Sadique, B. K. Biswas and S.M. R. Haque, “Unsupervised content-based image retrieval technique using global and local features,” 2019 1st International Conference on Advances in Science, Engineering and Robotics Technology (ICASERT), 2019.
- P. Srivastava and A. Khare, “Content-based image retrieval using scale invariant feature transform and moments,” 2016 IEEE Uttar Pradesh Section International Conference on Electrical, Computer and Electronics Engineering (UPCON), 2016.
- F. Ye, M. Dong, W. Luo, X. Chen and W. Min, “A new re-ranking method based on convolutional neural network and two image-to-class distances for remote sensing image retrieval,” IEEE Access, pp. 141498-141507, 2019.
