Convolutional Neural Network-based Stacking Technique for Brain Tumor Classification using Red Panda Optimization

Author: Blessa Binolin Pepsi M., Anandhi H., Karunyaharini S., Visali N.
Journal: International Journal of Information Technology and Computer Science @ijitcs
Article in issue: 5 Vol. 17, 2025.
Free access
In the healthcare field, the detection of critical diseases such as brain tumors is essential. A technique like traditional support vector machine has been commonly used for brain tumor classification. However, Processing and detecting brain tumors requires achieving high accuracy with shorter detection time and reduced complexity. To accomplish this, efficient feature selection is necessary, which can be based on various factors. A convolutional neural network-based stacking technique is introduced for effective brain tumor classification and prediction using Red Panda optimization. By efficiently extracting spatial data from medical images, a convolutional neural network is used in stacking to enhance thecapacity of our model for abnormality detection and classification in the prediction of brain tumors. Red panda optimization is a biologically inspired stochastic optimization algorithm used for the effective selection of significant features. This Technique improves the prediction accuracy in a shorter period and reduces the complexity by selecting significant features for a huge amount of data by employing effective optimization. This technique is tested on multiple standard datasets to assess our model’s performance. Our technique is compared to other optimization models such as Mutual information-based optimization and traditional particle swarm optimization for further validation. Our model showed an improvement in detection accuracy to 98% with a better reduction in detection time and complexity.
Big Data, Mutual Information, Feature Selection, Convolutional Neural Network, Brain Tumor Classification
Short address: https://sciup.org/15020017
IDR: 15020017 | DOI: 10.5815/ijitcs.2025.05.05
Text of the scientific article Convolutional Neural Network-based Stacking Technique for Brain Tumor Classification using Red Panda Optimization
The exponential growth of big data in the biological and healthcare sectors has come into concern. The healthcare industry has been greatly impacted by big data, especially in areas like disease detection, patient care units, and medical research [1] and [2]. An unusual group of cells inside the brain is called a brain tumor, which arises from unlimited cell division. This study utilized discrete wavelet transform and principal component analysis to improve tumor cell classification [3]. However, it did not efficiently differentiate between healthy and non-healthy tissues. Human brain tumors were categorized using deep learning, a machine learning technology that is used to solve a variety of challenging issues. Various data sources including Magnetic Resonance Imaging and genetic data are available for the efficient detection of various diseases [4]. Big data plays a major role in integrating diverse amounts of datasets from various resources of different domains in order to train and predict the condition of patients from medical histories and scanning images. Especially, in the field of Brain Tumor detection, various tumors are possible in some of them cancerous and others are non-cancerous. In the current wave of the healthcare field, there is a huge need for efficient time-saving techniques for detection of diseases with high accuracy but with low complexity and prediction time.
The task of organizing, maintaining, and evaluating large amounts of healthcare data is difficult and expensive. It is still challenging to provide a design for continuous tracking and understanding of such complicated data in the absence of a strong, foundational theory for description and analysis. Brain Tumor data are complex and sensitive and have multiple attributes that contribute to the accurate detection of tumors and reduce the detection time and complexity. It should be able to perform significant feature selection so that we can effectively reduce complexity and detection time.
A tremendous amount of work has been proposed for the effective detection of brain tumors. However, the detection time and complexity should be considered well while ensuring the detection accuracy. In the general case, the main technique that has played efficiently in brain tumor classification is the support vector machine classifier which significantly classifies the brain tumor as cancerous and non-cancerous. Techniques like Deep neural networks [5-6], and convolutional neural networks [7] play significant roles. But, as the amount of data increases, traditional support vector machine and other classifiers result in insufficient detection accuracy with a huge amount of time and complexity rises.
To address the issue of low accuracy in traditional classifiers, a stacking technique based on a convolutional neural network for effective brain tumor classification is introduced and to reduce processing time, Red Panda optimization effectively selects the most appropriate features which have a more significant impact on brain tumor classification.
Red Panda Optimization (RPO) is a relatively new technique inspired by the behavior of red pandas. It falls under the category of Bio-inspired Metaheuristic algorithms, meaning it imitates natural processes to solve complex optimization problems. Inspired by the foraging habits of red pandas, an endangered species found in the eastern Himalayas and southwest China, Red Panda Optimization (RPO) is a revolutionary metaheuristic algorithm. RPO was introduced recently and has drawn interest as a successful optimization method for handling challenging optimization issues in a variety of fields. This algorithm is designed to resemble the foraging technique used by red pandas, which entails searching the search space for food sources while taking into account both exploratory and exploitative factors [8]. Exploration and exploitation are the basis of Red Panda Optimization. RPO maintains a population of candidate solutions, each of which indicates a potential solution to the optimization issue, much like other nature-inspired algorithms. Through the use of mechanisms like random exploration and the exploitation of potential places in the search space, the algorithm iteratively updates the population. To arrive at a final prediction, stacking is a model ensemble strategy that uses a meta-learner to aggregate predictions from several algorithms, many of which are different in character. By utilizing the advantages of distinct models, this strategy may enhance performance by capturing a wider variety of patterns and minimizing overfitting. A Convolutional Neural Network (CNN) is a deep learning architecture designed to process structured grid-like data, such as images. It uses convolutional layers to automatically extract hierarchical features, pooling layers to reduce dimensionality, and fully connected layers for classification tasks. This makes it powerful for image recognition and analysis.
For validation of our model, performance on particle swarm optimization and mutual Information-based optimization has been observed. A computational technique called particle swarm optimization (PSO) optimizes a problem by repeatedly attempting to enhance a potential solution in light of a predetermined quality criterion [9]. The particle swarm optimization (PSO) was motivated by the coordinated movements of fish schools or flocks of birds. PSO involves imagining a swarm of particles moving along a problem space for the optimal solution. Every particle is a possible solution, and it records the best place it has ever found on its own as well as the best site the swarm as a whole has found. Based on this knowledge, the particles then modify their motion to balance exploring the search space with taking advantage of potential regions. The swarm can progressively converge on an ideal solution because of this cooperative strategy. PSO is a flexible optimization tool with natural inspiration. Even though it might not always identify the ideal answer, this method is effective in solving a variety of optimization issues.
The amount that indicates how much one random variable can reveal about another is called mutual information. It can be defined as the decrease in uncertainty about one random variable given information regarding another. It is a dimensionless quantity with units of bits. A significant reduction in uncertainty is shown by high mutual information, a small decrease by low mutual information, and an independent pair of random variables is shown by zero mutual information. Mutual Information value depicts the dependency of two attributes that directly influence the importance of an attribute so that we can reduce the features that are all less influential for the detection of brain tumors. Based on the mutual information score, relevant features can be updated using the vast amount of data. Optimization had to be done to select more relevant features [10].
Brain tumor classification using MRI images is a critical task in medical diagnostics that demands high accuracy and computational efficiency. Traditional machine learning methods, such as SVM and Logistic Regression, often struggle to handle the high-dimensional nature of MRI data, leading to suboptimal classification results. While optimization techniques like Mutual Informative Optimization (MIO) and Particle Swarm Optimization (PSO) have been employed to improve feature selection, these approaches face challenges such as premature convergence and an inability to capture interdependencies among features.
Recent advancements in convolutional neural networks (CNNs) have revolutionized image classification by automating feature extraction. However, the integration of CNNs with robust optimization strategies to enhance feature selection and classification performance remains underexplored. This study addresses these gaps by proposing a CNN-based stacking technique combined with Red Panda Optimization (RPO). Inspired by the foraging behavior of red pandas, RPO offers superior exploration and exploitation capabilities, overcoming the limitations of existing optimization methods.
The proposed system aims to reduce computational complexity and improve classification accuracy by selecting the most relevant statistical features from MRI images. Through extensive evaluation on three benchmark MRI datasets, the study demonstrates the efficacy of RPO in feature selection and its integration with CNN-based stacking for brain tumor classification. This novel approach has the potential to significantly advance early and accurate tumor diagnosis, ultimately improving patient outcomes.
The contributions of our proposed system are mentioned as follows:
• This paper achieves improved accuracy in brain tumor detection. This enhancement is crucial in the healthcare industry where high accuracy is essential for disease diagnosis.
• The performance of three optimization algorithms was analyzed considering the impact of feature selection on detection accuracy.
• Integration of big data analytics techniques with healthcare data, particularly in the context of brain tumor detection is proposed.
• Classification performance is evaluated using accuracy, precision, AUC, recall, and F-measure.
2. Related Works
The paper has been organized as follows. Section II describes the related works. Section III discusses the framework's proposed methodology. Section IV reports the experimental results and comments, whereas Section V briefly summarizes the proposed work.
Many studies have been performed regarding the efficient prediction of brain tumors. Dinov [11] studied a number of big data opportunities, problems, and software solutions for fusing distributed scientific computing, advanced analytics tools, and healthcare data. Additionally, examples of how to treat heterogeneous datasets using automated and semiautomated categorization approaches were given. On the other hand, brain tumors were not accurately detected.
Pereira [12] studied an automatic segmentation technique based on the CNN and applied intensity normalization. Accurate brain picture segmentation, however, required more work and time. With billions of cells, the brain is one of the human body's most complicated organs. An unusual group of cells inside the brain is called a brain tumor, which arises from unlimited cell division. Human brain tumors were categorized using deep learning, a machine learning technology that is used to solve a variety of challenging issues.
Using distinct kernel functions, Ramakrishnan and Sankara Gomathi [13] constructed the SVM to distinguish between images showing tumors and those that did not. There was no improvement in the nontumor image detection accuracy. Naik and Patel [14] proposed a brain tumor detection and classification system using a machine-learning decision tree algorithm. While their method aimed to predict various diseases in high-risk populations, it did not address the issue of storage complexity.
Zhang [15] proposed a new method for identifying pathological brains using wavelet packet Tsallis entropy, extreme learning machines, and the Jaya algorithm. While their approach provided us with a new solution, it suffered from longer processing times for brain tumor detection.
Manikandan Ramachandran [16] proposed a technique using MapReduce to Preprocess the attribute and to reduce the redundant irrelevant attributes and proposed a Minimum Quadrangle classification to effectively classify the brain tumor that results in whether the tumor is cancerous or not. However, the complexity can be further reduced by applying optimization.
In the case of optimization, Hadi Givi, Mohammad Dehghani, and Stepan Hubalovsky [17] proposed a new bio-inspired metaheuristic algorithm that optimizes based on the behavior of red pandas and its position results in a high ability to solve optimization problems in real-world applications.
To detect and separate brain tumor images, Aswathy [18] combined machine learning and the Support Vector Machine (SVM) learning method using a genetic algorithm. However, segmenting intricate structures proved challenging due to anatomical variance. Xue [19] carried out a survey on deep learning for automatic brain tumor diagnosis. Blanc-Durand [20] proposed an automatic lesion detection and segmentation method based on a Convolutional Neural Network (CNN), however performance did not increase. Torti [21] used the SVM technique to classify hyperspectral (HS) pictures; nevertheless, the result was suboptimal.
Lakshmi [22] created a method that uses a kernel classifier and a Support Vector Machine (SVM) to analyze brain pictures in order to detect brain cancers. Using structural analysis, Jayachandran and Dhanasekaran [9] provided a reliable strategy for classifying brain tumors in order to distinguish between tumor and non-tumor tissue. They did not, however, deal with the computational complexity problem. Menze [23] investigated this problem by modeling brain tissues using a generative probabilistic model. To identify lesion sites, they used expectation maximization and a Gaussian mixture. The study was unable to examine more in-depth data regarding brain tumors.
Existing approaches have challenges in detecting brain tumors, including precision, time, feature extraction, early detection, computation complexity, and performance efficiency. Our proposed system performs efficient optimization reducing the complexity while preserving sufficient accuracy and shows the results that our proposed system facilitates effective and timely decision-making for brain tumor detection.
While the related works section outlines various studies in the field of brain tumor classification using optimization techniques and deep learning models, it is important to highlight how the proposed method advances beyond these existing approaches. Most of the prior research relies on traditional optimization techniques, such as Particle Swarm Optimization (PSO) and Genetic Algorithms (GA), to fine-tune deep learning models, which, although effective, often struggle with computational efficiency and suboptimal feature selection. In contrast, our approach incorporates Red Panda Optimization (RPO), which is specifically designed to address the challenges of feature selection and computational complexity, enhancing model accuracy while reducing training time. Moreover, the integration of CNN-based stacking with RPO allows for a more robust combination of classifiers, outperforming single classifier models by leveraging the strengths of multiple algorithms. Unlike existing studies that primarily focus on the application of single optimization methods or standard classification models, our method presents a novel hybridization strategy that not only optimizes feature selection but also enhances classification accuracy through an advanced ensemble learning approach. This dual focus on optimization and model stacking represents a significant advancement over previous work, providing a more efficient and accurate solution for brain tumor classification.
3. Proposed Methodology
The proposed framework is designed to improve the overall detection accuracy in brain tumor images. Magnetic Resonance Images are used to detect the brain tumor. Various relevant features of the MRI images of the brain are extracted. The extracted overall features are optimized to select the most relevant features out of all features. The selected features are tested on various classification models.
-
3.1. Feature Extraction
-
3.2. Feature Selection
In brain tumor classification, feature extraction plays a crucial role in distinguishing healthy tissue from tumors and categorizing different tumor types. By extracting these focused features, the data becomes more manageable for processing. Itcan now focus on the key characteristics that differentiate healthy tissue from tumors, leading to more accurate classification. With a reduced set of relevant features, the algorithm can learn more effectively, identifying patterns that differentiate benign from malignant tumors or even classifying different tumor types based on their extracted characteristics. The objective is to convert the raw data into a smaller set of meaningful characteristics, such as edges in an image. These features are easier for machine learning algorithms to understand and use for tasks like classification or prediction.
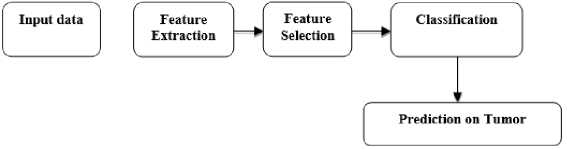
Fig.1. Overall workflow of proposed system
Feature selection is crucial when dealing with big data in machine learning. By carefully selecting relevant features, analysts can improve model performance and efficiency. This process removes redundant or irrelevant features that can add noise and disrupt learning. Feature selection techniques in big data often use scalable algorithms like filter methods based on statistical properties or embedded methods that include feature importance within the model training. This allows for efficient exploration of the high-dimensional feature space while maintaining interpretability and reducing computational costs associated with training models on massive datasets.
-
A. Hybrid Red Panda Optimization
Hybrid Red Panda Optimization is a bioinspired metaheuristic algorithm that imitates the way red pandas forage. Metaheuristics are a set of optimization techniques that aim fora near-optimal solution in a reasonable amount of time, rather than guaranteeing finding the global optimal solution [24]. It mimics the red panda's quest for food, a vital source [25]. The program keeps track of a population of people, or red pandas, that stand in for possible fixes for the optimization issue [26]. Every person has a fitness value that corresponds to how successfully they tackle the challenge [27].
The following are the main functions of Hybrid RPO:
-
• Red pandas naturally investigate their surroundings when they are searching for food.
-
• Once a particular area has been identified, red pandas tend to concentrate their search there. Hybrid RPO achieves this by prioritizing those with high fitness levels. These individuals are more likely to be chosen for additional research in their area, resulting in the refinement of viable solutions.
-
• Although red pandas are solitary foragers, they occasionally meet each other. Hybrid RPO addresses this by allowing individuals to communicate information by sharing information about newly identified food sources.
The specific processes of exploration, exploitation, and social interaction differ depending on the implementation [28]. It can identify effective answers in a fair number of iterations. The approach can be customized to different optimization problems by altering its parameters.
PHASE 1: Exploring Approach
The updating of a set of food positions with the global best candidate position should be performed using (1).
PFS i ^{ X k |k e {1, 2, . . , N} n F k < F i } U {X best } (1)
PFS i is the food source and X best is the position of best food source.
After updating the food position, the calculation of new member has to be done for each one using (2).
x fj ^ x i,j + r.(SFS i,j — I.X ij )
If the fitness function of the new position improved, we have to update the position with the best position using (3).
X i
-{
x f 1 + b
. xi
Ff < Fi else
Where x f 1is the new position after updating the best position and F^is the fitness function to be applied. The equation introduces a decreasing bias term that gradually reduces as the optimization process advances. At the beginning, the bias term is relatively high, which promotes exploration by allowing larger steps in the search space. As the number of iterations increases, the bias term diminishes, resulting in more exploitation by gradually reducing the step size and focusing on refining the search around promising regions.
PHASE 2: Stepping and taking a break
Now, based on the skill of climbing tree such as moving from one to another position we would further perform the calculation of new position and if the corresponding fitness function is improved, we have to update the new position using (4) and (5).
p2 , Ibj + r.(ubj - Ibj)
xfj ^xij+-—г— xi
'xf +b Ff < Fi xi else
Where, x f 2is the new position in the phase 2 and Ff is the fitness function in the phase 2.
b = a*(1-^)
Where, a is is a scaling factor, i represents the current iteration number, and T is the maximum number of iterations allowed.
Algorithm 1: CNN-Based Stacking with Red Panda Optimization (CSRPO)
Input: Magnetic Resonance brain Image data
Output: Classification of disease
Begin
Extract features on image data
Preprocess the features
Set the population size (N) and the number of iterations (T).
Set the initial population at random
Generate the initial Iteration
Evaluate the fitness function for each of the population.
Phase 1: Exploring Approach
Update the set of food positions for each ith CSRPO member using (1)
Select the selected food from the ith red panda at random.
Calculate the new position of the ithCSRPO member based on the 1st phase of CSRPO using (2)
Update the ith CSRPO member using (3)
Phase 2: Stepping and taking a break
Calculate the new position of the ithCSRPO member based on the 2nd phase of CSRPO using (4)
Update the ith CSRPO member using (5)
Calculate bias at each iteration using (6)
End
Save the best candidate solution found so far.
Phase 3: Classification on stacking
Define the base learners
Make predictions on the validation dataset using the base learners.
Create a new dataset for the meta learner by concatenating the predictions of the base learners.
Train the meta learner on the new dataset.
Make predictions on the test dataset using the meta learner
End.
-
B. Comparison on Other Optimization Models
The other optimization models such as particle swarm optimization and mutual informative optimization. These optimization models are observed and compared to validate the proposed model.
-
a. Particle Swarm Optimization (PSO)
The intelligent search method known as Particle Swarm Optimization (PSO) was motivated by the way animals behave in groups. Consider a group of birds flying in the sky. Each bird has some knowledge of its Environment and may have found a good number of seeds. By sharing this information with the birds of its group, the entire flock can collectively locate the best feeding area [29]. Particles iteratively explore the search space by modifying their locations and velocities based on this knowledge. As time goes on, the swarm moves closer to areas where there are better answers, imitating the flock's ability to locate the best food supply as a whole.
To update velocity:
V i (t + 1) = wv i (t) + е^^ + Xi(t)c2r2(Gbest(t) - Xi(t))) (7)
Where,v,(t) represents the velocity of particle, w represents the Inertia weight [30], c 1 represents the Cognitive coefficient,c2 represents the social coefficient, r1, r2 - Random numbers between 0 and 1, p1^)- represents the Personal Best position, and Gbest(t) represents the Global Best position.
To update position:
х ;( £ +1) =ход + v . (t+1) (8)
This equation simply adds the updated velocity to the current position of the particle to determine its new location in the search space [31].
-
b. Mutual Informative Optimization (MIO)
Mutual Informative Optimization starts with the calculation of the mutual information score for each extracted feature [32]. Depending on the MI score of each attribute, the most relevant feature can be filtered out for further tasks [33].
MI(A, B) = TiaeATlbeBprob(a,b) log
prob(a,b) prob(a)prob(b)
Where, the two random qualities "a" and "b" are represented by the marginal probability functions "prob(a)" and "prob(b)," respectively, where "E" is the entropy and "prob (a, b)" is the intersection function [34]. Features mapped with the corresponding MI scores and the irrelevant features can be reduced [35].
map (MI,/ Jut )=>reduce (MI,/ r ed)
With the mentioned resultant values, the MI criterion is used to eliminate the redundant attribute values [35], which are then represented mathematically as follows:
red_rf = M^A , ,В)-а Т^^М^)
The reduced features are denoted by “red_rf”, whereas the current set of sample features for weight factor "α" is represented by “samples” [37]. Tumor detection time is reduced by employing the MI reduction method to extract the reduced feature that is obtained as a result [38].
-
3.3. Classification of CNN-based Stacking
Stacking is a method of combining multiple classification or regression models into a single ensemble. Among the most well-known ensemble models are Bagging and Boosting [19]. A different approach called stacking looks into multiple models for the same issue [39].
Ensemble learning is improving forecast accuracy and robustness by combining predictions from multiple models. It tries to reduce mistakes and biases in individual models by using the ensemble's collective intelligence [40]. In ensemble learning, stacking is a strong strategy for combining the predictions of numerous base learners to increase the model's overall performance. When used to Convolutional Neural (CNNs), stacking improves the network's prediction capability by taking advantage of the diversity of different CNN models [41]. The input image contains pre-extracted features. It is fed into the convolutional model, that uses the local receptive field to create feature maps. Following convolution, the pooling layers simplify the output.
There are two forms of pooling: Max pooling and L2 pooling. Max pooling pools the maximal activation output into a 2x2 input region, whereas L2 pooling uses the square root of the sum of squares in the activation 2x2 region. Finally, the completely linked layers connect each layer of the maximum pooling layer to the output neurons [42].
Number of epochs:10
Dropout: Yes
Optimizer: Adam, learning rate=0.001, the parameter β: 0.9, Keep_prob:0.8
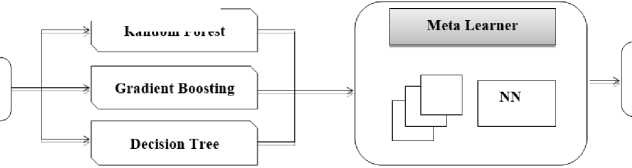
In the context of brain tumor classification using stacking with a Convolutional Neural Network (CNN) as the meta-learner and Random Forest, Gradient Boosting, and Decision Tree as base learners, the CNN layer architecture plays a crucial role in extracting meaningful features from medical images.
The initial convolutional layers are responsible for detecting low-level features like edges and textures. Subsequent convolutional layers capture increasingly complex patterns by combining features from previous layers. Pooling layers reduce spatial dimensions while retaining important information, aiding in translation and rotation invariance.
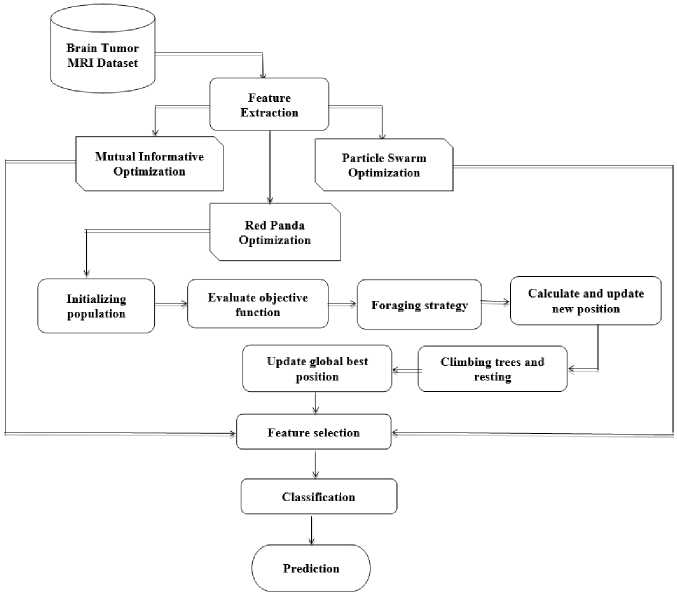
Fig.2. Procedural flow of proposed system
Base Learner
Random Forest
Input brain tumor data
Classification and Prediction
Fig.3. WorkFlow diagram of classification of brain data
Batch normalization ensures stable training by normalizing the activations. Dropout layers mitigate overfitting by randomly deactivating neurons during training. Finally, fully connected layers combine extracted features for classification, with the output layer providing probabilities of tumor presence. The entire network is optimized using the Adam optimizer, adjusting the model's parameters to minimize classification errors and improve performance.
This comprehensive architecture enables effective feature extraction and classification, leveraging the strengths of both CNNs and traditional machine learning algorithms for accurate brain tumor diagnosis. Furthermore, stacking enables the capture of complicated correlations in data that would be difficult to capture using a single CNN model alone [43]. Fig.3 shows the workflow of the classification phase.
Random Forest is an ensemble learning method based on decision trees. It offers robustness and scalability. Gradient Boosting iteratively improves decision trees' performance by minimizing errors, making it resilient to overfitting. Decision Trees are simple yet powerful models for classification and regression. Their diverse nature makes them suitable for stacking, as combining their predictions with a meta-learner enhances overall model accuracy and generalization across different datasets. Using CNNs for stacking in ensemble learning is a powerful way to improve the predictive performance of deep learning models [44]. Stacking improves the model's ability to grasp complex patterns in data by using qualities of many CNN models, resulting in more accurate predictions and superior generalization performance.
Other classification models are also used for the brain tumor prediction such as SVM [45], logistic regression, naive bayes, Random Forest. On overall performance analysis, CNN based stacking outperforms the other classification models.
In the context of brain tumor detection, big data analytics plays a crucial role in improving the accuracy and efficiency of the proposed method. The availability of large MRI datasets facilitates the extraction of a diverse set of features that capture the nuances of tumor characteristics. By leveraging the computational power of big data, our approach allows for real-time processing and analysis of MRI images, making it feasible to apply the method in clinical settings where quick and reliable results are critical. Furthermore, big data analytics aids in improving model generalization by providing a wide variety of tumor cases across different demographics, enabling the model to identify subtle patterns in tumor growth. Although challenges such as data imbalance and missing values persist, the proposed Red Panda Optimization-based CNN stacking method is designed to address these issues, ensuring that the model remains robust and accurate across large, complex datasets.
4. Results and Discussion
The resultant accuracy of the proposed strategy has been implemented and compared with each optimization strategy namely Mutual Informative Optimization, Particle Swarm Optimization, and CNN-based Stacking with Red Panda Optimization.
-
4.1. Dataset Description
This experimental study is implemented on various MRI image datasets in python. The statistical features have been extracted from the images. The applied datasets are taken from Kaggle dataset repository which includes the following. In the first dataset, Implemented Images are in JPG format. Positive and Negative which can be further encoded to 0 and 1 was used to label tumor types for classification and further prediction [46]. In the second dataset, Implemented Images are in JPG format. yes and no which can be further encoded to 0 and 1 was used to label tumor types for classification and further prediction [47]. In the third dataset, Images are in jpgformat then extracted as features and class that defines whether the image is tumor or non-tumorous (1- Tumor, 0-Non-Tumor) [48]. Table 1 shows the various Dataset used and its description. Image features are extracted and classified as first order and second order attributes. The first order attributes are the standard statistical features of the brain tumor images [49]. The second order attributes are the derived attributes from the first order attributes of brain tumor images. In brain tumor image analysis, first-order features serve as fundamental elements for comprehending the characteristics of the tumor area. They offer essential data for machine learning models to distinguish between healthy and tumorous tissues.
-
• Siar: This dataset contains MRI images of brain tumors in JPG format. The tumor types are labeled as 'Positive' (Tumor) and 'Negative' (Non-Tumor), which are then encoded as 1 and 0 respectively. It includes a total of 7001
images, with 3201 labeled as positive (tumor) and 3800 labeled as negative (non-tumor). This dataset is selected due to its large size and variety of tumor cases.
-
• Btd: This dataset also consists of MRI images in JPG format, with the labels 'Yes' (Tumor) and 'No' (Non-Tumor), encoded as 1 and 0 respectively. The total number of images is 3762, with 1683 labeled as positive (tumor) and 2080 labeled as negative (non-tumor). It is chosen due to its diverse set of tumor types, which enables robust model training.
-
• Br35H: This dataset contains 3000 MRI images, with an equal distribution of positive and negative labels (1500 each). The images are used to predict the presence of brain tumors. This dataset is selected for its balanced class distribution, which helps mitigate class imbalance issues during model evaluation.
Preprocessing Steps :
-
• Normalization: All MRI images are preprocessed to ensure that pixel intensity values are normalized to a range of [0, 1], which helps in faster convergence during training.
-
• Resizing: The images are resized to a standard size of 224x224 pixels, maintaining aspect ratios where possible, to ensure consistency across all input data.
-
• Data Augmentation: To address overfitting and enhance model generalization, we applied data augmentation techniques such as rotation, flipping, zooming, and shifting, generating additional training samples from the original dataset.
-
• Feature Extraction: Statistical features (first-order and second-order attributes) are extracted from the images using texture analysis. First-order features include mean, variance, and skewness, while second-order features include energy, entropy, and homogeneity. These features are used as input to the classification models.
-
4.2. Performance Metrics
Table 1. Dataset description
|
Dataset |
No. of Positive Labels |
No. of Negative Labels |
Total Images |
|
Siar |
3201 |
3800 |
7001 |
|
Btd |
1683 |
2080 |
3762 |
|
Br35H |
1500 |
1500 |
3000 |
In first-order attributes, Mean indicates the overall brightness of the tumor region. Variance captures the spread of pixel intensities within the tumor. Standard deviation is more reliable than variance for understanding intensity variation within the tumor region. A positive skew indicates more high-intensity pixels compared to low, potentially suggesting active tumor growth. A high kurtosis indicates a sharper peak around the mean intensity, potentially suggesting a well-defined tumor border. In the second order attributes, potential tumor locations can be identified with the use of high contrast regions. Energy can identify regions that may harbor malignancies. Tumor regions typically have lower ASM values. Entropy can be used to locate possible tumor sites. Finding areas with low homogeneity can help pinpoint possible tumor locations. The difference in intensity between two pairs of pixels in an image is quantified as dissimilarity. The linear relationship between pixel brightness at various spatial locations in an image is measured by correlation. tumor regions have irregular development patterns and irregular features, they may look coarser than the surrounding healthy tissue. Table 2 shows the various features that have been selected in each optimization techniques.
The confusion matrix's phrases are used to evaluate the performance and efficacy of the recommended task. The general measurement of testing performances is accuracy, in addition to that we have to further analyze the impact and behavior of the result as in each data and overall classification model.We have performed the F-measure and AUC curve as the additional metrics that ensure the complete performance of our model and help to analyze the behavior better. Table 3 shows the confusion matrix that have referred to calculate the performance metrics.
Accuracy =
TP+TN
TP+TN+FP+FN
Table 2. Feature selection
|
Mutual Informative Optimization |
Particle Swarm Optimization |
Red Panda Optimization |
|
|
No. of Feature Selected |
7 |
6 |
8 |
|
Selected Features |
ASM, Energy, Entropy, Homogeneity, Dissimilarity, Kurtosis, Skewness. |
Energy, Dissimilarity, Correlation, Standard Deviation, Variance, Contrast. |
Mean, Contrast, Dissimilarity, Standard Deviation, Entropy, Energy, Homogeneity, Dissimilarity. |
Accuracy: It is one of the well-used metrics for performance.
Real-World Implication : While accuracy is a key metric for evaluating the overall performance of a classification model, in clinical applications, it is essential to balance accuracy with other metrics to avoid misclassification, especially in cases where false negatives (missed tumors) or false positives (incorrectly diagnosing healthy tissue as a tumor) can have severe consequences. Our model achieves high accuracy, but its clinical relevance lies in how well it minimizes false positives and false negatives, ensuring that patients are neither misdiagnosed nor overlooked for early intervention.
Clinical Application : In the context of brain tumor detection, accuracy directly influences the reliability of the diagnostic system. A higher accuracy means that the model is less likely to make errors in tumor detection, which could impact clinical decision-making. However, it’s critical to consider the trade-off between accuracy and the risk of false negatives, which could delay critical treatment.
Specificity = ™
r J TN+FP
Precision: It depicts the true predictions that are correct.
Precision =
TP
TP+FP
Recall: It measures the percentage of true instances that our model correctly identifies in the overall true samples in our datasets.
TP
Recall(sensitivity) =
TP+FN
F-measure: It calculates the precision and recall harmonic means.
2*precision*recall
F-measure = precision+recall
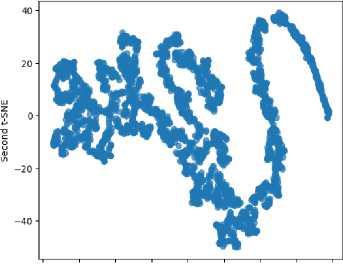
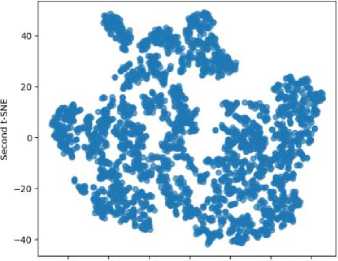
t-SNE -It is a non-linear, unsupervised dimensionality reduction method for high-dimensional data visualization and exploration.
KL(P||Q) =ВДрц1од?
q ij
Table 3. Confusion matrix
|
Positive Detection |
Negative Detection |
|
|
Positive |
True Positive – True Positive |
False Negative – False Negative |
|
Negative |
False Positive – False Positive |
True Negative – True Negative |
Table 4. Performance analysis of mutual informative optimization
|
SVM |
Logistic Regression |
Naïve Bayes |
Random Forest |
Stacking |
|
|
Accuracy |
78.10 |
96.81 |
91.60 |
97.76 |
97.98 |
|
Precision |
82.02 |
99.10 |
99.10 |
99.13 |
99.19 |
|
Recall |
68.45 |
94.22 |
82.01 |
96.05 |
96.07 |
|
F1-Score |
74.62 |
96.06 |
90.95 |
98.04 |
98.12 |
t-SNE Visualization of Brain Tumor Dataset
-80 -60 -40 -20 0 20 40 60 80
First t-SNE
Fig.4. t-sne on Mutual informative optimization
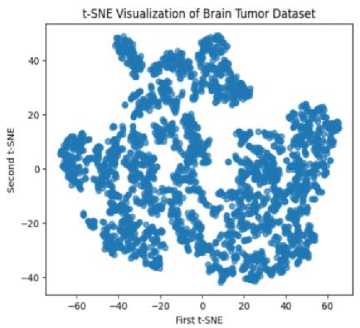
Fig.5. t-sne on particle swarm optimization t-SNE Visualization of Brain Tumor Dataset
■60 -40 -20 0 20 40 60
First t-SNE
Fig.6. t-sne on CNN based stacking red panda optimization
Table 5. Performance analysis of particle swarm optimization
|
SVM |
Logistic Regression |
Naïve Bayes |
Random Forest |
Stacking |
|
|
Accuracy |
97.04 |
96.81 |
90.11 |
96.81 |
97.15 |
|
Precision |
99.67 |
99.67 |
91.92 |
97.19 |
97.78 |
|
Recall |
95.12 |
94.09 |
87.11 |
96.52 |
96.52 |
|
F1-Score |
97.79 |
96.09 |
89.76 |
97.79 |
97.79 |
Table 6. Performance analysis of CNN-based stacking with red panda optimization
|
SVM |
Logistic Regression |
Naïve Bayes |
Random Forest |
Stacking |
|
|
Accuracy |
77.04 |
95.96 |
92.02 |
98.01 |
98.19 |
|
Precision |
78.90 |
99.05 |
93.12 |
1.0 |
1.0 |
|
Recall |
70.89 |
92.89 |
89.67 |
96.18 |
96.18 |
|
F1-Score |
94.06 |
95.14 |
91.56 |
98.78 |
98.78 |
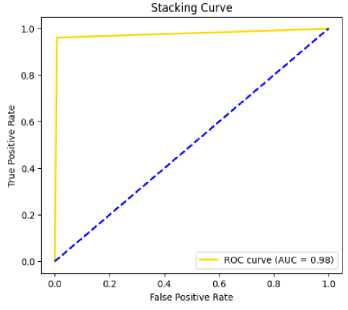
Fig.7. AUC curve on stacking on MIO
Fig.8. AUC curve of stacking on PSO
Fig.9. AUC curve of stacking on CSRPO
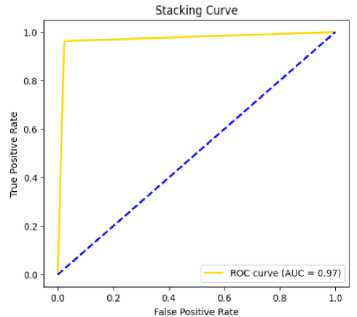
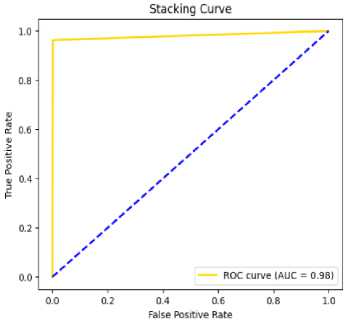
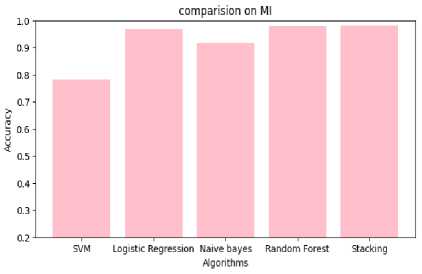
Fig.10. Comparison of performance on MIO
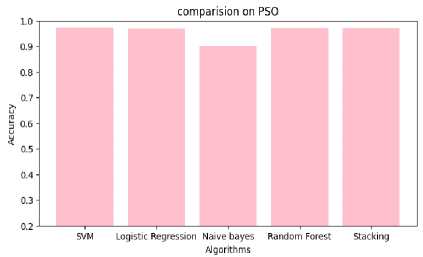
Fig.11. Comparison of performance on PSO
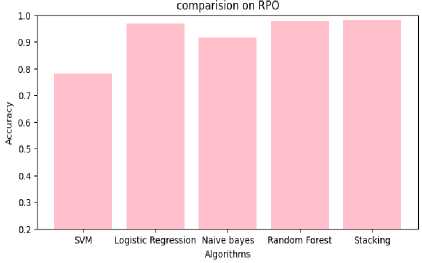
Fig.12. Comparison of performance on CSRPO
Table 7. Analysis of feature selection accuracy
|
Mutual Informative Optimization |
Particle Swarm Optimization |
Red Panda Optimization |
|
|
Accuracy |
97.76 |
97.15 |
98.19 |
Table 8. Comparative analysis – Accuracy measure
|
With Feature Selection |
Without Feature Selection |
||
|
Mutual Informative Optimization |
Particle Swarm Optimization |
Red Panda Optimization |
|
|
97.78 |
97.15 |
98.19 |
92.89 |
Table 9. Comparative analysis on optimization techniques
|
Optimization Technique |
Accuracy |
Precision |
Recall |
F1-Score |
Feature Selection |
Computational Time |
|
Red Panda Optimization |
98.19% |
1.00 |
96.18% |
98.78% |
8 features |
2.5 minutes |
|
Genetic Algorithm (GA) |
97.03% |
0.98 |
95.14% |
96.54% |
9 features |
3.2 minutes |
|
Ant Colony Optimization (ACO) |
96.89% |
0.96 |
94.75% |
95.83% |
7 features |
4.1 minutes |
|
Grey Wolf Optimizer (GWO) |
96.56% |
0.95 |
93.42% |
94.89% |
6 features |
3.5 minutes |
|
Whale Optimization Algorithm (WOA) |
97.10% |
0.97 |
94.82% |
96.02% |
8 features |
3.0 minutes |
|
Particle Swarm Optimization (PSO) |
97.15% |
0.97 |
96.52% |
97.79% |
6 features |
3.0 minutes |
|
Mutual Information Optimization (MIO) |
97.76% |
0.99 |
96.07% |
97.98% |
7 features |
2.7 minutes |
4.3. Comparative Analysis
5. Conclusions
Table 4,5,6 shows the performance analysis of each model that depicts CSRPO outperforms other models. Tables 7 and 8 shows the analysis of feature selection accuracy that depicts the accuracy improvement in CSRPO. Fig 7,8,9shows the AUC curve of Optimization models on each classification model. CNN-based Stacking with Red Panda optimization performs well. Fig 10,11,12 shows the comparison of various classification models. Here, CSRPO performs well compared to other classification models.
The use of deep and convolutional neural networks has mostly been proved to be greatly quicker than traditional machine learning techniques, high computing cost and time are still challenging obstacles in brain tumor classification. Our proposed system has aimed to solve these issues to improve accuracy through performing feature selection, and to reduce the complexity and time thereby applying the Mutual Informative Optimization, Particle Swarm Optimization, and CNN-based Stacking with red panda Optimization. This study presents a convolutional neural network-based stacking technique optimized with Red Panda Optimization for brain tumor classification. The proposed model achieves an accuracy of 98.19%, outperforming existing approaches in terms of classification performance. The integration of the Red Panda Optimization algorithm demonstrates its efficacy in fine-tuning model parameters for enhanced accuracy. The proposed system has been tested on three main MRI image datasets by extracting statistical features. The CNN-based Stacking with Red Panda Optimization has efficiently performed feature selection. The selected features have applied to multiple classification models which includes Support vector machine, Logistic Regression, Naïve Bayes, Stacking based on convolutional neural network. This also helped to reduce the detection time and complexity to satisfactory level.
Our approach aids in the early detection of brain tumors. Furthermore, we plan to incorporate domain adaptation techniques to enhance the model's robustness across different imaging devices and clinical settings in future ensuring scalability and applicability.
