Correlation between global left ventricular myocardial work efficiency and prognosis within 1 year follow up in patients after ST-segment-elevation myocardial infarction

Author: Ebaid H.H.A., Eldin El rabat Kh.A.e., Abdelfattah I.M.A., Elsayed Ali A.A.E.
Journal: Cardiometry @cardiometry
Section: Original research
Article in issue: 30, 2024.
Free access
Background: Global left ventricular (LV) myocardial work effi-ciency (GLVMWE); the ratio of constructive to wasted work in all LV segments, reflects the efficiency by which mechanical energy is expended during the cardiac cycle. Global LV myocardial work efficiency (GLVMWE) can be derived from LV pressure-strain loop analysis incorporating both noninvasively estimated blood pressure recordings and echocardiographic strain data.
Glvmwe, stemi, gls, mw, gwe
Short address: https://sciup.org/148328267
IDR: 148328267 | DOI: 10.18137/cardiometry.2024.30.2735
Text of the scientific article Correlation between global left ventricular myocardial work efficiency and prognosis within 1 year follow up in patients after ST-segment-elevation myocardial infarction
Hany Hassan Ahmed Ebaid, Khaled Ahmed Emad Eldin El Rabat, Ibrahim Mohammed Attia Abdelfattah, Amr Abd Elmordy Elsayed Ali. Correlation Between Global Left Ventricular Myocardial Work Efficiency and Prognosis Within 1 Year Follow up in Patients After ST-Segment–Elevation Myocardial Infarction. Cardiometry; Issue No. 30; February 2024; p. 27-35; DOI: 10.18137/cardiometry.2024.30.2735; Available from: http://www.
Left ventricular performance has traditionally been assessed by ejection fraction (EF), which has been demonstrated to be a prognostic parameter in numerous studies. However, EF is notably subjective, with various limitations and wide interobserver variability [1]. Echocardiography has constantly evolved with the help of new hardware and software systems. Speckle tracking imaging with global longitudinal strain (GLS) is increasingly utilized to assess even subtle myocardial dysfunction as this is a less angle and operator dependent method. Although it is a novel and well-validated method for clinical utility in the assessment of cardiac diseases, it remains limited by its load dependency [2]. Increasing the afterload may decrease GLS and lead to false conclusions about LV contractility. A meta-analysis of 24 studies showed that variations in afterload and blood pressure can affect the normal range of strain values [3].
Following this concept, a new echocardiographic tool called myocardial work (MW), which measures the LV pressure–strain relationship through a nonin-vasive method, has evolved. Work is calculated as force applied over length, while myocardial work is calculated as LV pressure applied over strain, which explains why this method does not calculate the actual LV work but is a valid approximation of it. Russel et al. were the first to develop this tool to assess segmental and global myocardial work by introducing blood pressure with a noninvasive method. In their study, the LV pressure– volume loop correlated well with the pressure–strain loop (PSL) in patients with left bundle branch block (LBBB) and desynchrony as well as in patients with ischemic heart disease [4]. MW is an alternative tool to assess cardiac mechanics and a less load-dependent, noninvasive method for LV performance evaluation as it incorporates both LV afterload and deformation [5].
Chan et al. , [6] applied myocardial work by LV pressure–strain analysis in a cohort of patients referred to coronary angiography. The patients were subdivided into three main groups: controls, hypertensives, and patients with cardiomyopathy. Although the groups are unbalanced, their study shows interesting results, particularly in hypertensive patients with a systolic blood pressure >160 mmHg. In this group, the global work index was significantly higher when compared with controls despite GLS and LVEF being normal and relatively unchanged. The findings confirm the inability of the traditional methods to detect increased performance and load imposed on the myocardium.
Aim
To assess the correlation between the global left ventricular myocardial work efficiency and prognosis within 1 year follow up in patients after ST-Segment– Elevation myocardial infarction (STEMI).
PATIENTS AND METHODS
This prospective cohort study was conducted at Cardiology Department of International medical center (IMC), Cairo, Egypt and Benha university hospitals on 100 patients presented with ST-Segment–Elevation Myocardial Infarction (STEMI) within 48-hours from hospital admission during the period from February 2022 to July 2023. Informed consent was obtained from the patients before enrollment of the study. The protocol was applied for approval of Benha Research Ethics Committee (number 1017).
Patients presented with ST-Segment–Elevation Myocardial Infarction (STEMI) within 48-hours from hospital admission and patients with sinus rhythm were included in the study. Patients with significant aortic valve stenosis or left ventricular outflow tract (LVOT) obstruction, patients with atrial fibrillation, patients with diastolic dysfunction grade III or IV, patients with hemodynamic instability, patients refusal, massive obesity (obesity class III) with body mass index 40 and more, and poor Echo window were excluded.
Methods
All patients were subjected to the following: full history taking, full clinical examination, standard 12 leads surface ECG, routine laboratory investigations including CBC, ALT and bilirubin, Serum creatinine, Lipid profile, Peak of High sensitive cardiac Troponin I (Hs-cTnI) within 24 hours and GRACE (Global Registry of Acute Coronary Events) Score assessment (7).
ECHOCARDIOGRAPHY:
-
• For assessment of Ejection fraction (EF), left ventricular global longitudinal strain (GLS) and Global Left Ventricular Myocardial Work Efficiency (GLVMWE) (Global Work Efficiency (GWE) to be done within 48-hours of hospital admission.
-
• Patients were scanned in the left lateral decubitus position. Standard 2D grayscale and Doppler images were acquired using a commercially available system (Vivid E95, GE Vingmed Ultrasound) equipped with M5S transducers and analyzed offline using EchoPAC version 204 software (GE Vingmed Ultrasound). All recordings and measurements were made according to current guidelines.
-
• Images from the apical four, two-chamber and long-axis views were acquired with a frame rate of 40-80 frames/sec to assess LV GLS by speckle-tracking echocardiography. Left ventricular GLS was measured using EchoPAC version 204 software (GE Vingmed Ultrasound) and averaged from the peak systolic longitudinal strain of all 17 segments [8].
Myocardial Work Efficiency Analysis : is done for assessment of [Global Left Ventricular Myocardial Work Efficiency (GLVMWE) (Global Work Efficiency (GWE)].
Left ventricular Myocardial Work (LV MW) is a novel, speckle tracking based method that evaluates LV work and is estimated by employing brachial artery blood pressure and LV global longitudinal strain (GLS). GWE was calculated as the sum of the construc- tive work in all LV segments, divided by the sum of the constructive and wasted work in all LV segments [9].
Preserved and reduced GWE : In order to define a parameter as preserved and reduced GWE, a cutoff value of GWE was derived from the ROC curve for the GWE data at baseline for detection of development of MACE during one year follow up period which was 87% with 62% sensitivity, 92% specificity and AUC 0.878 ( P value < 0.0001 ) and patients were classified into two groups, preserved GWE group with GWE ≥87% and reduced GWE group with GWE <87%.
Treatment : All patients received guideline-directed medical therapy (GDMT). Coronary angiography was done for: primary percutaneous coronary intervention (PCI) for infarct-related artery (IRA), routine revascularization for non-IRA lesions in multivessel disease (MVD) (which was defined as ≥ 1 vessel with >50% luminal stenosis) before hospital discharge according to 2017 ESC guidelines for the management of acute myocardial infarction in patients presenting with STEMI. [10].
Follow Up : Patients were followed up at the outpatient clinic according to the institutional protocol for one year for major adverse cardiovascular events (MI, HF, need for myocardial revascularization, stroke, and death) and echocardiography.
Statistical Analysis:
Data were analyzed using SPSS software version 18 (USA). The parametric data expressed as mean ± SD. The statistical comparisons between different groups were carried out using unpaired Student’s t-test for parametric data. Categorical data were represented by frequency and percentage, as well as was compared by fisher exact (X2) test and chi square test. Paired student t was used. Pearson correlation was done to assess the association between parameters. ROC Curve analysis was used in prediction of MACE incidence among the studied groups. The level of significance will be identified at P<0.05 [11].
RESULTS
Our study included 100 patients with acute ST-seg-ment elevation myocardial infarction and were divided according to cutoff value of global left ventricular myocardial work efficiency (GWE) with 87% to preserved (GWE ≥87%) and reduced GWE (GWE <87%).
-
• Group I: preserved GWE (GWE ≥87%): which included 61(61%) patients.
-
• Group II: reduced GWE (GWE <87%): which included 39(39%) patients.
I – Comparison between preserved and reduced GWE regarding demographic data and risk factors.
Statistical analysis showed non-significant difference between the two groups regarding demographic data and risk factors except age which was higher in reduced GWE than preserved GWE ( P=0.007 for Age ). Table (1).
Table (1)
Comparison between preserved and reduced GWE regarding demographic data and risk factors.
|
Variables |
preserved GWE (N=61) |
Reduced GWE (N=39) |
T |
P |
|
Age |
44.8 ± 5.9 |
48.4 ± 7.1 |
2.7 |
0.007 |
|
Gender Male |
43(70.5%) |
28(71.8%) |
X2=0.02 |
0.88 |
|
HTN |
22(36%) |
14 (35.9%) |
X2=0.001 |
0.98 |
|
DM |
6(9.8%) |
5 (12.8%) |
X2=0.21 |
0.64 |
|
Smoker |
19(31.1%) |
15(38.5%) |
X2=2.8 |
0.45 |
|
+VE FH of IHD |
Yes 27(44.3%) |
Yes 18(46.2%) |
X2=0.03 |
0.85 |
Data are represented as mean ± SD or Number (%). Data are analyzed using independent t test, chi square test. FH: family history. HTN: hypertension. DM: diabetes mellitus. IHD: ischemic heart disease.
II – Comparison between preserved
and reduced GWE regarding labs data:
Statistical analysis showed non-significant difference between the two groups regarding labs data except peak of Hs-cTnI which was higher in reduced GWE than preserved GWE which showed significant difference between both groups. (P=0.008 for peak of Hs-cTnI). Table (2).
Table (2)
Comparison between preserved and reduced GWE regarding labs data.
|
Variables |
Preserved GWE (N=61) |
Reduced GWE (N=39) |
t |
P |
|
TLC 10*6/dl |
9.8 ± 4.5 |
11.9 ± 6.8 |
1.85 |
0.06 |
|
Hb g/dl |
15.1 ± 1.8 |
14.9 ± 1.48 |
0.57 |
0.56 |
|
Platelets 10*6/dl |
293 ± 55.1 |
277.2 ± 66.7 |
1.2 |
0.2 |
|
Serum Creatinine mg/dl |
0.9 ± 0.1 |
0.92 ± 0.15 |
0.8 |
0.42 |
|
ALT IU/L |
38.5 ± 15.3 |
39.9 ± 23.2 |
0.36 |
0.71 |
|
Variables |
Preserved GWE (N=61) |
Reduced GWE (N=39) |
t |
P |
|
Total Bilirubin mg/dl |
0.9 ± 0.2 |
0.99 ± 0.29 |
1.83 |
0.06 |
|
Peak Hs-cTnI within 24 hs ng/L |
20784.3 ± 4246.9 |
23461.1 ± 5697 |
2.68 |
0.008 |
|
Total Cholesterol mg/dl |
189.8 ± 37.5 |
200.1 ± 40.8 |
1.3 |
0.19 |
|
LDL-cholesterol mg/dl |
120.8 ± 33.6 |
124.5 ± 35.7 |
0.5 |
0.6 |
|
HDL-cholesterol mg/dl |
34.4 ± 8.7 |
35.1 ± 7.4 |
0.41 |
0.67 |
|
Triglyceride mg/ dl |
157.5 ± 36.8 |
163.4 ± 39.1 |
0.76 |
0.44 |
Data are represented as mean ± SD or Number (%). Data are analyzed using independent t test. TLC: Total leukocyte count. HB: Hemoglobin. ALT: Alanine transaminase. Hs-cTnI :high sensitive cardiac troponin I.
-
III – Comparison between preserved and reduced GWE regarding GRACE score , ECG and coronary angiography data:
Statistical analysis showed that GRACE score was higher, the anterior STEMI was more frequent, patients came later and the LAD coronary artery was the most frequently involved culprit vessel in reduced GWE than preserved GWE which showed significant statistical difference between both groups. (P=0.001, 0.03 and 0.001 for GRACE score, ECG data and coronary angiography data for both symptoms onset to ballon time and culprit vessel respectively). Table (3).
Table (3)
Comparison between preserved and reduced GWE regarding GRACE score , ECG and coronary angiography data.
|
Variables |
Preserved GWE (N=61) |
Reduced GWE (N=39) |
t |
P |
|
GRACE score |
110.3 ± 10.8 |
125.5 ± 19.7 |
4.9 |
0.001 |
|
ECG data: *Anterior leads *non-anterior: inferior inferior + lateral inferior + posterior I + aVL |
15(24.6%) 46 (75.4%) 18(29.5%) 9(14.8%) 11(18%) 8(13.1%) |
32 (82%) 7 (18%) 0(0%) 4(10.3%) 2(5.1%) 1(2.6%) |
Fischer Exact |
0.03 |
|
CA data: *symptoms onset to ballon time (minutes) |
155.3±18.9 |
189.7±26.3 |
7.6 |
0.001 |
|
Variables |
Preserved GWE (N=61) |
Reduced GWE (N=39) |
t |
P |
|
**LAD culprit vessel |
15(24.6%) |
32(82%) |
X2=31.5 |
0.001 |
|
*** MVD |
26(42.6%) |
17(43.6%) |
X2=0.009 |
0.92 |
Data are represented as mean ± SD or Number (%). Data are analyzed using independent t test, Fischer exact test or chi square test. CA: coronary angiography. MVD: multivessel disease.
-
IV – Comparison between preserved and reduced GWE regarding treatment:
Statistical analysis showed non-significant difference between the two groups regarding treatment data. Table (4).
Table (4)
Comparison between preserved and reduced GWE regarding treatment data.
|
Variables |
Preserved GWE (N=61) |
Reduced GWE (N=39) |
X2 |
P |
|
On Aspirin n.(%) |
61 (100%) |
38 (97.4) |
0.1 |
0.74 |
|
On P2Y12I n.(%) |
61 (100%) |
39 (100%) |
- |
1 |
|
On Statin n.(%) |
61 (100%) |
39 (100%) |
- |
1 |
|
On BB n.(%) |
57 (93.4%) |
36 (92.3%) |
0.04 |
0.82 |
|
On ACEI or ARBs n.(%) |
56 (91.8%) |
37 (94.9%) |
0.34 |
0.55 |
Data are represented as mean ± SD or Number (%). Data are analyzed using chi square test. BB: beta blockers.
-
V – Comparison between preserved and reduced GWE regarding echocardiography data at baseline:
Statistical analysis showed significant difference between the two groups regarding EF, GLS and GWE at baseline which were lower in reduced GWE group with (P=0.001 for all). Table (5).
Table (5)
Comparison between preserved and reduced GWE regarding echocardiographic data at baseline.
|
Variables |
Preserved GWE (N=61) |
Reduced GWE (N=39) |
t |
P |
|
LV EF % |
56.3 ± 8.5 |
43.4 ± 9.5 |
7.1 |
0.001 |
|
GLS -ve |
16.5 ± 3.0 |
9.5 ± 3.4 |
10.8 |
0.001 |
|
GWE % |
94.1 ±2.1 |
79.2 ± 6.7 |
16.2 |
0.001 |
Data are represented as mean ± SD. Data are analyzed using independent t test. LV EF: Left ventricular ejection fraction. GLS: Global longitudinal strain. GWE: Global Work Efficiency.
VI – Comparison between preserved and reduced GWE regarding echocardiography after 1 year follow up:
Statistical analysis showed significant difference between the two groups regarding EF, GLS and GWE after 1 year follow up which were lower in reduced GWE group with (P=0.001 for all). Table (6).
Table (6)
Comparison between preserved and reduced GWE regarding echocardiographic data after one year follow up.
|
Variables |
Preserved GWE (N=69) |
Reduced GWE (N=27) |
t |
P |
|
LV EF % |
57.5± 8.5 |
45.3 ± 8.1 |
6.4 |
0.001 |
|
GLS -ve |
17.2 ± 3.1 |
10.5 ± 2.8 |
9.7 |
0.001 |
|
GWE %. |
95.4 ± 1.6 |
82.4 ± 5.3 |
18.4 |
0.001 |
Data are represented as mean ± SD. Data are analyzed using independent t test.
VII – Comparison between echocardiographic data at baseline and after 1 year follow up in overall patients:
Statistical analysis showed significant difference between the two groups regarding EF, GLS and GWE at baseline and after 1 year follow up which were higher after 1 year follow up with (P=0.02, 0.006 and 0.001 for LVEF, GLS and GWE respectively). Table (7).
Table (7)
Comparison between echocardiographic data at baseline and after 1 year follow up in overall patients.
|
Overall patients |
||||
|
At Baseline (N= 100) |
After one year (N= 96) |
t |
P |
|
|
LV EF % |
51.5 ± 9.5 |
54.5 ± 9.1 |
2.2 |
0.02 |
|
GLS -ve |
15.1 ± 4.2 |
16.7 ± 3.9 |
2.7 |
0.006 |
|
GWE %. |
92.1 ± 1.4 |
93.6 ± 3.3 |
4.2 |
0.001 |
Data are represented as mean ± SD. Data are analyzed using paired student t test.
VIII – Comparison between preserved and reduced GWE regarding major adverse cardiovascular events (MACE) data:
Statistical analysis showed significant difference between the two groups regarding MACE data which occurred more frequent in reduced GWE with (P=0.017). Table (8).
Table (8)
Comparison between preserved and reduced GWE regarding MACE data.
|
Variables |
Preserved GWE (N=61) |
Reduced GWE (N=39) |
X2 |
P |
|
MACE Positive: |
5(8.2%) |
10(25.6%) |
5.6 |
0.017 |
|
MI |
2 (3.3%) |
2 (5.1%) |
0.2 |
0.64 |
|
HF |
1 (1.63%) |
3 (7.7%) |
2.3 |
0.13 |
|
Revascularization |
1 (1.63%) |
1 (2.56%) |
0.1 |
0.74 |
|
Stroke |
0 (0%) |
1 (2.56%) |
0.15 |
0.71 |
|
Death |
1 (1.63%) |
3 (7.7%) |
2.3 |
0.13 |
Data are represented as Number (%). Data are analyzed using chi square test.
IX – Comparison between echocardiographic data at baseline and after 1 year follow up in MACE negative patients:
Statistical analysis showed significant difference between the two groups regarding EF, GLS and GWE at baseline and after 1 year follow up in MACE -ve patients which were higher after 1 year follow up with (P=0.013, 0.04 and 0.001 for LVEF, GLS and GWE respectively). Table (9).
Table (9)
Comparison between echocardiographic data at baseline and after one year follow up in MACE Negative patients.
|
MACE Negative (N=85) |
||||
|
At baseline |
After one year |
t |
P |
|
|
EF % |
53.2 ± 9.5 |
56.9 ± 9.9 |
2.5 |
0.013 |
|
GLS -ve |
15.5 ± 4.1 |
16.9 ± 4.8 |
2.0 |
0.04 |
|
GWE % |
92.4 ± 3.3 |
94.2 ± 2.5 |
4.0 |
0.001 |
Data are represented as mean ± SD. Data are analyzed using paired student t test.
X – Comparison between echocardiographic data at baseline and after 1 year follow up in MACE positive patients.
Statistical analysis showed significant difference between the two groups regarding EF, GLS and GWE at baseline and after 1 year follow up in MACE +ve patients which were lower after 1 year follow up with
(P=0.008, 0.03 and 0.001 for LVEF, GLS and GWE respectively). Table (10).
Table (10)
Comparison between echocardiographic data at baseline and after one year follow up in MACE Positive patients.
|
MACE Positive (N=15) |
||||
|
At baseline |
After one year |
t |
P |
|
|
EF % |
40.5 ± 9.3 |
31.2 ± 8.7 |
2.8 |
0.008 |
|
GLS -ve |
8.5 ± 3.0 |
6.4 ±2.1 |
2.2 |
0.03 |
|
GWE % |
76.9 ± 4.6 |
69.4 ± 3.7 |
4.9 |
0.001 |
Data are represented as mean ± SD. Data are analyzed using paired student t test.
XI – The power of GWE in prediction of MACE incidence among the studied patients:
ROC curve was done for GWE data at baseline for prediction of developing MACE during follow up period. A cutoff value below 87% at baseline had an increased incidence for developing MACE during one year follow up period with 62% sensitivity, 92% specificity and AUC 0.878 (P<0.0001). Table (11), Figure (1).
Table (11)
The power of GWE in prediction of MACE incidence among the
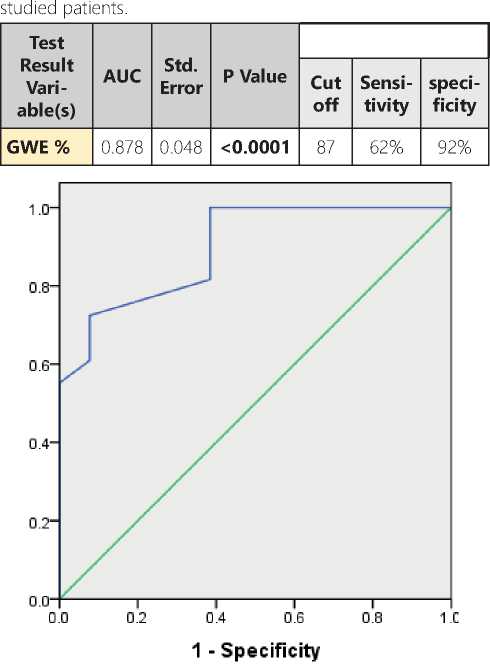
Figure (1): ROC curve of GWE at baseline in prediction of MACE incidence among the studied group.
DISCUSSION
Ischemic heart disease remains as an important cause of death worldwide, and patients with acute myocardial infarction face a substantial risk of additional cardiovascular events, including heart failure. Infarct size and left ventricular (LV) dilation and dysfunction increase the risk of heart failure and cardiovascular mortality. In clinical practice, assessment of LV systolic function with LV ejection fraction (EF) remains as a widely recognized prognostic marker. However, its limitations are well known (i.e., limited reproducibility and geometric assumptions) [10, 11].
Two-dimensional speckle-tracking echocardiography–derived LV global longitudinal strain (GLS) has demonstrated incremental value over LV EF to predict prognosis after ST-segment–elevation myocardial infarction (STEMI). However, both LV EF and LV GLS are load-dependent parameters, and their assessment is influenced by heart rate and systolic blood pressure, which have also been associated with outcomes after STEMI [12, 13].
The assessment of myocardial work indices based on 2-dimensional speckle-tracking echocardiography takes into consideration the loading conditions by integrating blood pressure measurements to generate a pressure-strain curve. Specifically, global LV myocardial work efficiency (GLVMWE), which combines the measurement of constructive and wasted work, provides information on global LV performance. However, the association of this novel parameter with outcomes after STEMI has not been studied [14].
The purpose of this study was to assess the correlation between the global left ventricular myocardial work efficiency and prognosis within 1 year follow up in patients after ST segment–elevation myocardial infarction.
Our results demonstrated that patients with reduced GWE were significantly older than preserved GWE patients, while other demographic data and risk factors were non-significant between the two groups.
Lustosa et al. [9] who studied 507 patients (384 men [76%]; mean age, 61±11 years) with STEMI to assess GLVMWE and long term prognosis in patients after STEMI. The patients were divided according to the cutoff value of GLVMWE associated with an excess of mortality as assessed with spline curve analysis which was 86%. The clinical characteristics of patients divided according to the presence of preserved (≥86%) versus reduced (<86%) GLVMWE are assessed. Reduced GLVMWE was observed in 126 patients (25%), with a median value of 81% (interquartile range, 77%–83%). Patients with reduced GLVM-WE were significantly older in the form of 60±11 years vs 64±12 with P<0.001, HTN was 34% vs 49% with P=0.005, DM was 5% vs 10% with P=0.067, family history with IHD was 45% vs 41% with P=0.416, smoking was 47% vs 40% with P=0.203 in preserved GWE vs reduced GWE.
Our results showed that there was no significant difference between preserved and reduced GWE groups regarding labs data except peak of high sensitive cardiac Troponin I ( Hs-cTnI ) within first 24 hours which was significantly higher in reduced GWE than preserved GWE group.
This was concordant with Lustosa et al. [15] as he did a retrospective study included 150 patients (111 men, mean age: 60 ± 10 years) with STEMI treated with primary percutaneous coronary intervention (PCI). They were divided into GWE normal and GWE reduced groups, based on reference values from the EACVI NORRE study; Reduced GWE was observed in 23% of patients, Those with reduced GWE had significantly higher values of CK [3033.62 U/L (±2003.47) vs. 1308.47 U/L (±1309.07); P<0.001] and troponin T [8.43 μg/L (±6.73) vs. 3.49 μg/L (±4.36); P<0.001)] at baseline.
Our results showed that patients with reduced GWE group had significantly a higher GRACE score, more frequent anterior STEMI, came more later from symptoms onset and the LAD coronary artery was the most frequently involved culprit vessel than in preserved GWE group patients. While there was no significant difference between two groups regarding treatment data.
That was concordant with Lustosa et al. [9] as he demonstrates that patients with preserved GLVMWE had a non- left anterior descending (LAD) coronary artery culprit lesion; while reduced GLVMWE were significantly older, had a higher heart rate, had a higher GRACE risk score, and the left anterior descending (LAD) coronary artery was the most frequently involved culprit vessel. Also, there was no significant difference between both groups regarding treatment data in the study.
There was significant difference between preserved and reduced GWE groups regarding EF, GLS and GWE at baseline and after one year follow up data; EF, GLS and GWE were lower in reduced GWE than preserved GWE group.
In agreement with our study, Lustosa et al. [9] in STEMI patients with reduced GWE (<86%) showed more myocardial damage with significantly lower LV EF with more impaired LV GLS and lower GWE compared with preserved GWE (≥86%).
Also, Lustosa et al. [15] demonstrated that there were significantly lower values of left ventricular ejection fraction [46% (±8) vs. 59% (±8); P<0.001] and impaired global longitudinal strain [-13.03% (±2.54) vs. -18.04% (±2.75); P<0.001] at 3 months in abnormal GWE than normal GWE.
MACE occurred significantly in reduced GWE compared to preserved GWE group as it was occurred in 10 (25.6%) patients in reduced GWE group vs 5(8.2%) patients in preserved GWE group.
In Coisne et al. [16] 244 patients admitted to Lille University Hospital for acute myocardial infarction (AMI) were included. One-month following AMI, comprehensive transthoracic echocardiography (TTE) was performed to assess parameters of myocardial function. Patients were then followed for major events: cardiovascular death, heart failure, and unplanned coronary revascularization. After a median follow-up of 681 (interquartile range: 538–840) days, major events occurred in 26 patients (10.7%). After adjustment, GWE was the only TTE parameter independently associated with long-term occurrence of major events (P=0.02). A GWE value,91% was selected to identify patients at higher major events risk (hazard ratio: 95% confidence interval)=2.94 (1.36–6.35), P=0.0041.
Also, in Scărlătescu et al. [17] who included 50 young patients (<55 years), mean age of 44.78, with STEMI treated by primary PCI and 10 healthy control subjects (for miRNA results validation). Patients were divided into MACE group (9 cases, accounting for 18%) and non-MACE group (41 cases, accounting for 82%). All four myocardial work indices (baseline values) were independent predictors for MACE at follow-up The four myocardial work indices had good prediction potential for MACE, with an AUC greater than 0.7 in the ROC curve analysis as follows: AUC 0.932 (95% CI), p < 0.0001 for GWI; AUC 0.862 (95% CI), p = 0.001 for GCW; AUC 0.812 (95% CI), p = 0.004 for GWW and AUC 0.932 (95% CI), p < 0.0001 for GWE.
Our results showed that EF, GLS and GWE were significantly increased after one year follow up in overall patients and in MACE negative patients, while
Issue 30. February 2024 | Cardiometry | 33
EF, GLS and GWE were significantly decreased after one year follow up in MACE positive patients.
In agreement with our study, Lustosa et al. [18] did a study for Three-hundred and fifty patients (265 men; mean age 61 ± 10 years) with STEMI treated with primary percutaneous coronary intervention (PCI) and guideline-based medical therapy were retrospectively evaluated GLVMWI were recorded at baseline within 48 hours post-primary PCI and 3 months follow-up. LV ejection fraction (from 54 ± 10% to 57 ± 10%, p < 0.001), GWI (from 1449 ± 451 mm Hg% to 1953 ± 492 mmHg%, p < 0.001), GCW (from 1624 ± 519 mm Hg% to 2228 ± 563 mm Hg%, p < 0.001) and GWE (from 93% (interquartile range (IQR) 86%-95%) to 95% (IQR 91%-96%), p < 0.001) improved significantly at 3 months follow-up with no significant difference in GWW (from 101 mm Hg% (IQR 63-155 mm Hg%) to 96 mm Hg% (IQR 64-155 mm Hg%); p = 0.535). the evolution of GWI, GCW and GWE in STEMI patients may reflect myocardial stunning, whereas the stability in GWW may reflect permanent myocardial damage and the development of non-viable scar tissue.
Scărlătescu et al. (17) showed that patients with MACE at follow-up had lower 2D LVEF (32.88 ± 5.79 vs. 43 ± 6.6 p = 0.000) and more impaired LVGLS (-8.85 ± 1.58 vs. -13.8± 2.8, p < 0.0001) from baseline.
In the current study, GWE was a good predictor for detection of development of MACE in STEMI patients during follow up:
Our results showed that the STEMI patients with GWE below 87% at baseline had an increased incidence for developing MACE during one year follow up with 62% sensitivity, 92% specificity and AUC 0.878.
In agreement with our study, Timoteo et al. [19] study which included 132 consecutive patients admitted with an ST-segment-elevation acute myocardial infarction (mean age 62 ± 12 years; 76% men) that survived to discharge were retrospectively analyzed. LVEF, GLS and all LVMW indices were measured by transthoracic echocardiography before discharge (4.9 ± 2.4 days after admission). All patients had at least a two-year follow-up (mean follow-up of 820 ± 155 days). They showed that in the two-year follow-up, 6 patients died, there were 18 patients with MACE, and 3 patients were hospitalized with heart failure. He confirmed that for all-cause mortality, GWE and GWI showed better discrimination com- pared to GLS , with a cut-off of 83% and 1066 mmHg% (P< 0,001) respectively.
In addition, Coisne et al. [16] showed that GWE was the only TTE parameter independently associated with long-term occurrence of major events (P=0.02). A GWE value 91% was selected to identify patients at higher major events risk (hazard ratio: 95% confidence interval)=2.94 (1.36–6.35), P=0.0041.
Also, Lustosa et al. [9] showed that patients with reduced GLVMWE (<86%) showed higher cumulative event rates for all-cause mortality (14.9% vs. 4.7%; log-rank p=0.001) in comparison to patients with preserved GLVMWE (≥86%).
Limitations
The sample size is relatively small with short term follow up period.
Conclusion
References Correlation between global left ventricular myocardial work efficiency and prognosis within 1 year follow up in patients after ST-segment-elevation myocardial infarction
- B urns, A.T.; La Gerche, A.; D’Hooge, J.; et al. (2010). Left ventricular strain and strain rate: Characterization of the effect of load in human subjects. Eur. J. Echocardiogr., 11, 283–289.
- Boe, E.; Skulstad, H.; Smiseth, O.A (2019). Myocardial work by echocardiography: A novel method ready for clinical testing. Eur. Heart J. Cardiovasc. Imaging, 20, 18–20.
- Yingchoncharoen, T.; Agarwal, S.; Popovi´c, Z.; et al. (2013). Normal Ranges of Left Ventricular Strain: A Meta-Analysis. J. Am. Soc. Echocardiogr., 26, 185– 191.
- Russell K, Eriksen M, Aaberge L, et al. (2013). Assessment of wasted myocardial work: a novel method to quantify energy loss due to uncoordinated left ventricular contractions. Am J Phys- iol Heart Circ Physiol; 305:H996-1003.
- Galli, E.; Leclercq, C.; Fournet, M.; et al. (2018a). Value of Myocardial Work Estimation in the Prediction of Response to Cardiac Resynchronization Therapy. J. Am. Soc. Echocardiogr., 31, 220–230.
- Chan J, Edwards NFA, Khandheria BK, et al. (2019). A new approach to assess myocardial work by non-invasive left ventricular pressure–strain relations in hypertension and dilated cardiomyopathy. Eur Heart J Cardiovasc Imaging; 20:31–9.
- Keith A A Fox, Omar H Dabbous, Robert J Goldberg, et al. (2006). Prediction of risk of death and myocardial infarction in the six months after presentation with acute coronary syndrome: prospective multinational observational study (GRACE). BMJ. 2006 Nov 25;333(7578):1091.
- Lustosa, R. P., van der Bijl, P., El Mahdiui, M., et al. (2020). Noninvasive myocardial work indices 3 months after ST-segment elevation myocardial infarction: prevalence and characteristics of patients with postinfarction cardiac remodeling. Journal of the American Society of Echocardiography, 33(10), 1172-1179.
- Lustosa, R. P., Butcher, S. C., van der Bijl, P., et al. (2021b). Global Left Ventricular Myocardial Work Efficiency and Long Term prognosis in Patients After ST-Segment–Elevation Myocardial Infarction. Circulation: Cardiovascular Imaging.;14: e012072.
- Ibanez B, James S, Agewall S, et al. (2018). 2017 ESC Guidelines for the management of acute myocardial infarction in patients presenting with ST-segment elevation: The Task Force for the management of acute myocardial infarction in patients presenting with ST-segment elevation of the European Society of Cardiology (ESC). Eur Heart J;39:119–177.
- Peacock, J., & Peacock, P. (2011). Oxford handbook of medical statistics. Oxford university press.
- McNamara RL, Kennedy KF, Cohen DJ, et al. (2016). Predicting in-hospital mortality in patients with acute myocardial infarction.J Am Coll Cardiol.; 68:626–635.
- Cikes M, Solomon SD (2016). Beyond ejection fraction: an integrative approach for assessment of cardiac structure and function in heart failure.Eur Heart J.; 37:1642–1650.
- Russell K, Eriksen M, Aaberge L, et al. (2012). A novel clinical method for quantification of regional left ventricular pressure-strain loop area: a non-invasive index of myocardial work. Eur Heart J;33:724-33.
- Lustosa, R., Van Der Bijl, P., El-Mahdiui, M., et al. (2019). P1473 Global work efficiency 3 months after ST-segment elevation myocardial infarction: prevalence and characteristics of patients with reduced global work efficiency. European Heart Journal, 40(Supplement_1), ehz748-0238.
- Coisne, A., Fourdinier, V., Lemesle, G., et al. (2022). Clinical significance of myocardial work parameters after acute myocardial infarction. European Heart Journal Open, 2(3), oeac037.
- Scărlătescu, A. I., Barbălată, T., Sima, A. V., et al. (2022). miR-146a-5p, miR-223-3p and miR-142-3p as Potential Predictors of Major Adverse Cardiac Events in Young Patients with Acute ST Elevation Myocardial Infarction–Added Value over Left Ventricular Myocardial Work Indices. Diagnostics, 12(8), 1946.
- Lustosa, R. P., Fortuni, F., van der Bijl, P., et al. (2021). Changes in global left ventricular myocardial work indices and stunning detection 3 months after ST-segment elevation myocardial infarction. The American Journal of Cardiology, 157, 15-21.
- Timoteo, A., Moura Branco, L., Galrinho, A., et al. (2022). Usefulness of myocardial work to predict longterm hard cardiovascular outcomes after ST-segment elevation acute myocardial infarction. European Heart Journal-Cardiovascular Imaging, 23(Supplement_1), jeab289-029.
