Crash modeling of bridge railings: impact of post spacing on performance

Author: Storozhev S.A., Vafaeva Kh.M.
Journal: Строительство уникальных зданий и сооружений @unistroy
Article in issue: 3 (112), 2024.
Free access
The object of research is a barrier side one-way bridge railing with a height of 1.1 meters and a rack spacing of 2 meters. The purpose of this work is to analyze the effectiveness of the finite element method (FEM) in modeling the collision between a bus and the bridge railing, and to determine the impact of rack spacing on the railing's performance characteristics, such as dynamic deflection and working width.
Finite element method (fem), explicit dynamics, bridge barriers, post spacing, dynamic deflection, computational modeling, road safety, metal efficiency, impact analysis, bridge railing design
Short address: https://sciup.org/143183404
IDR: 143183404 | UDC: 69 | DOI: 10.4123/CUBS.112.5
Моделирование аварий мостовых перил: влияние расстояния между столбами на производительность
Объектом исследования является ограждение одностороннего моста высотой 1,1 м с шагом стоек 2 м. Целью данной работы является анализ эффективности метода конечных элементов (МКЭ) при моделировании столкновения автобуса с ограждением моста, а также определение влияния шага стоек на эксплуатационные характеристики ограждения, такие как динамический прогиб и рабочая ширина.
Text of the scientific article Crash modeling of bridge railings: impact of post spacing on performance
The design of road barriers, particularly bridge parapets, demands meticulous attention to detail given their crucial role in ensuring road safety. A critical aspect of this design process is determining the optimal spacing between the posts of bridge parapets, which must balance structural integrity and costeffectiveness. However, the impact of this parameter on the performance characteristics of barriers, such as their resistance to impact loads, energy absorption capacity, and overall structural safety, remains inadequately explored, necessitating further investigation.
Developing and optimizing bridge parapets, considering their performance characteristics, directly influences road safety and the economic viability of infrastructure projects. As traffic volumes increase and the diversity of vehicle types expands, numerical methods such as the Finite Element Method (FEM)
enable the simulation of structural behavior under various crash scenarios. This, in turn, offers the opportunity to reduce material consumption and production costs without compromising safety, serving as a strong motivation for further in-depth study.
FEM is a powerful numerical modeling tool widely used in engineering calculations to solve complex problems involving differential equations. FEM is particularly relevant when analyzing dynamic processes, such as simulating vehicle collisions with road barriers. Despite the widespread application of FEM in various fields, the optimization of road barrier parameters using this method remains an understudied problem. In particular, the influence of parameters such as post spacing on the performance characteristics and material consumption of structures requires more detailed investigation.
Existing research primarily focuses on using FEM for dynamic analysis and material strength assessment. These studies simulate collisions, evaluate deformation and energy, and model vehicle safety interactions with the environment. FEM is becoming essential for developing safe and efficient vehicles, enabling assessment of structural behavior under various conditions and facilitating parameter optimization.
Building on this foundation, studies [1] and [2] investigate ship collisions using numerical simulations, while [3] analyzes the influence of material properties on collision simulation results. A method for real-time modeling of deformation and failure in rigid materials is introduced in [4]. Research on vehicle safety, including speed estimation, pedestrian safety, and bumper impact, is presented in [5]– [7]. Studies [8] and [9] simulate impact loads on electric vehicle components and optimize energyabsorbing elements. The influence of materials and speed on bumper behavior is analyzed in [10].
Studies [11]–[16] contribute to transportation safety by providing data for safer vehicles and infrastructure. Composite materials for ballistic shields are evaluated in [11], while a new method for determining motorcycle speed in collisions is developed in [12]. The impact of train speed and support structure on bridge collisions is analyzed in [13], and coupling device strength and its influence on train stability are studied in [14]. All studies employ modeling and optimization methods to enhance performance and safety. Concrete with iron ore tailings is investigated in [15], while a synchronous reluctance motor for a centrifugal pump is developed and optimized in [16]. Crash tests of a vehicle with a lighting support are simulated in [17], and the effectiveness of a cable barrier on an inclined surface is confirmed in [18]. The characteristics of rolling resistance of high-speed rubber tracks are studied in [19].
Article [20] optimizes a four-wheel drive chassis for uneven surfaces, and [21] studies the introduction of spiral coils into reinforced concrete piles. Anchor failure in high-strength concretes with metal fibers is analyzed in [22].
A series of investigations have evaluated the performance and safety of various bridge types under different conditions. A numerical evaluation in [23] demonstrated the significant structural degradation of concrete bridges exposed to fire. An analysis of 150 miles of side traffic barriers in [24] led to the development of a statistical model identifying optimal dimensions for box beam barriers to reduce crash severity. Paper [25] reviews the resilience of coastal bridges, predicting their behavior under extreme conditions and proposing novel restoration strategies. An examination of crash test data in [26] on transition safety barrier systems identified Test 3-21 as the most severe, noting lower occupant impact velocities for heavy vehicles. Using LS-DYNA finite element simulations, an assessment in [27] of truck collisions with curved railings revealed that increased curvature and impact angle enhance safety. An evaluation in [28] of safety risks associated with rigid far-side walls in Slovakian tunnel emergency bays recommended geometric modifications to reduce impact severity. A novel assembled rolling guardrail (A-R.G) was introduced in [29] and demonstrated superior performance compared to traditional guardrails through LS-DYNA simulations. Paper [30] investigated the effect of cross-section shapes on wind response and aeroelastic stability in long-span suspension and cable-stayed bridges, comparing four shapes through numerical simulations and wind tunnel tests.
While existing research focuses on dynamic analysis and material strength, a critical gap exists in optimizing post spacing in bridge railings. This study aims to address this by proposing solutions based on numerical modeling and optimization.
Research Object: Bridge railings employed in road barriers, specifically their structural components such as posts and panels.
Research Objective: To develop optimized bridge railing designs that prioritize safety and efficiency during collisions while minimizing material costs, with a particular emphasis on post spacing.
Research Tasks:
-
• Comprehensive review of existing FEM-based models for simulating bridge railing collisions.
-
• Identification of key parameters influencing bridge railing performance under impact conditions. Storozhev, S. A.; Vafaeva, Kh. M.
Crash Modeling of Bridge Railings: Impact of Post Spacing on Performance;
-
• Development and validation of a FEM model to assess the impact of post spacing on railing performance.
-
• Optimization of railing parameters to achieve optimal safety and cost-effectiveness through numerical experimentation.
-
• Formulation of design recommendations for engineers based on research findings.
This research framework offers a comprehensive and rigorous approach to modeling and optimizing bridge railings, with a specific focus on the critical role of post spacing in enhancing both safety and performance.
-
2 Methods
A finite element analysis (FEA) was conducted to simulate the interaction between a bus and a bridge parapet. A detailed computational model was developed, encompassing:
-
• Parapet model: Composed of individual elements including posts, handrails, energy-absorbing consoles, and beams. Each element was discretized into a collection of finite elements (e.g., triangular or quadrilateral plates).
-
• Bus model: A simplified geometric model was employed, considering essential characteristics such as mass, dimensions, and stiffness.
The finite element method is predicated on several fundamental principles:
-
1. Discretization: The computational domain is subdivided into finite elements—simple geometric shapes such as triangles or quadrilaterals in two dimensions and tetrahedra, prisms, or cubes in three dimensions.
-
2. Approximation: Within each element, a local approximation of the solution is constructed using basis functions (typically polynomials) and their coefficients, ensuring continuity across element boundaries.
-
3. Equation assembly: The element-level equations are assembled into a global system of linear or nonlinear algebraic equations.
-
4. Equation solution: The resulting system of equations is solved numerically using techniques from linear or nonlinear algebra.
-
5. Post-processing: The numerical results are visualized, analyzed, and interpreted to gain insights into the solution behavior at various points within the domain.
FEA, particularly in the context of explicit dynamics, is a versatile tool for modeling various aspects of road safety, including collisions, material deformation, and the structural response of vehicles and infrastructure under crash conditions. However, it is essential to recognize that road safety is a multifaceted field, and FEA can be applied to address a wide range of challenges within this domain.
-
Figure 1 illustrates the general configuration of the bridge parapet.
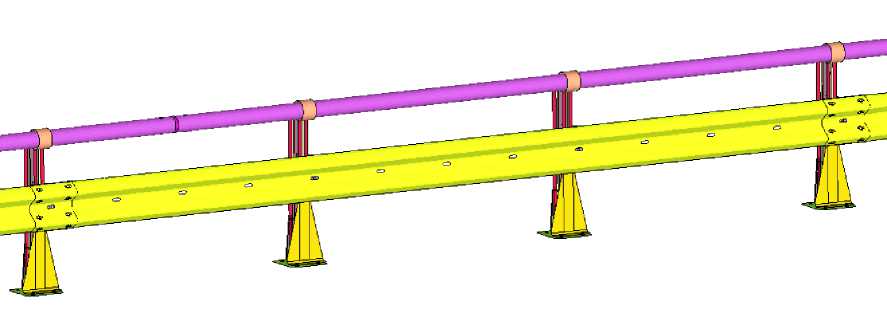
Fig. 1 - General view of the bridge parapet
The bridge parapet consists primarily of:
• Bridge posts
• Handrails
• Energy-absorbing consoles
• Wave beam sections.
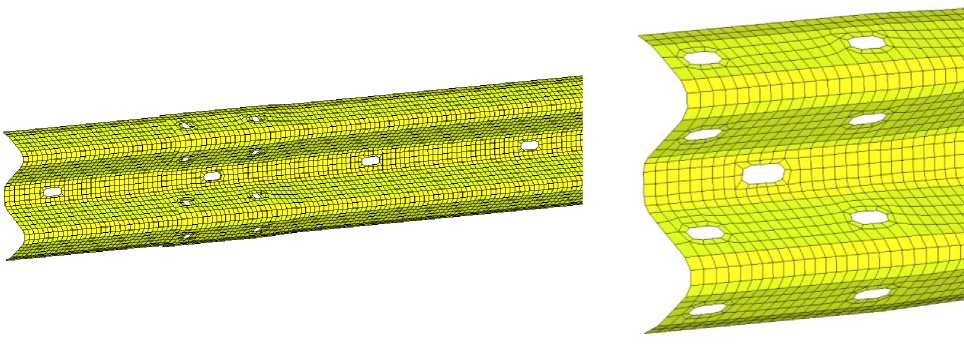
Figure 2 presents the finite element model of the wave beam. This element was discretized using two-dimensional shell elements, and the material was specified as Steel 3.
-
Fig. 2 - FE model of the wave beam
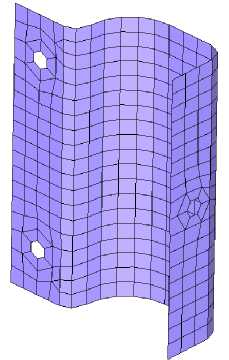
The upper tier handrail is inserted into a guide tube on the post. Figure 3 depicts the energyabsorbing console, which serves to connect the lower beam to the parapet posts.
-
Fig. 3 - FE model: energy-absorbing console
In the model, beam elements with a defined failure criterion were employed to connect the lower beam to the energy-absorbing console (Figure 4a). To simplify the model, rigid, non-destructible constraint equations were used to represent connections between the energy-absorbing console and the posts (Figure 4b).
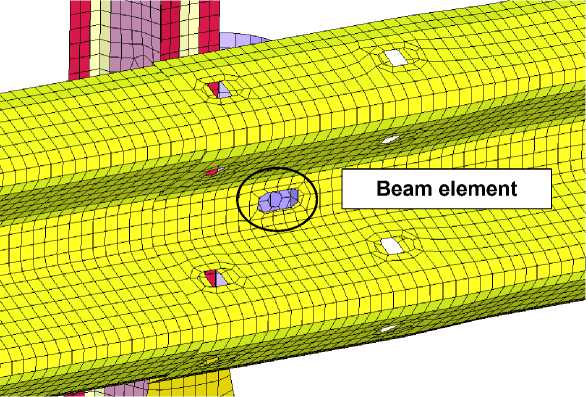
Beam element
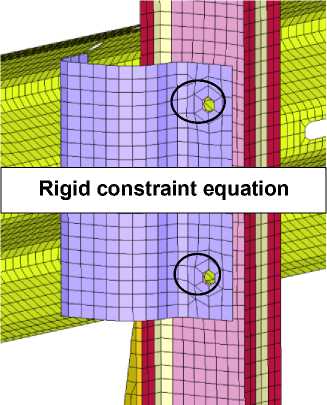
constraint equation
Rigid
а) б)
-
Fig. 4 - View of Barrier Element Connections: (a) Connection of beams to the energy-absorbing console using beam elements, (b) Connection of the energy-absorbing console to the post via a rigid constraint equation
Figure 5 depicts the FEM model of the bridge post designated SM-U-D14(140). The model height is 1113 mm. Shell elements are employed to describe the deformation of sheet metal.
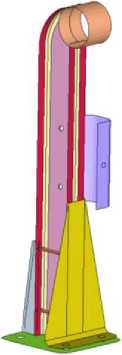
Fig. 5 - FEM Model of Bridge Post SM-U-D14(140)
The connection of the post to the plates is also modeled using breakable beam elements (similar to Figure 4a). To describe the attachment of the post base to the asphalt using anchor fasteners, a fixed boundary condition is applied.
-
Figure 6 shows the FEM model of the bus. The primary structural elements—frame, body panels, and chassis—are modeled with stiffness values corresponding to those of the real components. Parts with much higher stiffness than the elements they contact are modeled as solid bodies with densities and geometries close to those of the actual components.
To verify the applied FEM model of the vehicle, a series of simulations were conducted: checking for straight-line motion, static stability, and overall dynamic stability.
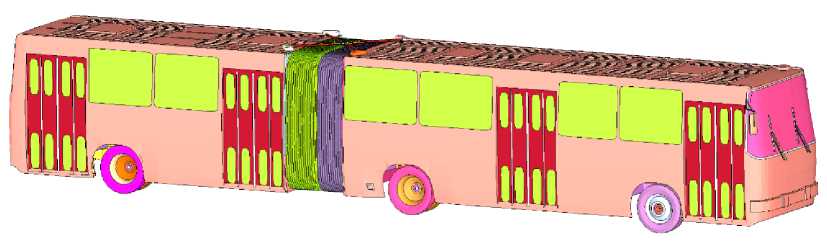
Fig. 6 - FEM Model of the Bus
To test straight-line motion, an initial speed of 67.1 km/h (18.6 m/s) was set, corresponding to the bus's impact speed as recorded in field tests conducted by the NAMI Research Center (Russia), Protocol No. 77/U0/33128/MS/14-19. Inertia forces and friction forces between the wheels and the road surface were considered in the calculations. The model's quality criterion was that the deviation from the trajectory should not exceed 0.1 of the traveled distance within 1.5 seconds.
-
Figure 7 illustrates the calculated lateral deviation from the bus's trajectory, with the center of mass of the bus serving as the measurement point for deviations. The total distance traveled by the model over the 1.5-second calculation period was 27 915 mm. The allowable deviation should not exceed 2 795 mm. The maximum calculated deviation was 80.2 mm.
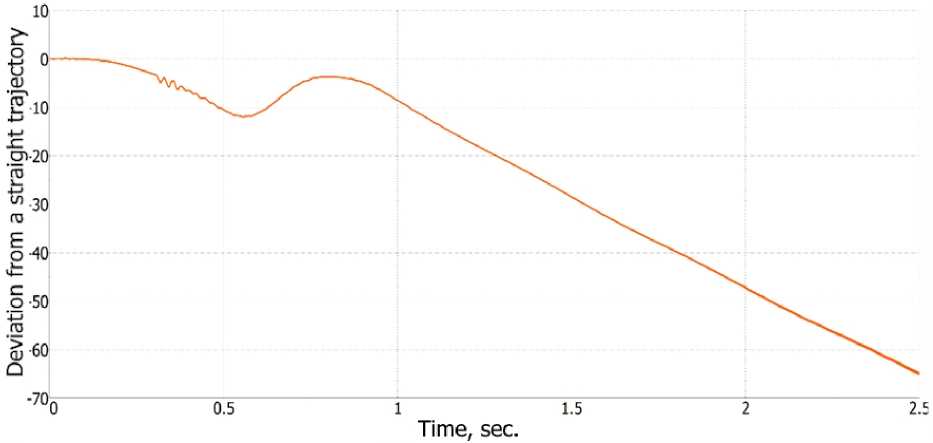
Fig. 7 - Calculated deviation from straight-line motion of the bus model, in mm.
To verify static stability, a gravitational load was applied to the stationary bus model. The allowable amplitude of suspension displacement should not exceed 80 mm for the bus, and accelerations at the vehicle's center of mass should not exceed 3g. Figure 8 presents the results of the suspension displacement calculations for the bus model.
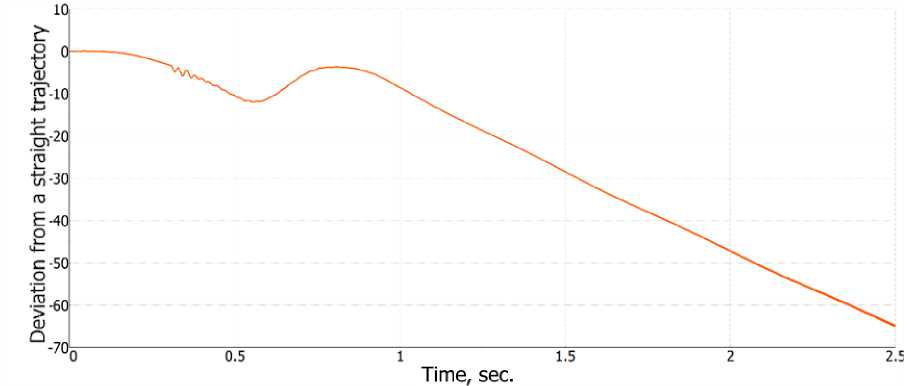
Fig. 8 - Calculated suspension displacement of the bus model, in mm.
The maximum calculated suspension displacement was 75 mm. Figure 9 presents the acceleration calculations for the bus.
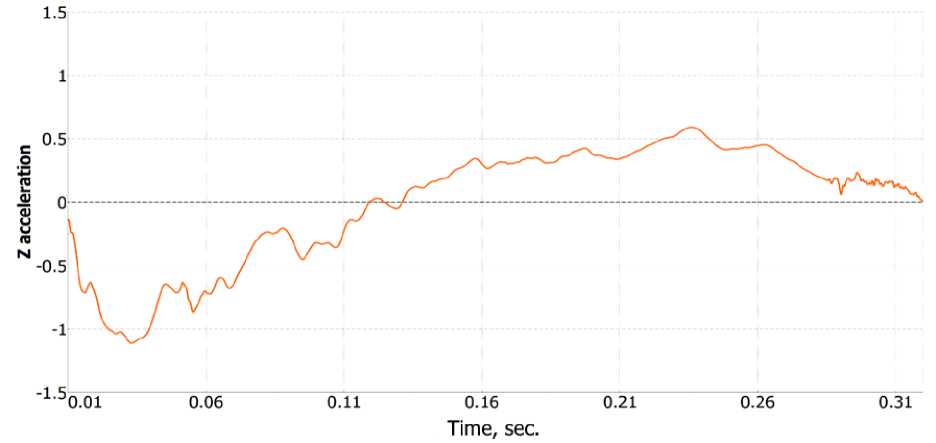
Fig. 9 - Calculated acceleration at the center of mass of the bus model, in g.
The maximum calculated acceleration at the bus's center of mass was 1.11 g.
To assess overall stability in dynamic conditions, the bus was required to travel in a straight line at a speed of 25 km/h, descending from a ramp with a height of 80 mm and a radius of 15 mm. The suspension should absorb 50% of the initial amplitude within the first two oscillation cycles. Figure 10 shows the calculated suspension displacement over time. The maximum amplitude of the first peak was 29 mm, while the maximum amplitude after the first two oscillation cycles was 14 mm.
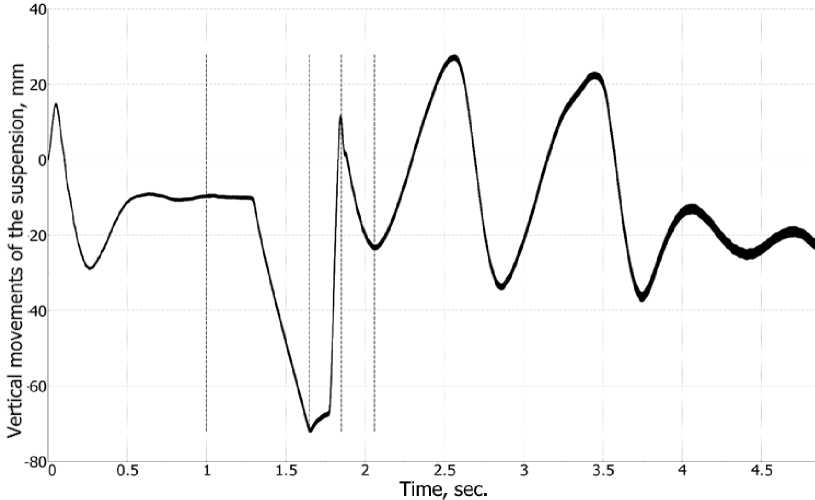
Fig. 10 - Calculated suspension displacement of the bus model, in mm.
Most elements in the bus model employed a piecewise-linear material model (MAT_024), incorporating a comprehensive stress-strain relationship and strain rate effects. Table 1 details the mass and geometric parameters of the bus.
Table 1. Parameters of the FEM Bus Model
|
Characteristics |
Bus, Calculation Model |
|
Overall Length, mm |
17 500 |
|
Overall Width, mm |
2 550 |
|
Front Wheel Track, mm |
2 150 |
|
Center of Mass Height, mm |
1 450 |
The allowable corridor width for the bus after ceasing interaction with the barrier is defined as:
KK = C + 0.16 ■ L + 0.22 • B ,
where:
C is the overall width of the vehicle, equal to 2.57 m;
L is the overall length of the vehicle, equal to 12.774 m;
В is the corridor length, assumed to be 20 m.
Thus, according to formula (1), the allowable corridor width is:
KK = 2.57 + 0.16 • 12.774 + 0.22 • 20 = 9.01 .
The impact angle of vehicles against the bridge barrier is 20° and complies with GOST 33129-2014 Automobile roads of general use. Road restraint systems. Methods of testing [31]. The mass and speed of the vehicles were specified in accordance with the required retaining capacity as outlined in GOST 33129-2014 [31].
According to the field test protocol of the NAMI Research Center (Russia), Protocol No. 77/U0/33128/MS/14-19, the impact angle of the vehicle with the road barrier is 20°. The bus has a mass Storozhev, S. A.; Vafaeva, Kh. M.
Crash Modeling of Bridge Railings: Impact of Post Spacing on Performance;
of 20.0 tons, and its speed at the moment of impact is 67.1 km/h (18.94 m/s). The kinetic energy of the impact is 406.34 kJ.
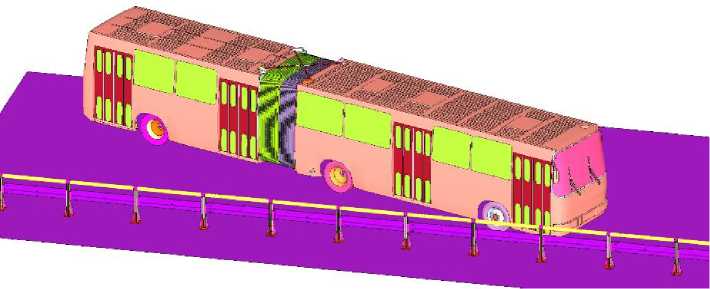
Fig. 11 - FEM Model of the Bridge Barrier Type 21MO/400-1.1x2.0D14(UT) Assembled
In summary, the finite element analysis (FEA) approach outlined above provides a comprehensive framework for simulating and evaluating the interaction between a bus and a bridge parapet. By incorporating detailed models of both the parapet and the bus, and applying fundamental principles of discretization, approximation, equation assembly, solution, and post-processing, the analysis captures essential dynamics and structural responses. The verification of the bus model through various simulations—covering straight-line motion, static stability, and dynamic stability—ensures that the model adheres to realistic operational conditions and safety criteria. The results from these simulations offer valuable insights into the performance of the bridge parapet and the bus under impact conditions, thereby contributing to the understanding and improvement of road safety measures. The application of these methods aligns with established standards and protocols, affirming the robustness and relevance of the simulation outcomes.
3 Results and Discussion
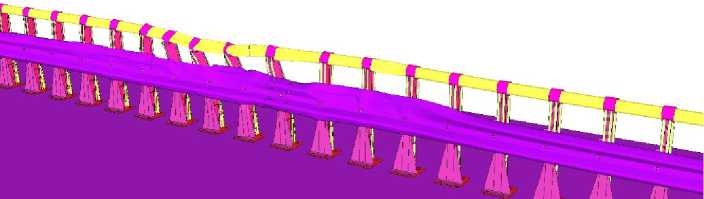
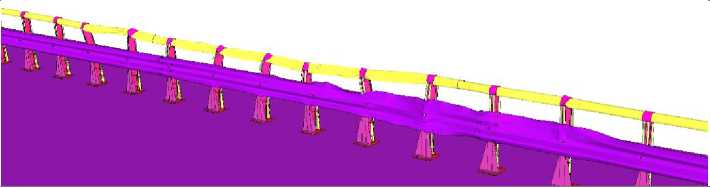
To assess the adequacy (validation) of the computational model, a comparison was made between the calculated results and the full-scale test results (test protocol of the NAMI Research Center (Russia), Protocol No. 77/U0/33128/MS/14-19). Figure 12 presents a comparison of the barrier's appearance after a bus impact during full-scale testing and simulation.
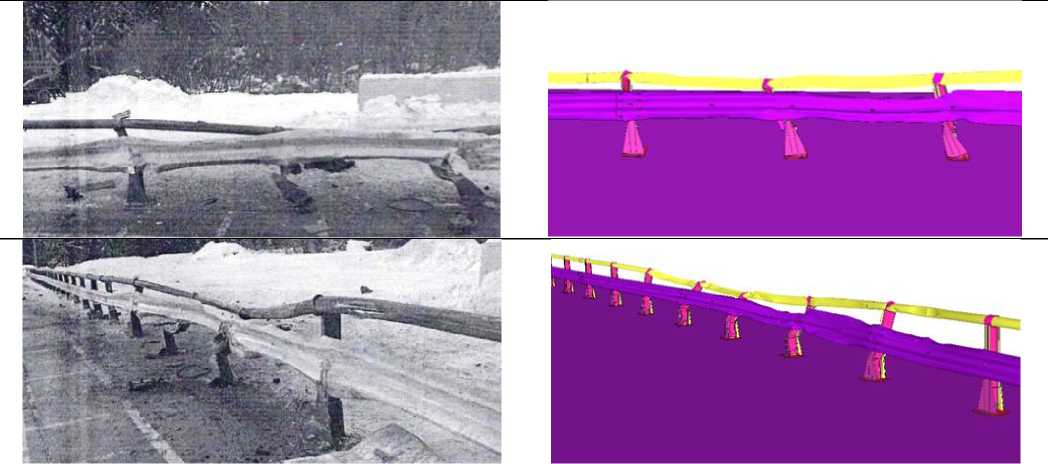
Fig. 12 - View of the bridge parapet after the bus impact
-
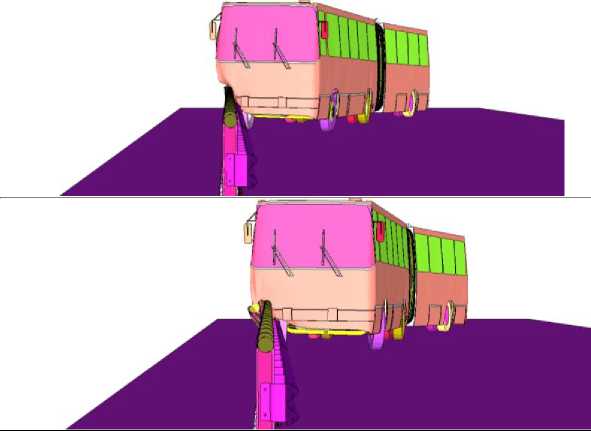
Figure 13 provides a comparison of the impact sequence from the full-scale test and the step-by-step representation of the impact process in the simulation.

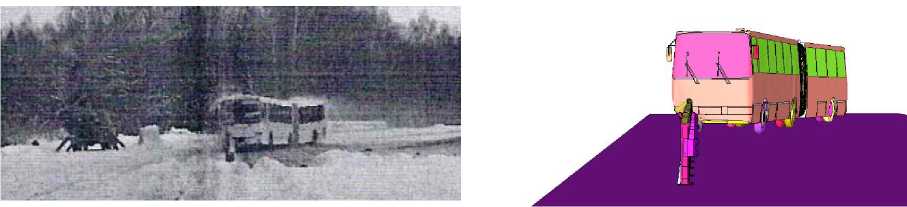
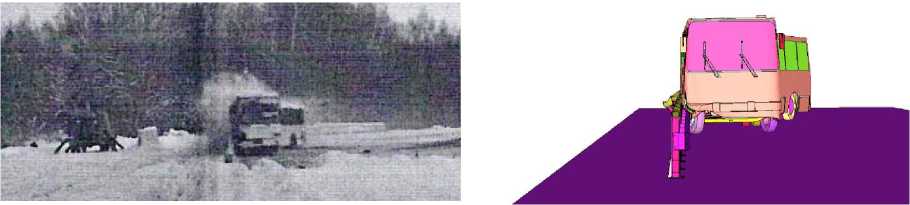
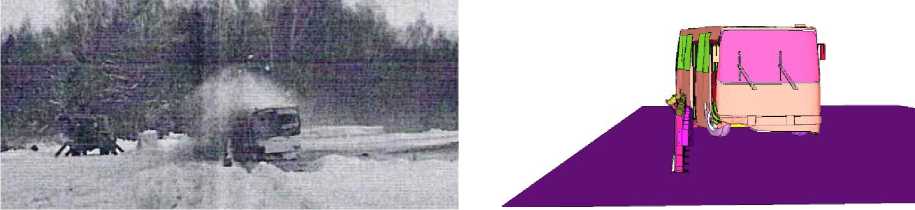
Fig. 13 - Impact process of the bus on the bridge parapet
After the bus comes into contact with the bridge barrier, its trajectory changes (corrects). As a result, at 1.14 seconds of the calculated time, the rear part of the bus strikes the road barrier. The vehicle's trajectory is stable, with no rollover or overriding of the barrier. The bus exit angle is 13.8°. The zone of interaction between the bus and the barrier in the longitudinal direction was 11.7 m. The value of the corridor width of the bus movement during the impact on the barrier does not exceed 9.01 m, which meets the requirements of GOST 33129-2014 [31].
During the bus impact on the bridge barrier, deformation of posts No. 9-14 is observed. The movement of the upper beam along the upper edge opposite the posts in the finite element model is shown in Figure 14. The calculated values of the residual deflections of the upper beam and their comparison with the full-scale experiment are presented in Table 2.
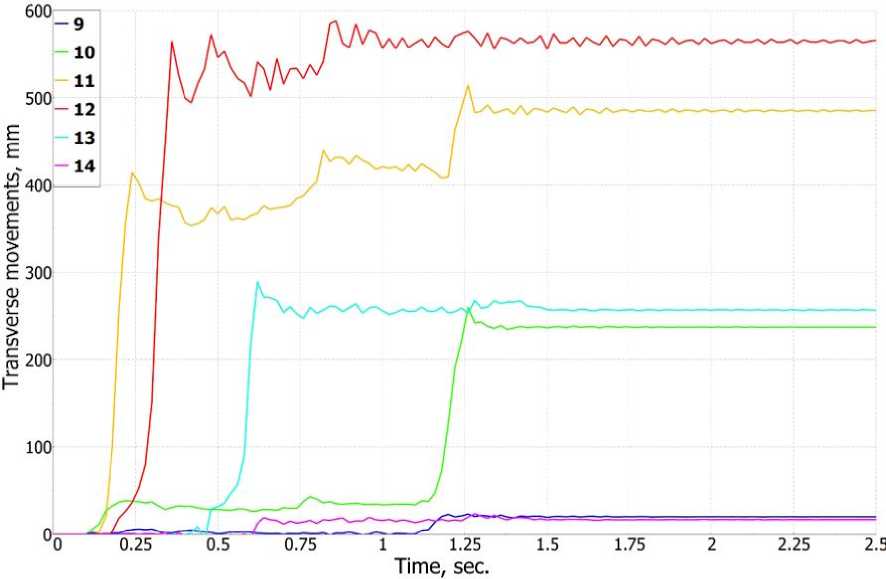
Fig. 14 - Transversal displacements of the upper edge of the barrier railing opposite posts No. 9-14
-
Figure 14 shows the transverse displacements of the upper edge of the barrier railing opposite posts No. 9-14. A comparison of the displacements of points during full-scale testing of the bridge barrier and during FE modeling is presented in Table 2.
% .
Table 2. Comparison of displacements of the barrier railing points
|
Post No. in the measurement zone |
Residual deflection of the barrier, measured at the upper edge of the barrier railing, mm |
Relative difference between calculated and experimental values, % |
|
|
Full-scale test |
FEA Calculation |
||
|
9 |
20 |
20 |
0.0 |
|
10 |
160 |
237 |
48.1 |
|
11 |
480 |
485 |
1.3 |
|
12 |
596 |
566 |
5.0 |
|
13 |
290 |
257 |
11.4 |
|
14 |
20 |
16 |
20.0 |
The difference in the magnitude of the maximum residual deflection of the beam in the zone of the post with the largest deflection is: A = ““~"“ = 5.0
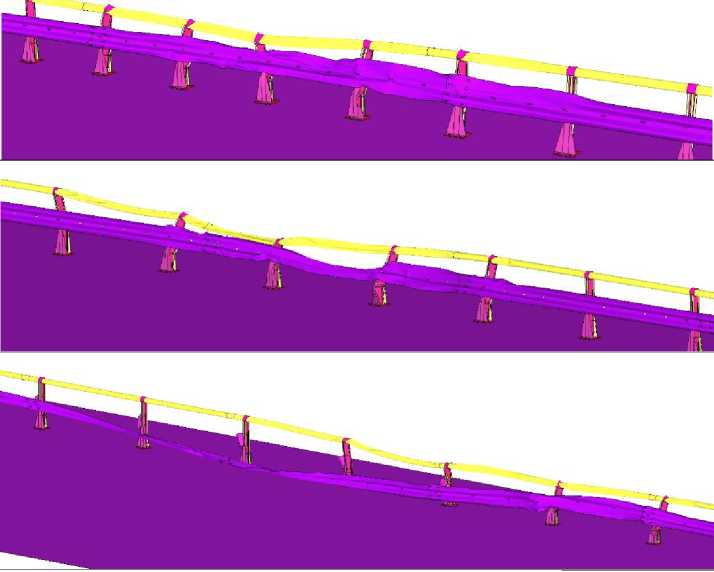
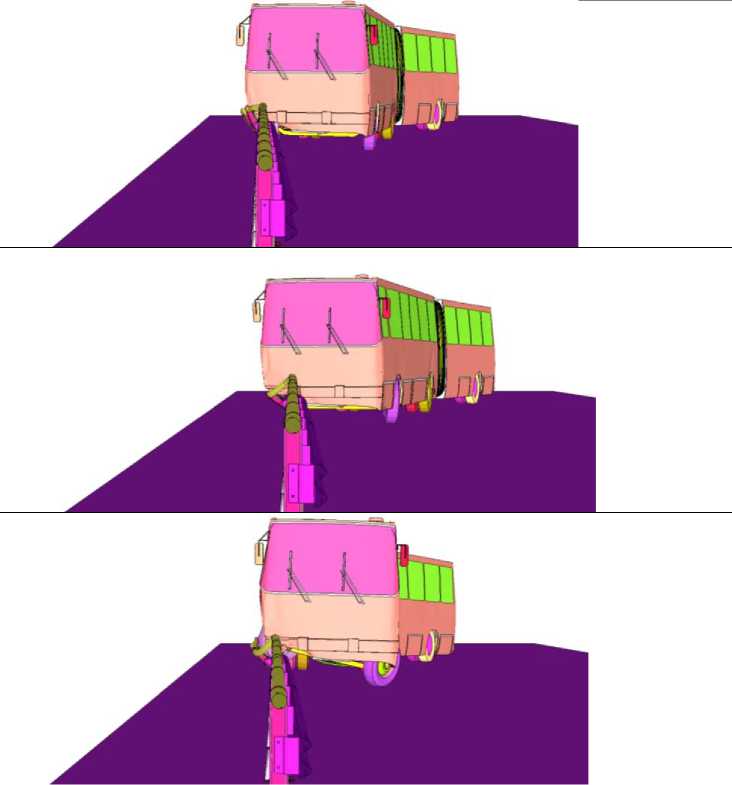
The conducted analysis enables the application of a model with similar parameters to investigate the influence of the barrier post spacing on its performance characteristics: dynamic deflection and working width. Subsequently, the impact of a bus on similar bridge barriers with post spacings of 0.5 m, 1 m, 1.5 m, 2.5 m, and 3 m will be considered. A comparison of the barrier appearance after impact depending on the post spacing is presented below:
Post Spacing, m
Front View
0.5
1.5
2.5
0.5
Post Spacing, m
Front View
1.5
2.5
The primary objective of this study was to determine the influence of post spacing on the performance characteristics of a 1.1 m high bridge barrier with D14 type posts. The dependence of the barrier's performance characteristics on the post spacing is illustrated in Figure 15.
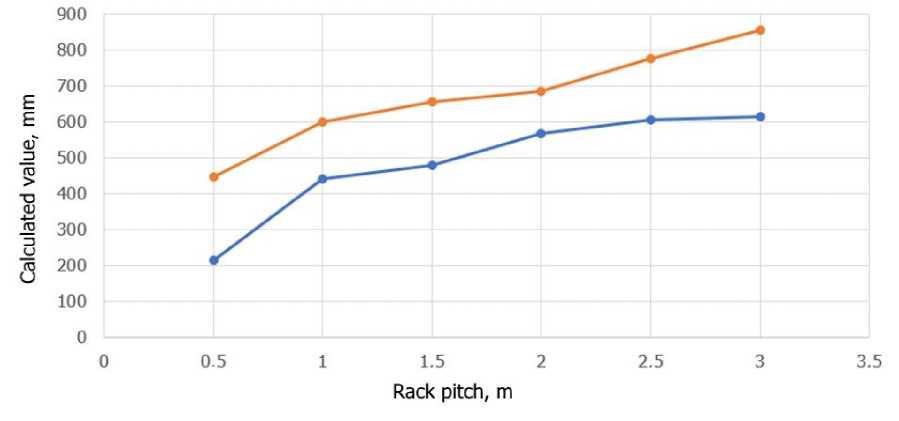
Fig. 15 - Relationship between the performance characteristics of a 1.1-meter-high bridge barrier with handrails and D14-type posts
Table 3 presents the performance characteristics of the bridge barrier depending on the post spacing.
Table 3. Performance characteristics of the bridge barrier depending on the post spacing
|
Post Spacing |
Dynamic Deflection, mm |
Working Width, mm |
|
0.5 |
214 |
447 |
|
1 |
440 |
601 |
|
1.5 |
479 |
656 |
|
2 |
566 |
684 |
|
2.5 |
605 |
775 |
|
3 |
615 |
855 |
To find the optimal design, the mass of 100 m of the barrier was calculated. Table 4 presents the masses of 100 m of the barrier with different post spacings and its ratio to the maximum dynamic deflection.
Table 4. Performance characteristics of the bridge barrier depending on the post spacing
|
Post spacing |
Mass, kg |
Mass to deflection |
|
0.5 |
10 315 |
48.2 |
|
1 |
6 365 |
14.5 |
|
1.5 |
5 048 |
10.6 |
|
2 |
4 390 |
7.8 |
|
2.5 |
3 995 |
6.6 |
|
3 |
3732 |
6.1 |
Figures 16 and 17 show the dependence of the material consumption and deflection of the structure.
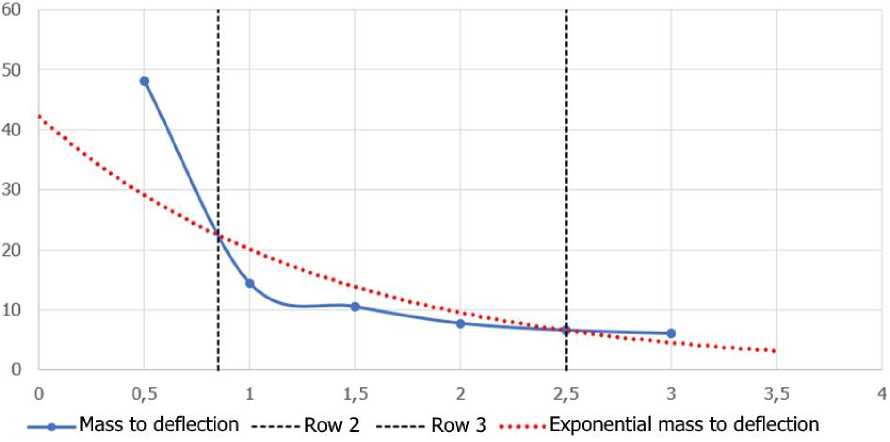
Fig. 16 - Relationship between material usage and deflection of a 1.1-meter-high bridge barrier with handrails and D14-type posts
The Pareto front was calculated to determine the optimal spacing based on the criteria of material consumption and structural deflection. The calculation results show that for a 1.1 m high bridge barrier with D14 type posts, the optimal post spacing in terms of material consumption and dynamic deflection is 1.5 m and 2 m.
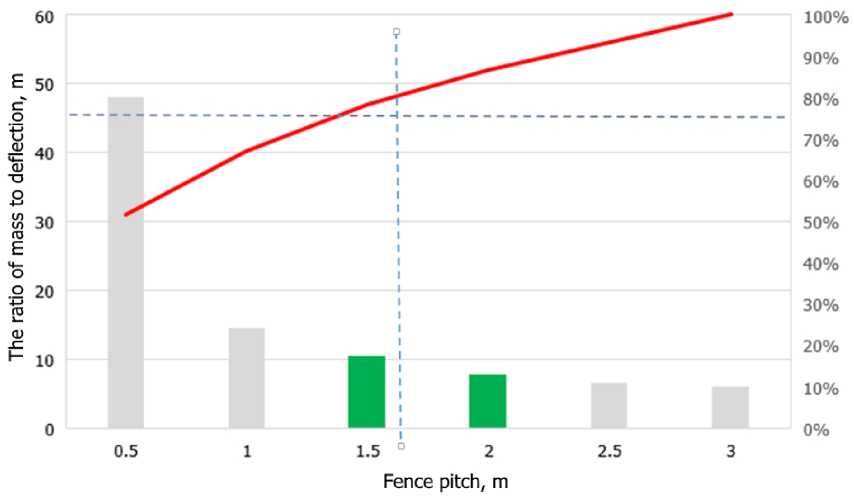
Fig. 17 - Relationship between material usage and deflection of a 1.1-meter-high bridge barrier with handrails and D14-type posts
In summary, the validation of the computational model against full-scale test results demonstrates its accuracy and reliability in simulating the impact dynamics of a bus on a bridge barrier. The comparison between simulated and experimental data reveals a generally close agreement, particularly regarding the trajectory and deformation characteristics of the barrier. Notably, the discrepancies observed in residual deflections are within acceptable limits, affirming the model's robustness for predicting barrier performance under impact. The analysis further indicates that varying post spacings significantly affect the barrier’s dynamic deflection and working width. Optimal post spacings, identified as 1.5 m and 2 m, balance material consumption with structural performance, providing valuable insights for future design improvements. These findings underscore the efficacy of the model for assessing barrier design and guide subsequent enhancements in safety and structural integrity.
4 Conclusions
This study analyzes the effectiveness of using Finite Element Analysis (FEA) for modeling the impact of a bus on a bridge barrier, specifically the 21MO/400-1.1x2.0D14(UT) type. The barrier model incorporated the following key components: a bridge post, an upper railing, an energy-absorbing console, and a lower beam, all modeled using two-dimensional shell elements. The bus model incorporated detailed geometric and material properties to accurately replicate real-world conditions. Simulation parameters, including initial velocity, impact angle, and material properties of the vehicle and barrier elements, were based on experimental data from the NAMI Research Center (Russia).
The developed finite element model accurately reproduced real-world collision conditions and yielded the following key findings:
-
1. Validation: Comparison of numerical simulation results with experimental data confirmed the high accuracy and reliability of the developed model. This indicates that the model can be used to predict the behavior of similar structures under real-world conditions.
-
2. Post Spacing Influence: A systematic variation of the post spacing in the model established a direct relationship between this parameter and the dynamic characteristics of the barrier. Decreasing the post spacing leads to an increase in the structure's stiffness and a decrease in dynamic deflections but is accompanied by an increase in material consumption.
-
3. Optimal Post Spacing: The optimal post spacing, providing a balance between strength and economy, was determined to be in the range of 1.5-2 meters. This result has direct practical significance for the design of bridge barriers.
-
4. Accuracy: The calculated values of dynamic deflection and residual deformation demonstrate a high degree of agreement with experimental data, confirming the reliability of FEM for modeling such complex interactions.
The obtained results show a significant correlation between post spacing and the barrier's performance characteristics, such as dynamic deflection and working width. The calculated values of dynamic deflection and residual deformation demonstrate a high degree of agreement with experimental data, confirming the reliability of FEM in modeling such complex interactions.
The novelty of this research lies in the detailed analysis of the influence of post spacing on the behavior of the bridge barrier under dynamic impact using FEM.
The practical significance of the research results lies in the possibility of applying the obtained data to develop new designs of bridge barriers that meet safety and economic requirements. This study makes a significant contribution to the development of methods for designing and optimizing road barriers, which is relevant for ensuring road safety.
The results of the study are important for a wide range of specialists and organizations, as they will allow the creation of more reliable and effective bridge barrier designs, optimizing their parameters based on specific operating conditions. The obtained results will help in selecting the optimal types of barriers and developing more advanced technical solutions. The proposed work expands the existing knowledge about the behavior of road barriers under dynamic loads and serves as a basis for further research in this area.
-
5 Fundings
This research was funded by the Ministry of Science and Higher Education of the Russian Federation within the framework of the state assignment No. 075-03-2022-010 dated 14 January 2022 and No. 075--01568-23-04 dated 28 March 2023(Additional agreement 075-03-2022-010/10 dated 09 November 2022, Additional agreement 075-03-2023-004/4 dated 22 May 2023), FSEG-2022-0010.
References Crash modeling of bridge railings: impact of post spacing on performance
- Sha, Y. and Hao, H. (2012) Nonlinear Finite Element Analysis of Barge Collision with a Single Bridge Pier. Engineering Structures, Elsevier, 41, 63–76. https://doi.org/10.1016/J.ENGSTRUCT.2012.03.026.
- Kitamura, O. (2002) FEM Approach to the Simulation of Collision and Grounding Damage. Marine Structures, Elsevier, 15, 403–428. https://doi.org/10.1016/S0951-8339(02)00010-2.
- Storheim, M. and Amdahl, J. (2017) On the Sensitivity to Work Hardening and Strain-Rate Effects in Nonlinear FEM Analysis of Ship Collisions. Ships and Offshore Structures, Taylor & Francis, 12, 100–115. https://doi.org/10.1080/17445302.2015.1115181.
- Müller, M., McMillan, L., Dorsey, J. and Jagnow, R. (2001) Real-Time Simulation of Deformation and Fracture of Stiff Materials. Springer, Vienna, 113–124. https://doi.org/10.1007/978-3-7091-6240-8_11.
- Dro´zdzieldro´zdziel, P., Pasaulis, T., Pečeli, R., Unas, ¯ and Pukalskas, S. (2024) Evaluation of the Energy Equivalent Speed of Car Damage Using a Finite Element Model. Vehicles 2024, Vol. 6, Pages 632-650, Multidisciplinary Digital Publishing Institute, 6, 632–650. https://doi.org/10.3390/VEHICLES6020029.
- Neeraj, K.S., Salanke, S.R.S., Tejas, S.S., Sudhansh, S.R. and Khot, M.B. (2024) Finite Element Modelling and Simulation of Car Bonnet’s Crashworthiness Parameters for Pedestrian Safety. International Journal of Vehicle Systems Modelling and Testing, Inderscience Publishers, 18, 78–95. https://doi.org/10.1504/IJVSMT.2024.136761.
- Agarwal, A., Cavicchioli Batista, R. and Gurung, A. (2024) Analyzing the Impact of Bumper Height on Pedestrian Injuries Using Explicit Dynamics. Smart Electric and Hybrid Vehicles, CRC Press, New York, 57–89. https://doi.org/10.1201/9781003502470-5.
- Dai, Z., Miao, Q. and Wu, D. (2024) Data Simulation of the Impact of Ball Strikes on the Bottom of Electric Vehicle Battery Packs Based on Finite Element Analysis. Thermal Science and Engineering Progress, Elsevier, 53, 102757. https://doi.org/10.1016/J.TSEP.2024.102757.
- Kertesz, J. and Kovács, T.A. (2024) Finite Element Analysis Regarding Folding Behaviour of Different Crashbox Versions. European Journal of Mechanics - A/Solids, Elsevier Masson, 107, 105375. https://doi.org/10.1016/J.EUROMECHSOL.2024.105375.
- Ul Abrar, M.S., Nadim Ezaz, K.F., Hasan, M.J., Pranto, R.I., Alvy, T.A. and Hossain, M.Z. (2024) Speed-Dependent Impact Analysis on a Car Bumper Structure Using Various Materials. Results in Engineering, Elsevier, 21, 101927. https://doi.org/10.1016/J.RINENG.2024.101927.
- Yuan, S., Reniers, G., Yang, M. and Bai, Y. (2023) Cost-Effective Maintenance of Safety and Security Barriers in the Chemical Process Industries via Genetic Algorithm. Process Safety and Environmental Protection, Elsevier, 170, 356–371. https://doi.org/10.1016/J.PSEP.2022.12.008.
- Kineber, A.F., Singh, A.K., Fazeli, A., Mohandes, S.R., Cheung, C., Arashpour, M., Ejohwomu, O. and Zayed, T. (2023) Modelling the Relationship between Digital Twins Implementation Barriers and Sustainability Pillars: Insights from Building and Construction Sector. Sustainable Cities and Society, Elsevier, 99, 104930. https://doi.org/10.1016/J.SCS.2023.104930.
- Waqar, A., Othman, I., Shafiq, N., Altan, H. and Ozarisoy, B. (2023) Modeling the Effect of Overcoming the Barriers to Passive Design Implementation on Project Sustainability Building Success: A Structural Equation Modeling Perspective. Sustainability 2023, Vol. 15, Page 8954, Multidisciplinary Digital Publishing Institute, 15, 8954. https://doi.org/10.3390/SU15118954.
- Khan, F.M.N.U., Rasul, M.G., Sayem, A.S.M. and Mandal, N.K. (2023) Design and Optimization of Lithium-Ion Battery as an Efficient Energy Storage Device for Electric Vehicles: A Comprehensive Review. Journal of Energy Storage, Elsevier, 71, 108033. https://doi.org/10.1016/J.EST.2023.108033.
- Tengilimoglu, O., Carsten, O. and Wadud, Z. (2023) Implications of Automated Vehicles for Physical Road Environment: A Comprehensive Review. Transportation Research Part E: Logistics and Transportation Review, Pergamon, 169, 102989. https://doi.org/10.1016/J.TRE.2022.102989.
- Rehman, Z. ur, Ijaz, N., Ye, W. and Ijaz, Z. (2023) Design Optimization and Statistical Modeling of Recycled Waste-Based Additive for a Variety of Construction Scenarios on Heaving Ground. Environmental Science and Pollution Research, Springer Science and Business Media Deutschland GmbH, 30, 39783–39802. https://doi.org/10.1007/S11356-022-24853-1/FIGURES/13.
- Mazzoli, C., Papadaki, D. and Ferrante, A. (2023) A Parametric Approach for Optimizing Design Solutions in Urban Regeneration and Reshaping: An Application to a District Block in Bologna, Italy. Buildings 2023, Vol. 13, Page 3123, Multidisciplinary Digital Publishing Institute, 13, 3123. https://doi.org/10.3390/BUILDINGS13123123.
- Liu, G. and Fu, Y. (2024) Design and Optimization of Steering-by-Wire System for FSAC Racing Car. Smart Innovation, Systems and Technologies, Springer Science and Business Media Deutschland GmbH, 374, 3–29. https://doi.org/10.1007/978-981-99-7011-7_1/FIGURES/28.
- Zurita Villarroel, G., Vasquez Martinez, R., Rene, J., Grandon, C. and Paniagua Gutié Rrez, S. A Systematic Procedure for Design and Structural Mechanical Analysis: A Case Study for Construction of a Buggy. https://doi.org/10.18178/ijmerr.12.6.362-377.
- Chang, D., Li, F., Xue, J. and Zhang, L. (2023) A TRIZ-Inspired Knowledge-Driven Approach for User-Centric Smart Product-Service System: A Case Study on Intelligent Test Tube Rack Design. Advanced Engineering Informatics, Elsevier, 56, 101901. https://doi.org/10.1016/J.AEI.2023.101901.
- De Fazio, R., De Giorgi, M., Cafagna, D., Del-Valle-Soto, C. and Visconti, P. (2023) Energy Harvesting Technologies and Devices from Vehicular Transit and Natural Sources on Roads for a Sustainable Transport: State-of-the-Art Analysis and Commercial Solutions. Energies 2023, Vol. 16, Page 3016, Multidisciplinary Digital Publishing Institute, 16, 3016. https://doi.org/10.3390/EN16073016.
- Chen, M., Zhang, Z., Deng, Q., Feng, Y. and Wang, X. (2023) Optimization of Underfloor Air Distribution Systems for Data Centers Based on Orthogonal Test Method: A Case Study. Building and Environment, Pergamon, 232, 110071. https://doi.org/10.1016/J.BUILDENV.2023.110071.
- Timilsina, S., Yazdani, N. and Beneberu, E. (2021) Post-Fire Analysis and Numerical Modeling of a Fire-Damaged Concrete Bridge. Engineering Structures, Elsevier Ltd, 244. https://doi.org/10.1016/j.engstruct.2021.112764.
- Molan, A.M., Moomen, M. and Ksaibati, K. (2020) Estimating the Effect of Geometric Features of Side Traffic Barriers on Crash Severity of Interstate Roads in Wyoming. Accident Analysis and Prevention, Elsevier Ltd, 144. https://doi.org/10.1016/j.aap.2020.105639.
- Qeshta, I.M.I., Hashemi, M.J., Gravina, R. and Setunge, S. (2019, April 15) Review of Resilience Assessment of Coastal Bridges to Extreme Wave-Induced Loads. Engineering Structures, Elsevier Ltd, 332–352. https://doi.org/10.1016/j.engstruct.2019.01.101.
- Soltani, M., Moghaddam, T.B., Karim, M.R. and Ramli Sulong, N.H. (2013) Analysis of Developed Transition Road Safety Barrier Systems. Accident Analysis and Prevention, 59, 240–252. https://doi.org/10.1016/j.aap.2013.05.029.
- Thanh, L. and Itoh, Y. (2013) Performance of Curved Steel Bridge Railings Subjected to Truck Collisions. Engineering Structures, 54, 34–46. https://doi.org/10.1016/j.engstruct.2013.03.054.
- Kolla, E., Adamová, V. and Demcáková, L. (2021) Geometry Influence of Far-Side Wall of Tunnel Emergency Bay on the Traffic Safety. Transportation Research Procedia, Elsevier B.V., 1712–1719. https://doi.org/10.1016/j.trpro.2021.07.163.
- Yao, J., Zhang, J., Huang, L., Xu, J. and wang, B. (2023) Analysis of Anti-Collision Performance of a New Assembled Rolling Guardrail. Structures, Elsevier Ltd, 47, 246–259. https://doi.org/10.1016/j.istruc.2022.11.068.
- Larsen, A. (1998) Advances in Aeroelastic Analyses of Suspension and Cable-Stayed Bridges. Journal of Wind Engineering and Industrial Aerodynamics, Elsevier Sci B.V., 74–76, 73–90. https://doi.org/10.1016/S0167-6105(98)00007-5.
- Russian State Standard (GOST) 33129-2014:Automobile Roads of General Use. Road Restraint Systems. Methods of Testing. https://docs.cntd.ru/document/1200121052.
