Creation and comparison of language and acoustic models using Kaldi for noisy and enhanced speech data

Author: Thimmaraja Yadava G., H. S. Jayanna
Journal: International Journal of Intelligent Systems and Applications @ijisa
Article in issue: 3 vol.10, 2018.
Free access
In this work, the Language Models (LMs) and Acoustic Models (AMs) are developed using the speech recognition toolkit Kaldi for noisy and enhanced speech data to build an Automatic Speech Recognition (ASR) system for Kannada language. The speech data used for the development of ASR models is collected under uncontrolled environment from the farmers of different dialect regions of Karnataka state. The collected speech data is preprocessed by proposing a method for noise elimination in the degraded speech data. The proposed method is a combination of Spectral Subtraction with Voice Activity Detection (SS-VAD) and Minimum Mean Square Error-Spectrum Power Estimator (MMSE-SPZC) based on Zero Crossing. The word level transcription and validation of speech data is done by Indic language transliteration tool (IT3 to UTF-8). The Indian Language Speech Label (ILSL12) set is used for the development of Kannada phoneme set and lexicon. The 75% and 25% of transcribed and validated speech data is used for system training and testing respectively. The LMs are generated by using the Kannada language resources and AMs are developed by using Gaussian Mixture Models (GMM) and Subspace Gaussian Mixture Models (SGMM). The proposed method is studied determinedly and used for enhancing the degraded speech data. The Word Error Rates (WERs) of ASR models for noisy and enhanced speech data are highlighted and discussed in this work. The developed ASR models can be used in spoken query system to access the real time agricultural commodity price and weather information in Kannada language.
Language Models (LMs), Acoustic Models (AMs), Kaldi, Automatic Speech Recognition (ASR), Word Error Rates (WERs)
Short address: https://sciup.org/15016468
IDR: 15016468 | DOI: 10.5815/ijisa.2018.03.03
Text of the scientific article Creation and comparison of language and acoustic models using Kaldi for noisy and enhanced speech data
Published Online March 2018 in MECS
Speech is one of the most important types of communication among the human beings. The communication between human being is successful only when there is no distortion in dialogue. Recognizing the word uttered by the speaker is a challenging role and it is called speech recognition [1]. Speech enhancement is mainly depends on the human perceptual factors and signal processing applications. The speech data collected in the real time environment is noisy in nature. Normally speech is corrupted by several degradations such as background noise, vocal noise, factory noise, f16 noise, babble noise and reverberations etc. The noise reduction in degraded speech data is a challenging task [2]. The Spectral Subtraction (SS) method is most widely used for speech enhancement. This method is mainly associated with Voice Activity Detection (VAD). To find the active regions of degraded speech signal, VAD is used [3]. The degraded speech signal is processed by considering both low signal to noise ratio (SNR) and high SNR regions. The degraded speech segments are processed frame by frame with duration of 20 ms. The SS-VAD method was proposed for speech enhancement in [4-8]. The effect of noise can be eliminated in degraded speech signal by subtracting the average magnitude spectrum of noise model from the average magnitude spectrum of degraded speech signal.
The speech signal Magnitude Squared Spectrum (MSS) estimators were proposed for noise reduction in degraded speech signal in [9-11]. The MSS estimators namely, Minimum Mean Square Error-Short Time Power spectrum (MMSESP), Minimum Mean Square ErrorSpectrum Power based on Zero Crossing (MMSE-SPZC)
and Maximum a posteriori (MAP) are implemented individually. These MSS estimators significantly performed well under many degraded conditions [11]. Ephraim and Malah have proposed a Minimum Mean Square Error Short Time Spectral Amplitude (MMSE-STSA) estimator for speech enhancement [9]. This method was compared with most widely used algorithms such as spectral subtraction and Wiener filtering and it was observed that the proposed MMSE-STSA method gives better performance than the existing methods. An alternatives to the Ephraim and Malah, a speech enhancement method was proposed under the assumption that the Fourier series expansion of clean (original) speech signal and noise may be modeled as independently with zero mean and Gaussian random variables [12]. Rainer Martin proposed an algorithm for speech enhancement using MMSE estimators and Supergaussian Priors [13]. The main significance of this algorithm was to improve the short time spectral coefficients of corrupted speech signal. This method was compared with Wiener filtering and MMSE-STSA methods in [10]. Philipos C and Loizou have proposed an algorithm for noise reduction in corrupted speech signal using Baysian estimators. Three different types of Baysian estimators are implemented for speech enhancement [14].
Kaldi C++ Executables
Shell scripts
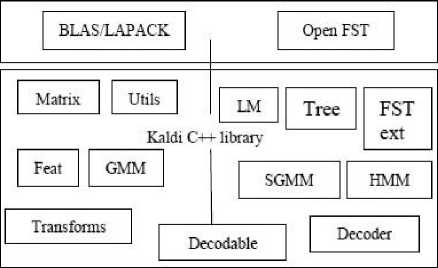
Fig.1. Block diagram of Kaldi speech recognition toolkit
Various speech recognition toolkits are used to build a robust Automatic Speech Recognition (ASR) system. They are, Kaldi, CMU Sphinx, Hidden Markov Model Toolkit (HTK) and Julius etc., [15]. Kaldi is one of the important speech recognition toolkits to build Language Models (LMs) and Acoustic Models (AMs) [16]. Kaldi is publicly available toolkit for speech recognition and it is written in C++ programming language. The Kaldi toolkit includes C++ executables and various shell scripts. The codes are very flexible, modern and easy to understand. The entire Kaldi speech recognition toolkit is available at SourceForge website (. This can be run on both Microsoft windows and Linux operating systems. The basic building block diagram of Kaldi speech recognition toolkit is shown in Fig. 1. The following are the some special features of Kaldi compared to other speech recognition toolkits:
-
> Finite State Transducers (FST) integration.
-
> Complete Linear Algebra (LA) support.
-
> Complete design: C++ executables and shell scripts.
-
> Open source: The complete design of Kaldi is licensed under Apache v2.0.
The main aim of feature extraction using Kaldi is to generate standard Mel Frequency Cepstral Coefficients (MFCC). Kaldi supports the conventional models such as GMM, SGMM and it is very easy to extend it to other models. Ahmed Ali, et al. have developed an Arabic speech recognition system using Kaldi [17]. Arabic language has big lexicon and data sparseness. The conventional models such as GMM and SGMM are used to build an Arabic speech recognition system. The authors have used 36 phonemes and 200 hours of speech data. The achieved WER is 15.81% on Broadcast Report (BR), 32.21% on Broadcast Conversation (BC) and 26.95% for overall speech data. Arabic language has big lexicon and data sparseness. The conventional models such as GMM and SGMM are used to build an Arabic speech recognition system. The authors have used 36 phonemes and 200 hours of speech data. The achieved WER is 15.81% on Broadcast Report (BR), 32.21% on Broadcast Conversation (BC) and 26.95% for overall speech data. The detailed description and comparison of various speech recognition techniques are discussed in [18] for a limited amount of Arabic broadcast speech data. The 50 hours of transcribed speech data was taken from AlJazeera news channel and trained using different techniques. The achieved WER is 17.86% for broadcast news reports, 29.85% for broadcast conversations and 25.60% for overall speech data using i-vector based speaker adaptation. Russian speech recognition system with large vocabulary using syntactico-statistical language modeling is developed by Alexey Karpov, et al., [19]. The International Phonetic Alphabet (IPA) symbols are used as standard phoneme set. It includes 55 phonemes, 38 consonants and 17 vowels. The Russian speech data is recorded in office environment without any background noise. The sampling rate of 16 kHz and totally 26 hours of speech data is used for Kaldi testing and training. The achieved WER is 26.90%. S Shahnawazuddin, et al., have developed a spoken query system to access the agricultural commodity prices in Assamese language [20]. The sufficient amount of Assamese speech data is collected from the farmers to build ASR models. An Assamese spoken query system consists of Asterisk server, Interactive Voice Response System (IVRS), ASR models and Agricultural Marketing Network (AGMARKNET) [21] database. The developed spoken query system enables the farmers to access the agricultural commodity prices in Assamese language. The achieved WER is 15.99% for commodity and 6.13% for districts. Statistical single channel speech enhancement approaches have been surveyed for speech enhancement in [28]. The speech data degraded by additive noises are eliminated by using statistical based single channel speech enhancement technique. The authors have compared different statistical based approaches and estimators to eliminate the different types of degradations in speech data. A survey on speech enhancement techniques has been reported in [29]. The main objective of authors work is to reduce the different types of noises presented in the speech data. The single channel speech enhancement technique is used for the elimination of different types of noises in speech. In addition to this, the transform domain approaches and supervised speech enhancement techniques are used.
The literature reveals that the creation of dictionary, Kannada phoneme set and the development of LMs and AMs using Kaldi for noisy and enhanced speech data for Kannada language are not addressed. Therefore, this exertion is focused mainly on the development of ASR models for noisy and enhanced speech data, Kannada dictionary and phoneme set. The rest of the paper is organized as follows: The speech data collection is described briefly in Section II. Section III gives the proposed speech enhancement technique, performance measures and performance evaluation of existing and proposed methods in detail. The development of LMs and AMs for noisy and enhanced speech data are reported in Section IV. The results and Word Error Rates (WERs) of developed ASR models are discussed in Section V. The Section VI depicts the summary and conclusions.
-
II. Speech Data Collection
To build LMs and AMs, an adequate amount of speech data is required. A big Kannada speech database is created with the use of asterisk server and Interactive Voice Response System (IVRS) call flow. The telephone service for IVRS call flow is provided by the Bharat Sanchar Nigam Limited (BSNL) vendors. Altogether 2000 farmers speech data is collected under uncontrolled environment across the different dialect regions of Karnataka. It consists of 29 districts, 150 mandis and 150 commodities of Karnataka state enlisted in
AGMARKNET [21]. Each farmer has spoken 50 utterances per session. The following points were considered while collecting the speech data from the farmers:
-
❖ Karnataka state has four different dialect regions.
Therefore the speech data is collected from all dialect regions of Karnataka to capture all the possible pronunciations.
-
❖ 75% of male and 25% female farmers ratio is
maintained.
-
❖ The collected speech data consists of all possible pronunciations for a single isolated speech sound.
-
III. Combined Spectral Subtraction and Minimum Mean Square Error-Spectrum Power Estimator based on Zero Crossing for Speech Enhancement
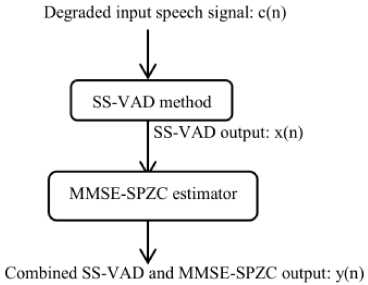
Speech enhancement is one of the most important applications of speech processing [2]. A method is proposed for speech enhancement which is a combination of SS-VAD and MMSE-SPZC. Individually, SS-VAD and MMSE-SPZC estimator is described as follows:
-
A. Spectral Subtraction with Voice Activity Detection (SS-VAD)
Spectral subtraction method is commonly used for noise cancellation in degraded speech signal. The VAD plays an important role in the detection of only voiced area in the speech signal [3]. The degraded speech signal c(n) is converted into segments and each segment consists of 256 samples with the sampling frequency of 8kHz. The frame overlapping rate of 50% is considered and Hanning window is used in this work. The mathematical representation of Hanning window is as follows:
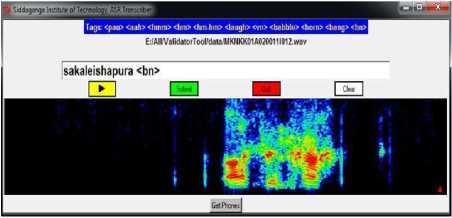
W[n] = 0.5 - 0.5cos(2nn/N) where 0 where N is the number of points and the window length L can be written as L = N + 1. Fig.2. Basic building block diagram of SS-VAD The basic building block diagram of SS-VAD is given in Fig. 2. It consist of several steps namely, windowing, Fast Fourier Transform (FFT) calculation, noise estimation, half wave rectification, residual noise reduction and calculation of Inverse Fast Fourier Transform (IFFT). The corrupted speech signal c(n) is Hanning windowed and the FFT is calculated. The FFT is one of the most important methods to analyze the speech spectrum. The active regions of speech signal is identified by VAD [3], hence the noise is estimated. The Linear Prediction Error (LPE) is mainly associated with Energy E of the signal and Zero Crossing Rate (Z). The parameter Y can be written as follows: Y = E(1 - Z)(1 - E) for single frame (2) Ymax = Y for all frames (3) The fraction term is used to check whether the Ymax signal has voice activity or not. The average magnitude spectrum of VAD output is subtracted with the average magnitude spectrum of noise estimated. Therefore, this process is called spectral subtraction with VAD. Reduction of residual noise in enhanced speech signal is the final step of spectral subtraction. During the nonspeech activities, it is needed to further attenuate the signal. This improves the quality of the enhanced speech signal. Finally, the enhanced speech signal is obtained by calculating its IFFT. The enhanced speech signal can be used in speech processing applications such as, speech recognition, speaker identification, speaker verification, speaker recognition etc. B. Minimum Mean Square Error-Spectrum Power estimator based on Zero Crossing (MMSE-SPZC) The MMSE-SPZC is an important magnitude squared spectrum estimator. The MMSE-SPZC estimator is derived in [11] and the derived estimator is mainly based on the mean of the posteriori density conditioned on the degraded speech magnitude squared spectrum, rather than the complex noise spectrum. The authors have shown that the MMSE-SPZC estimator provides better suppression in noise than the rest of magnitude squared spectrum estimators such as Minimum Mean Square Error-Short time Power spectrum (MMSE-SP) and Maximum a Posteriori (MAP) Estimator [11]. The method and parameters used for the derivation of MMSE-SPZC estimator are as follows: ^ Method employed: Minimum Controlled Recursive Average (MCRA). ^ Sampling rate (Fs): 8 kHz. ^ Overlapping rate: 50%. ^ Window used: Hanning window. ^ Number of FFT points: floor ((20*Fs)/1000). C. Performance Measures The performance of existing methods and proposed method are evaluated from the standard measures. They are Perceptual Evaluation of Speech Quality (PESQ) and composite measures described below. PESQ The PESQ measure is an objective measure and it is strongly recommended by ITU-T for quality of speech assessment [23, 24]. The term PESQ is calculated as the linear sum of the average distortion value Dind and average asymmetrical distortion value Aind. It can be written as follows [25]: PESQ = b0 + b1Dind + b2Aind (4) where b0 = 4.5, b1 = -0.1 and b2 = -0.0309. Composite Measures Composite measures are the objective measures which can be used for the performance evaluation. The ratings and description of different scales are shown in Table 1. The composite measures are derived by multiple linear regression analysis [26]. The multiple linear regression analysis is used to estimate the three important composite measures [27] they are, > The composite measure for speech signal distortion (s). > The composite measure for background noise distortion (b). > The composite measure for overall speech signal quality (o). D. Performance Evaluation of Existing Methods A total of four English sentences are taken from TIMIT database that are degraded by musical, car, babble and street noises. For local language speech enhancement, four Kannada speech sentences are taken and these are also degraded by the same noises respectively. The performances of individual and proposed methods are evaluated are follows: ❖ Performance Evaluation of SS- VAD Method The experiments are conducted for both English and Kannada sentences. The performance measurement of SS-VAD method in terms of PESQ for English and Kannada sentences are as shown in Table 2 and Table 3 respectively. From the tables, it was observed that there is a less suppression of noise in degraded speech signals which were degraded by musical noise and it is the main drawback of SS-VAD method. The SS-VAD is robust in eliminating the noises such as street, babble, car and background noise etc., in corrupted speech signal shown in tables. The performance evaluation of SS-VAD method in terms of composite measures is shown in Table 4 and Table 5 for TIMIT and Kannada databases respectively. It gives poor speech quality of 3.1639 and 2.9039 for a musical noise compared to other types noises for both databases respectively. Therefore, it is very indeed to eliminate the musical noise in degraded speech signal to get good speech quality as like for the speech signals which were degraded by car, babble and street noises. ❖ Performance Evaluation of MMSE-SPZC Estimator The performance measurement of MMSE-SPZC estimator in terms of PESQ for TIMIT and Kannada speech databases are shown in Table 6 and Table 7 respectively. The tables show that there is a much improvement in PESQ for musical, car and street noises compared to babble noise. The poor speech quality is obtained for babble noise after the performance evaluation of the same method using composite measures for both the databases is shown in Table 8 and Table 9. Therefore, from the tables it was observed that, the speech sentences were degraded by babble noise should be enhanced efficiently to get good improvement in PESQ as well as good speech quality. E. Proposed Combined SS-VAD and MMSE-SPZC Estimator Method The SS-VAD method suppress the various types of noises reasonably such as babble noise, street noise, car noise, vocal noise and background noise etc. The main drawback of SS-VAD is that the suppression of musical noise in degraded speech signal is much less [2, 4-10]. The MMSE-SPZC is a robust method to suppress the musical noise and given a better results for car, street and white noises compared to babble noise [11]. Therefore, to overcome from the problem of suppression of musical and babble noises, a method is proposed. The proposed method is a combination of the above two methods which suppress the different types of noises including musical and babble noise reasonably under uncontrolled environment. The flowchart of the proposed method is shown in Fig.3. The output of SS-VAD is little noisier and musical noise is not suppressed as well. Therefore, the output of SS-VAD is passed through MMSE-SPZC estimator. The output of SS-VAD can be written as follows: |Xi(w)| = |Ci(w)|+ |µi(w)| (5) where w = 0, 1, 2, ..... L-1 and i = 0, 1, 2, . . . M-1. The term L indicates the length of FFT and M indicates the number of frames. The MMSE-SPZC estimator reduces the noise in SS-VAD output by considering the low SNR as well as high SNR regions with high intelligibility. The MMSE-SPZC estimator is derived by considering the mean of the posteriori density function of SS-VAD output x(n). ̂2k= E{X2k|Y2k} (6) ̂2k = ∫ ̂2k f X2k ( ̂2k| ̂2k) dX2k (7) where the term 1 = , Xk and Yk are the posteriori density functions of SS-VAD and proposed method outputs respectively. The description of performance measurement of proposed method in terms of PESQ for both the databases is shown in Table 10 and Table 11. From the tables, it was observed that there is much suppression in babble and musical noises with PESQ improvements of 0.6324, 0.7781 and 0.6224, 0.6781 for TIMIT and Kannada databases by proposed method compared to individual methods. The speech quality is much improved after the performance evaluation of proposed method using composite measures for both the databases is shown in Table12 and Table 13. Therefore, it can be inferred that there is better suppression of musical, babble and other noises using proposed method compared to individual methods. Hence, the proposed method is used for the speech enhancement of big Kannada speech database to build LMs and AMs using Kaldi. Fig.3. Flowchart of the proposed method. Table 1. The Description of The Speech Signal Distortion (S), Background Noise Distortion (B) And Overall Speech Quality (O) Scales Rating. Ratings Speech signal scale (s) Background noise scale (b) Overall scale (o) 1 Much degraded Very intrusive and conspicuous Very poor 2 Fairly degraded and unnatural Fairly intrusive and conspicuous Poor 3 Somewhat natural and degraded Not intrusive and can be noticeable Somewhat fair 4 Fairly natural with some degradation Little noticeable Good 5 Pure natural with no degradation Cannot noticeable Best and excellent Table 2. Performance Measurement of SS-VAD Method In Terms of PESQ for TIMIT Database. Method PESQ Measure Musical Car Babble Street SS-VAD Input PESQ 1.8569 2.6816 2.3131 1.7497 Output PESQ 2.1402 3.0823 2.8525 2.2935 PESQ Improvement 0.2933 0.4007 0.5394 0.5438 Table 3. Performance Measurement of SS-VAD Method In Terms of PESQ for Kannada Database. Method PESQ Measure Musical Car Babble Street SS-VAD Input PESQ 1.8469 2.5816 2.2131 1.7497 Output PESQ 2.1102 2.9082 2.8625 2.2935 PESQ Improvement 0.2633 0.4007 0.5494 0.5438 Table 4. Performance Evaluation of SS-VAD Method Using Composite Measure for TIMIT Database. Method Composite Measure Musical Car Babble Street SS-VAD Speech signal (s) 1.8017 3.6399 3.5213 2.7860 Background noise (b) 2.6670 2.2760 2.1245 1.9125 Overall speech quality (o) 3.1639 3.7759 3.4245 3.3182 Table 5. Performance Evaluation of SS-VAD Method Using Composite Measure for Kannada Database. Method Composite Measure Musical Car Babble Street SS-VAD Speech signal (s) 1.9017 3.1199 3.4313 2.2460 Background noise (b) 2.2370 2.2178 2.1245 1.9355 Overall speech quality (o) 2.9039 3.6659 3.1244 3.2112 Table 6. Performance Measurement MMSE-SPZC Estimator in Terms of PESQ for TIMIT Database. Estimator PESQ Measure Musical Car Babble Street Input PESQ 1.8569 2.3131 2.6816 1.7497 MMSE-SPZC Output PESQ 2.3669 3.0053 3.1637 2.3917 PESQ Improvement 0.5101 0.6922 0.4821 0.6420 Table 7. Performance Measurement MMSE-SPZC Estimator in Terms of PESQ for Kannada Database. Estimator PESQ Measure Musical Car Babble Street Input PESQ 1.8569 2.3131 2.6816 1.7897 MMSE-SPZC Output PESQ 2.3699 3.0753 3.1237 2.4167 PESQ Improvement 0.5131 0.6322 0.4421 0.6820 Table 8. Performance Evaluation of MMSE-SPZC Estimator using Composite Measure for TIMIT Database. Estimator Composite Measure Musical Car Babble Street MMSE-SPZC Speech signal (s) 4.5796 3.8336 3.9336 3.1252 Background noise (b) 3.4031 2.5671 2.1289 2.1211 Overall speech quality (o) 4.4565 3.2678 3.1025 3.6034 Table 9. Performance Evaluation of MMSE-SPZC Estimator using Composite Measure for Kannada Database. Estimator Composite Measure Musical Car Babble Street MMSE-SPZC Speech signal (s) 4.3496 3.1236 3.2236 3.0052 Background noise (b) 3.2131 2.4571 2.2389 2.1011 Overall speech quality (o) 4.0075 3.2178 3.1725 3.2334 Table 10. Performance Measurement of Combined SS-VAD and MMSE-SPZC Estimator In Terms of PESQ for TIMIT Database. Proposed method PESQ Measure Musical Car Babble Street SS-VAD and MMSE-SPZC Input PESQ 1.8569 2.6816 2.3131 1.7497 Output PESQ 2.4893 3.2940 3.0912 2.4601 PESQ Improvement 0.6324 0.6124 0.7781 0.7204 Table 11. Performance Measurement of Combined SS-VAD and MMSE-SPZC Estimator in Terms of PESQ for Kannada Database. Proposed method PESQ Measure Musical Car Babble Street SS-VAD and MMSE-SPZC Input PESQ 1.8249 2.1216 2.0031 1.4597 Output PESQ 2.4473 2.722 2.6812 2.0801 PESQ Improvement 0.6224 0.6004 0.6781 0.6204 Table 12. Performance Evaluation of Combined SS-VAD and MMSE-SPZC Method using Composite Measure for TIMIT Database. Method Composite Measure Musical Car Babble Street Proposed method Speech signal (s) 3.1204 3.6319 3.5689 2.6052 Background noise (b) 2.6920 2.4780 2.8569 1.9098 Overall speech quality (o) 4.5409 4.2002 4.2356 4.1201 Table 13. Performance Evaluation of Combined SS-VAD and MMSE-SPZC Method using Composite Measure for Kannada Database. Method Composite Measure Musical Car Babble Street Proposed method Speech signal (s) 3.222 3.1219 3.1189 2.3452 Background noise (b) 2.3920 2.3480 2.3469 1.8898 Overall speech quality (o) 4.4409 4.111 4.3456 4.2212 IV. Building LMs and AMs for Noisy and Enhanced Speech Data The LMs and AMs play an important role in building an ASR system. The following steps are used for the development of LMs and AMs: V Transcription of speech data collected from the farmers. V Validation of transcribed speech data. V Transcription of enhanced speech data V Creation of Kannada phoneme set. V Creation of dictionary. V Training and testing using Kaldi. A. Transcription of Noisy Speech Data Collected under Uncontrolled Environment The collected speech data needs to be transcribed manually at word level by the transcriber. The mandi name “sakaleshapura” is transcribed by using the Indic Language Transliteration Tool (IT3 to UTF-8) is shown in Fig. 4. The silence phones such as Fig.4. The Indic Language Transliteration Tool used for transcribing the speech data. B. Validation of Transcribed Speech Data If the transcription of speech data is done wrongly, then the validation tool is used to correct the transcribed speech data is shown in Fig.5. Fig.5. The validation tool to validate the transcribed speech data. From the Fig. 5, it can be observed that the speech signal “sakaleishapura” is affected by background noise during speech data collection. Unknowingly the transcriber has transcribed that speech signal as “sakaleshapura” only. In this type of cases the validation tool is used to correct the transcribed data and it is validated as sakaleishapura AGMARKNET database. The Table 15 shows the dictionary for some districts, mandis and commodities. The left part of the dictionary is created by using IT3: UTF-8 and right part of the dictionary is created by ILSL12. C. Transcription of Enhanced Speech Data The speech data collected from the farmers in the field is degraded by various degradations. Therefore, the proposed combined SS-VAD and MMSE-SPZC noise elimination technique is used to eliminate the different types of noises presented in the collected speech data. Once the noise elimination process is completed, the transcriber needs to transcribe the enhanced speech data by hearing the speech sound individually using the same transcription tool. The same validation procedure is used for the validation of transcribed enhanced speech data. D. Kannada Phoneme Set Creation Kannada language is one of the most widely used Dravidian languages in India mainly in Karnataka state. Kannada language consists of 14 vowels, 32 consonants and 2 part vowel, part consonant. The consonants are made in to two categories namely. ^ Structured consonants. ^ Unstructured consonants. The classification of structured consonants is mainly depends on the tongue touches the mouth palate. They are velars, palatals, retroflex, dentals and labials. The pronunciation of unstructured consonants does not touch the mouth palate and this makes a difference between the structured consonants and unstructured consonants. The label used from the Indic Language Transliteration Tool (IT3 to UTF-8) for Kannada phonemes is shown in Table 14. Table 14. The Labels used From The Indic Language Transliteration Tool (It3 To Utf-8) For Kannada Phonemes. Label set using IT3: UTF-8 Corresponding Kannada phonemes a oo t:h ph ಅ ಓ ಠ ಫ aa au d b ಆ ಔ ಡ ಬ i k d:h bh ಇ ಕ ಢ ಭ ii kh nd~ m ಈ ಖ ಣ ಮ u g t y ಉ ಗ ತ ಯ uu gh th r ಊ ಘ ಥ ರ e c d l ಎ ಚ ದ ಲ ee ch dh v ಏ ಛ ಧ ವ ai j n sh ಐ ಜ ನ ಶ o t: p s ಒ ಟ ಪ ಸ E. Dictionary Creation The dictionary is created by using both IT3: UTF-8 tool and Indian Language Speech sound Label (ILSL12) set. In this work the dictionary (lexicon) is created for all districts, mandis and commodities of Karnataka as per Table 15. Lexicon For Some of Districts, Mandis and Commodities. Label set using IT3: UTF-8 Label set using ILSL12 daavand~agere d aa v a nx a g e r e daavand~agere d aa v a nx g e r e daavand~agere d aa v a n g e r e gadaga g a d a g a gadaga g a d a g gadaga g a d g a bel:agaavi b e lx a g aa v i bel:agaavi b e lx g aa v i bel:agaavi b e lx g aa m hiriyuuru h i r i y uu r u hiriyuuru h i r y uu r hiriyuuru h i r y uu r u hubbal:l:i h u bb a llx i hubbal:l:i h u b lx i hesarukaal:u h e s a r u k aa lx u hesarukaal:u h e s r u k aa lx u sajje s a jj e kusube k u s u b e kusube k u s b e raagi r aa g i kittal:ehand~nd~u k i tt a lx e h a nnx u kittal:ehand~nd~u k i tt lx e h a nnx u kittal:ehand~nd~u k i tt l e h a nnx u akki a kk i mekkejool:a m e kk e j oo lx a alasan:d:e a l a s a nx dx e akki a kk i jool:a j oo lx a mend~asinkaayi m e nx a s i n a k aa y i alas an:d:e a l a s a n dx e hurul:ikaal:u h u r u lx i k aa lx u hatti h a tt i kuri k u r i kool:i k oo lx i ettu e tt u emme e mm e hon:gebiija h o n g e b ii j a halasinahand~nd~u h a l a s i n a h a nnx u el:l:u e llx u niilagiri n ee l a g i r i goodhi g oo dh i avare a v a r e ten:gu t e n g u ad:ike a dx i k e The labels used from the ILSL12 set for Kannada phonemes are shown in Table 16. Table 16. The Labels Used From ILSL12 Set For Kannada Phonemes. ILSL12 Label set Kannada phonemes a oo txh ph ಅ ಓ ಠ ಫ aa au dx b ಆ ಔ ಡ ಬ i k dxh bh ಇ ಕ ಢ ಭ ii kh nx m ಈ ಖ ಣ ಮ u g t y ಉ ಗ ತ ಯ uu gh th r ಊ ಘ ಥ ರ e c d l ಎ ಚ ದ ಲ ee ch dh w ಏ ಛ ಧ ವ ai j n sh ಐ ಜ ನ ಶ o tx p s ಒ ಟ ಪ ಸ F. Training and Testing using Kaldi The system training and testing using Kaldi is done in two phases, one for noisy speech data and another for enhanced speech data. The 75% and 25% of validated speech data is used for training and testing respectively. The number of speech files used for system training and testing is shown in Table 17. Table 17. The Speech Files used for Training and Testing. Kannada Speech data Number of train files Number of test files Overall noisy speech data 55523 15234 Overall enhanced speech data 54234 15034 The LMs and AMs are developed for 50 hours of speech data. Totally, 70757 isolated speech utterances are used for overall noisy speech data training and testing. In that, 55523 utterances used for system training and 15234 utterances used for testing to build ASR models for overall noisy speech data. Likewise, 69268 utterances were used for overall enhanced speech data training and testing using Kaldi. In this, 54234 utterances used for system training and 15034 utterances used for testing to build ASR models for overall enhanced speech data as shown in Table 17. V. Results and Discussions In this work, 62 non silence phones, 9 silence phones are used and “sil” is used as optional silence phone. The LMs and AMs are created at different phoneme levels as shown below. > Mono Phone Training and Decoding. > Triphonel: Deltas + Delta-Deltas Training and Decoding. > Triphone2: Linguistic Data Analysis (LDA) + Maximum Likelihood Linear Transform (MLLT) Training and Decoding. The 600 senons and 4, 8 and 16 Gaussians mixtures are used to build ASR models at mono phone, triphone1 and triphone2 levels. Table 18 depicts the description of WERs at mono phone and tri phone levels for overall noisy speech data (combined districts, mandis and commodities). The WERs of 34.04% and 17.01% is achieved for mono phone and tri phone 2 levels with 600 senons and 16 Gaussian mixtures. The WERs of 30.11% and 13.18% is obtained for enhanced speech data for mono phone and tri2 with 600 senons and 16 Gaussian mixtures shown in Table 19. Table 18. The Description of WERs at Different Phoneme Levels for Overall Noisy Speech Data that Includes Districts, Mandis and Commodities of Karnataka as per AGMARKNET Website. Phonemes WER 1 WER 2 WER 3 WER 4 WER 5 WER 6 mono 34.18 34.04 34.88 34.66 34.55 34.43 tri1_600_2400 21.83 21.80 21.72 21.64 21.61 21.56 tri1_600_4800 20.27 20.19 20.13 20.10 20.06 20.01 tri1_600_9600 20.46 20.42 20.34 19.35 19.36 19.32 tri2_600_2400 18.42 18.41 18.35 18.32 18.22 18.23 tri2_600_4800 17.44 17.39 17.36 17.32 17.28 17.27 tri2_600_9600 17.42 17.38 17.01 17.28 17.25 17.99 Table 19. The Description of WERs at Different Phoneme Levels for Overall Enhanced Speech Data that Includes Districts, Mandis and Commodities of Karnataka as per AGMARKNET Website. Phonemes WER 1 WER 2 WER 3 WER 4 WER 5 WER 6 mono 30.18 30.40 30.11 30.23 30.55 30.45 tri1_600_2400 17.13 17.00 17.12 17.34 17.11 17.16 tri1_600_4800 16.27 16.19 16.13 16.00 16.16 16.11 tri1_600_9600 15.46 15.42 15.44 15.35 15.36 15.22 tri2_600_2400 14.44 14.41 14.35 14.32 14.11 14.33 tri2_600_4800 13.11 13.49 13.16 13.32 13.88 13.27 tri2_600_9600 13.42 13.18 13.81 13.28 13.25 13.99 From the above tables, it can be observed that there is significant improvement in accuracy with less WER for enhanced speech data. Approximately, 4% of accuracy is improved for the speech data after speech enhancement. V I. Summary and Conclusions In this work, 50 hours of farmers speech data is collected across different dialect regions of Karnataka state to capture all possible pronunciations. A combined SS-VAD and MMSC-SPZC method was proposed to enhance the collected speech data. The Kannada phoneme set and corresponding dictionary is created for Kannada language. The proposed method suppressed the different types of noises significantly compared to individual methods. The 75% and 25% of validated speech data was used for system training and testing respectively. The ASR models were developed for both noisy and enhanced Kannada speech database. Using Kaldi recipe and Kannada language resources, the achieved WERs are 17.01% and 13.18% for noisy and enhanced speech data respectively. The future challenging work is to develop the spoken query system for Kannada language using the developed ASR models of enhanced speech data. Acknowledgement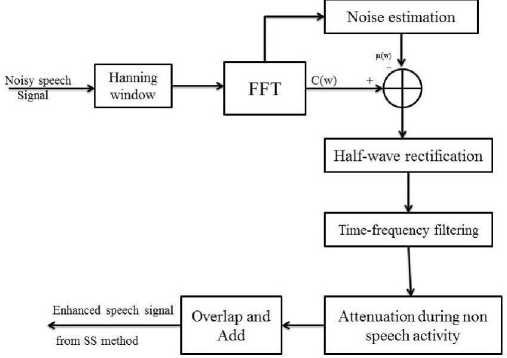
and are used in transcription to indicate the start and end of speech.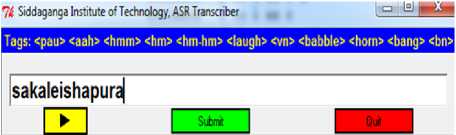
References Creation and comparison of language and acoustic models using Kaldi for noisy and enhanced speech data
- Rabiner L, and B.H. Juang. “Fundamentals of speech recognition”, Upper Saddle River, NJ, USA: Prentice- Hall, Inc, 1993.
- P. Loizou “Speech Enhancement: Theory and Practice”, 1st ed. Boca Raton, FL: CRC Taylor & Francis, 2007.
- J. Ramirez, J. M. Gorriz and J. C. Segura, “Voice Activity Detection. Fundamentals and Speech Recognition System Robustness”, 2003.
- S. Boll “Suppression of Acoustic Noise in Speech Using Spectral Subtraction”, IEEE Trans.Acoust., Speech, Signal Process, vol. 2, ASSP-27, pp.113-120, April. 1979.
- S. Kamath and P. Loizou, “A multi-band spectral subtraction method for enhancing speech corrupted by colored noise”, in Proc. IEEE Int. Conf. Acoust., Speech, Signal process., Orlando, USA, May. 2002.
- Jounghoon Beh, Hanseok Ko “A novel spectral subtraction scheme for robust speech recognition: spectral subtraction using spectral harmonics of speech”, IEEE Int. Conf. on Multimedia and Expo, vol.3, pp.I-648,I-651, April 2003.
- Cole C, Karam M, Aglan H “Spectral subtraction of Noise in Speech Processing Applications”, 40th Southeastern Symposium System Theory, SSST-2008, pp.50-53, 16-18 March 2008.
- Goodarzi H.M, Seyedtabaii S “Speech Enhancement using Spectral Subtraction based on a Modified Noise Minimum Statistics Estimation”, Fifth Joint Int. Conf, pp.1339,1343, 25-27 Aug. 2009.
- Y. Ephraim and D. Malah “Speech enhancement using a minimum mean square error short-time spectral amplitude estimator”, IEEE Trans. Acoust., Speech, Signal Process., vol. ASSP-32, no. 6, pp. 1109-1121, Dec. 1984.
- Y. Ephraim and D. Malah “Speech enhancement using a minimum mean square error log-spectral amplitude estimator”, IEEE Trans. Acoust., Speech, Signal Process., vol. ASSP-33, no. 2, pp. 443-445, Apr. 1985.
- Yang Lu and Philipos C. Loizou “Estimators of the Magnitude-Squared Spectrum and Methods for Incorporating SNR Uncertainty”, IEEE Trans. on Audio, Speech, and Language processing, vol. 19, no. 5, July. 2011.
- P. J. Wolfe and S. J. Godsill, “Simple alternatives to the Ephraim and Malah suppression rule for speech enhancement”, in Proc. 11th IEEE Signal Process. Workshop Statist. Signal Process., pp. 496-499, Aug. 2001.
- Rainer Martin, “Speech Enhancement Based on Minimum Mean-SquareError Estimation and Supergaussian Priors”, IEEE Trans. on Speech and Audio Processing, vol. 13, no. 5, September. 2005.
- Philipos C. Loizou, “Speech Enhancement Based on Perceptually Motivated Bayesian Estimators of the Magnitude Spectrum”, IEEE Trans. on Speech and Audio Processing , vol. 13, no. 5, Sep. 2005.
- Rabiner L. R, “Applications of Speech Recognition in the Area of Telecommunications”, IEEE Workshop on Automatic Speech Recognition and Understanding Proceedings, pp. 501-510, 1997.
- Daniel Povey, et al., “The Kaldi Speech Recognition Toolkit, Workshop on Automatic Speech Recognition and Understanding”, , US IEEE Signal Processing Society, Hilton Waikoloa Village, Big Island, Hawaii 2011.
- Ahmed Ali, Yifan Zhang, Cardinal P, Dahak N, Vogel S, Glass J, “A complete KALDI recipe for building Arabic speech recognition systems”, Spoken Language Technology Workshop (SLT), IEEE, South Lake Tahoe, NV, pp. 525-529, Dec. 2014.
- Patrick Cardinal and Ahmed Ali, et al., “Recent advances in ASR Applied to an Arabic transcription system for Al-Jazeera”, Proceedings of the Annual Int. Conf. on Speech Communication, Singapore, pp. 2088-2092, 2014.
- Alexey Karpov a, Konstantin Markov, et al., “Large vocabulary Russian speech recognition using syntactico-statistical language modeling”, Speech Communication, vol. 56, pp. 213-228, Jan. 2014.
- Shahnawazuddin S, Deepak Thotappa, B D Sarma, et al., “Assamese Spoken Query System to Access the Price of Agricultural Commodities”, National Conference on Communications (NCC), New Delhi, India, pp. 1-5, 2013.
- Agricultural Marketing Information Network - AGMARKNET, http://agmarknet.nic.in.
- T. Lotter and P. Vary, “Speech enhancement by map spectral amplitude estimation using a super-Gaussian speech model,” EURASIP J. Appl. Signal Process., vol. 2005, no. 1, pp. 1110–1126, 2005.
- A. Rix, J. Beerends, M. Hollier, and A. Hekstra, “Perceptual evaluation of speech quality (PESQ)-A new method for speech quality assessment of telephone networks and codecs”, in Proc. IEEE Int. Conf. Acoust., Speech, Signal Process., vol. 2, pp. 749-752, 2001.
- “Perceptual evaluation of speech quality (PESQ), and objective method for end-to-end speech quality assessment of narrowband telephone networks and speech codecs”, ITU, ITU-T Rec. P. 862, 2000.
- Yi Hu and Philipos C. Loizou, “Evaluation of Objective Quality Measures for Speech Enhancement”, IEEE transactions on Audio, Speech, and Language Processing, vol. 16, no. 1, Jan. 2008.
- Y. Hu and P. Loizou, ”Subjective comparison of speech enhancement algorithms”, in Proc. IEEE Int. Conf. Acoust., Speech, Signal Process., vol. 1, pp. 153-156, 2006.
- Yi Hu and Philipos C. Loizou, “Evaluation of Objective Quality Measures for Speech Enhancement”, IEEE transactions on Audio, Speech, and Language Processing, vol. 16, no. 1, Jan. 2008.
- Sunnydayal. V, N. Sivaprasad, T. Kishore Kumar,"A Survey on Statistical Based Single Channel Speech Enhancement Techniques", International Journal of Intelligent Systems and Applications(IJISA), vol.6, no.12, pp.69-85, 2014. DOI: 10.5815/ijisa.2014.12.10.
- Ravi Kumar. K, P.V. Subbaiah, "A Survey on Speech Enhancement Methodologies", International Journal of Intelligent Systems and Applications (IJISA), Vol.8, No.12, pp.37-45, 2016. DOI: 10.5815/ijisa.2016.12.05.
