Creation of software for research of Rossler attractor

Author: Ilichev V.Y.
Journal: Международный журнал гуманитарных и естественных наук @intjournal
Section: Технические науки
Article in issue: 5-1 (56), 2021.
Free access
The work examines the basic concepts of the theory of nonlinear dynamic systems, under certain conditions exhibiting the properties of both perseverance and chaoticism. In particular, the characteristics of the Rössler attractor are given. Described the functions and special libraries used in the Python program, designed to visualize and study the parameters of the Rössler system that change over time. Examples of calculations performed with the help of the program have been analyzed. The scope of application of the developed program is proposed.
Chaos theory, rössler attractor, phase space, python language, data distribution
Short address: https://sciup.org/170188849
IDR: 170188849 | DOI: 10.24412/2500-1000-2021-5-1-31-35
Создание программных средств исследования аттрактора Рёсслера
В работе рассматриваются основные понятия теории нелинейных динамических систем, при определённых условиях проявляющих свойства как упорядоченности, так и хаотичности. В частности, приведены характеристики аттрактора Рёсслера. Описываются функции и специальные библиотеки, применённые в программе на языке Python, предназначенной для визуализации и исследования изменяющихся с течением времени параметров системы Рёсслера. Разобраны примеры выполненных с помощью программы вычислений. Предложены сферы применения разработанной программы.
Text of the scientific article Creation of software for research of Rossler attractor
One of the most characteristic representatives of systems considered in chaos theory is the dynamic system described by the Rössler differential equations [1]. Solving these equations depending on the given coefficients can form both a chaotic (but deterministic) and ordered process in the three-dimensional phase space of the parameters x, y, z. However, even in the case of chaos, there are points of attraction of phase trajectories, so this system is called the Rössler attractor.
The system of Rössler equations has the form:
dx dt
^-
dy
< — = x + ay dt dz
— = b + z (x - c) dt where a, b, c are constant multipliers.
The Rössler equations describe many processes actually taking place in nature – the flow of liquids and gases, the course of chemical reactions, the processes taking place at the molecular level [2], so their solution and detailed study is an important task for practice.
Since the process described by the equations is dynamic (time-dependent) and the presented system of differential resources can only be solved by numerical methods [3], a program must be created to study it. It should visualize the phase trajectory depending on the values of constant factors and on time, as well as output some additional characteristics of the process to identify the regularities of its course.
To write the program code, a freely distributed Python programming language [4] was chosen, to which all the modules necessary to solve the task are connected.
The program consists of the following functional units:
-
1. Import libraries for Python: Tkinter and PIL – to form an interface; Os – for interaction with the operating system; Numpy - to work with data matrices [5]; Scipy [6] – for
-
2. Creates a convenient user interface.
-
3. Creates a function containing the Rössler equations.
-
4. Implementation of a numerical solution procedure of a system of ordinary differential
-
5. Displays the 3D image of the attractor in the x, y, z coordinate system.
-
6. Displays the x, y, z movement graphs based on time.
-
7. Calculates and constructs statistical distributions of x, y, z parameters.
the implementation of numerical methods for solving Rössler differential equations; Seaborn [7], Pylab [8], Mpl_toolkits – to process and output the results of solving the equations in graphic form.
equations with the possibility of choosing a solution method.
The program interface is shown in Figure 1.
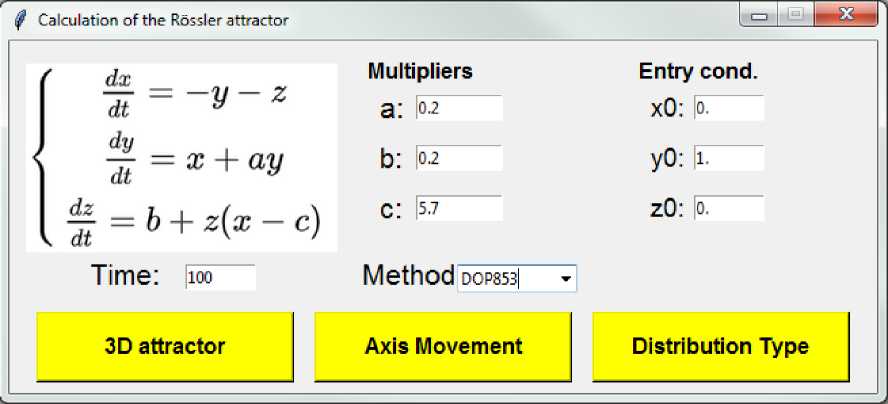
Figure 1. The program interface
The created interface allows you to set the coefficients of the equations a, b, c, the time (duration) of the gap in which the solution of the system is located, the initial values of the coordinates of the phase space x 0 , y 0 , z 0 .
It is also possible to select a numerical solution method from the 6 possible ones implemented by the Skipy library solve_ivp function. The solutions found with this func- tion populate the matrices from which you can output the results graphically.
At first, a solution was made to the Rössler equation system with default parameters (Figure 1). The most accurate method for solving the system of equations DOP853 was chosen.
The image of the Rössler attractor obtained by pressing the “3D attractor” button is shown in Figure 2.
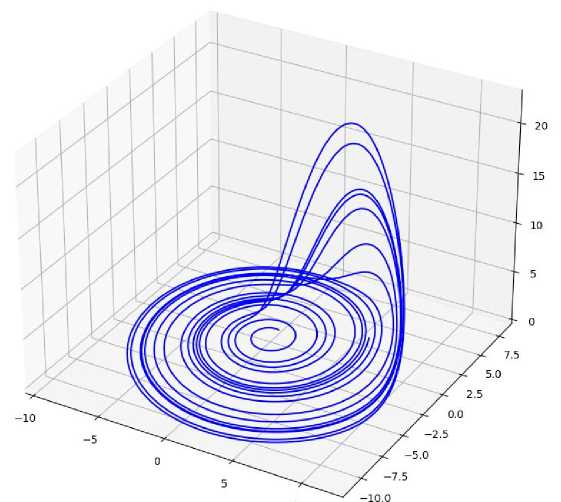
Figure 2. Rössler attractor calculated with default parameters
This figure demonstrates a chaotic process, however, having the characteristic form of phase trajectories (and the area of attraction), that is, it is not a noise phenomenon.
When you press the “Axis Movement” interface button, the phase path projections on the x, y, z axis are displayed (Figure 3).
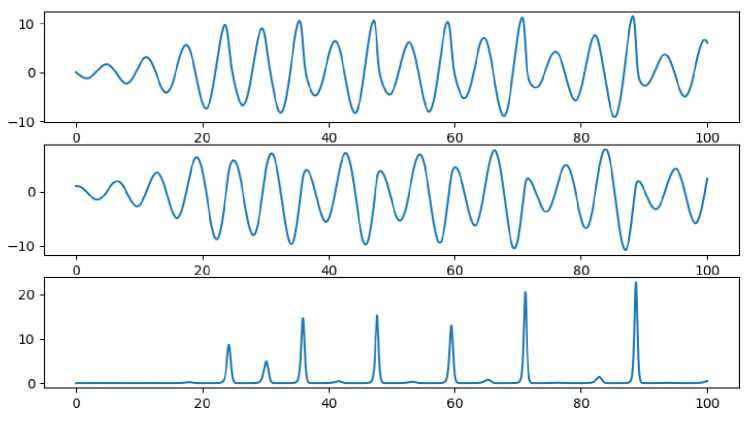
Figure 3. Changes in x, y, z coordinates based on time
Here, laws can already be traced - the periodicity of each coordinate changes is clearly manifested, although the periods and amplitude of oscillations vary somewhat over time. Oscillations on each axis are characterized by their structure. It can also be concluded from Figure 3 that the method of probability theory can be applied to amplitudes - to find a type of statistical distribution of data [9]. You can do this by clicking on the “Distribution Type” interface button. Since at the initial time interval at the considered interval t=100 the oscillation structure is still unstable, it was decided to choose a larger time limit t=10000.
The obtained types of distribution of parameters x, y, z are shown in Figure 4.
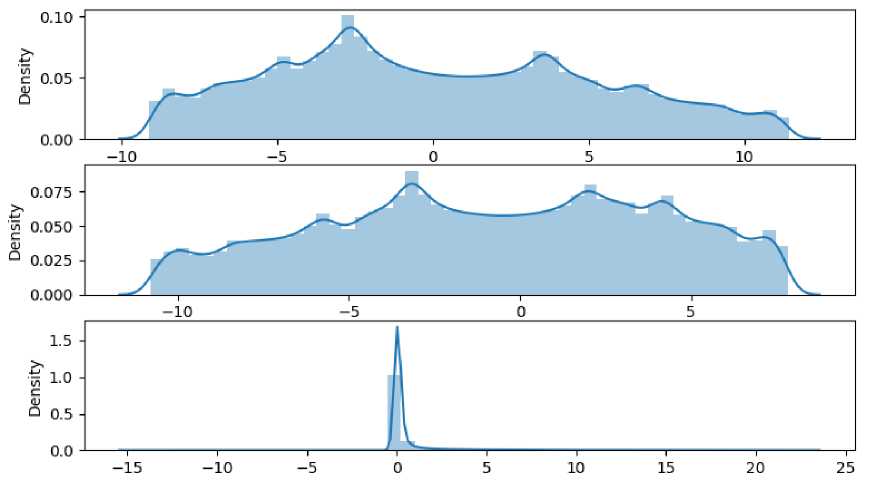
Figure 4. The distribution types of the x, y, z parameters
In the case under consideration, Figure 4 clearly shows the form of manifestation of the randomness of the Rössler attractor - along the axes x,y there are boundaries of the distribution of parameters (although quite wide), and along the z axis there is a sluggish peak in general, indicating a high degree of ordering of this parameter.
Similarly, you can investigate the patterns of behavior of the Rössler attractor with other initial data specified in the interface - a large number of numerical experiments carried out using the created program allow you to identify areas of stability and chaos, as well as quantify the degree of chaos.
Thus, the goal of the work is fully achieved - a program has been developed that calculates the characteristics of the Rössler system at any given parameters, as well as outputs in 3D coordinates the phase trajectory of the attractor and in 2D coordinates of the graph of changes in parameters over time and their phase portraits.
At the same time, it has been proved that the Python programming language allows you to successfully solve systems of ordinary differential equations and has the entire arsenal of tools for creating a perfect attractor research tool - from creating a user interface to outputting visual graphics. The developed program and the created methodology can be used in educational and scientific works when studying dynamic systems [10], which exhibit both orderly and chaotic behavior in different conditions.
References Creation of software for research of Rossler attractor
- Wu H., Xu B.L., Fan C., Wu X.Y. Chaos synchronization between unified chaotic system and Rossler system // Applied Mechanics and Materials. 2013. Т. 321-324. P. 2464-2470.
- Guzenko P.Yu., Lehnert J., Scholl E. Application of adaptive methods to chaos control of networks of Rossler systems // Cybernetics and Physics. 2013. Т. 2. № 1. P. 15-24.
- Eneeva L.M., Pskhu A.V., Rekhviashvili S.Sh. Ordinary differential equation with left and right fractional derivatives and modeling of oscillatory systems // Mathematics. 2020. Т. 8. № 12. P. 2122.
- Ilichev V.Yu. Development of procedure for determination of characteristics of heated polycarbonate greenhouses // International Research Journal. 2021. №2-1 (104). P. 132-135.
- Ilichev V.Y. Development of program for determination of fractal dimensions of images // International Research Journal. 2021. № 4-1 (106). P. 6-10.
- Olivier B.G., Rohwer J.M., Hofmeyr J.-H.S. Modelling cellular processes with Python and Scipy. // Molecular Biology Reports. 2002. Т. 29. № 1-2. P. 249-254.
- Iyer S.G., Pawar A.D. Machine learning model for predicting price of processors using multivariate linear regression // Proceedings of the 2nd International Conference on Smart Systems and Inventive Technology, ICSSIT 2019. 2019. №2. P. 52-56.
- Carbó-Dorca R., Barragán D. Communications on quantum similarity (4): collective distances computed by means of similarity matrices, as generators of intrinsic ordering among quantum multimolecular polyhedra // Wiley Interdisciplinary Reviews: Computational Molecular Science. 2015. Т. 5. №5. P. 380-404.
- Dychka I., Sulema Y., Rudenko C. A mathematical model of microsurface normal distribution for specular bidirectional reflectance distribution function // CEUR Workshop Proceedings. ACIT 2018. 2018. P. 30-33.
- Sukhinets Z.A., Gulin A.I., Krasnov A.N. Smart dynamic weighing system // Proceedings - 2020 International Conference on Industrial Engineering, Applications and Manufacturing, ICIEAM 2020. 2020. P. 91-92.
