Creation of video summary with the extracted salient frames using color moment, color histogram and speeded up robust features

Author: Ashiqur Rahman, Shamim Hasan, S.M. Rafizul Haque
Journal: International Journal of Information Technology and Computer Science @ijitcs
Article in issue: 7 Vol. 10, 2018.
Free access
Over the last few years, the amount of video data has increased significantly. So, the necessity of video summarization has reached a new level. Video summarization is summarizing a large video with a fewer number of frames keeping the semantic content same. In this paper, we have proposed an approach which takes all the frames from a video and then shot boundaries are detected using the color moment and SURF (Speeded Up Robust Features). Then the redundancy of the similar frames is eliminated using the color histogram. Finally, a summary slide is generated with the remaining frames which are semantically similar to the total content of the original video. Our experimental result is calculated on the basis of a questionnaire-based user survey which shows on average 78% positive result whereas 3.5% negative result. This experimental result is quite satisfactory in comparison with the existing techniques.
Video summarization, color moment, speeded up robust features, color histogram, Euclidean distance
Short address: https://sciup.org/15016277
IDR: 15016277 | DOI: 10.5815/ijitcs.2018.07.03
Text of the scientific article Creation of video summary with the extracted salient frames using color moment, color histogram and speeded up robust features
Published Online July 2018 in MECS
Today we live in such a world where every day we have to use different technological devices a lot. We just cannot pass our day to day life without using personal computer or smartphones. With the fast development of multimedia technology and smartphones and other camera-oriented devices, more and more video data are captured and stored. The content of video media is very rich and this increasing number of digital video is a great challenge for the management and maintenance of the video database.
Browsing this vast volume of video data and managing its content has become very important. A video is a collection of video frames where each frame is a still image. When a video is being played, each frame is being displayed sequentially with a certain frame rate. With granularity from small to large, the segmentation results can be frame shot, scene and video. Shot is a sequence of frames recorded in a single-camera operation. Scene is a collection of consecutive shots that have semantic similarity in object, person, space and time. No matter what kind of video format is used, this is a huge amount of data and it is inefficient to handle a video by using all the frames it has. There may be many types of video according to the camera operation and orientation like egocentric, static and moving [1]. Egocentric video are the videos captured by wearable cameras [2]. When the video is captured keeping the camera static, it is termed as static video and when video is captured by a cameraman holding at different positions, it is moving video [1].
Video summarization means the most interesting and attractive parts of a video, while a summary sequence renders the impression of the content of an entire video [3]. It means producing a compact version of a full-length video, ideally encapsulating its most informative parts [4]. From a summarized content of a video, one can guess the overall video content. To generate a summary layout of a video and/or to select a frame that represents a video, existing methods show a comparatively poor result [3]. In order to overcome this limitation, a new approach has been proposed for the video summary and to create a slide show from the important and most occurrent video frames.
In this paper, section 2 describes different techniques used in the system architecture and related works. Section 3 describes the system architecture of our proposed method elaborately. In section 4, the experiment and user survey are discussed. Section 5 discusses about the results obtained from a human relevance feedback survey on the basis of questionnaire. Finally, section 6 describes the conclusion and future work.
-
II. Related Works
Digital video means the video picture and audio information stored in the computer using digital format [5]. Before discussing the details of the existing methods for the video summarization, we give some fundamental views on video. Video consists of a collection of video frames, where each frame is a still image. When a video is being played, each frame is being displayed sequentially with a certain frame rate. The typical frame rates are 30 and 25 frames/second as found in the various video formats. An hour of video has 108,000 or 90,000 frames if it has a 30 or 25 frames/second rates, respectively [5]. No matter what kind of video format is used, this is a huge amount of data and it is inefficient to handle a video by using all the frames it has. To address this problem, video is divided into segments and more important and interesting segments are selected for a shorter form — a video summarization [5]. With granularity from small to large, the segmentation results can be frame shot, scene and video [5].
There are two types of video abstraction, video summary and video skimming [5]. Video summary, also called a still abstract, is a set of salient images (key frames) selected or reconstructed from an original video sequence. Video skimming, also called a moving abstract , is a collection of image sequences along with the corresponding audios from an original video sequence [5].
-
A. Frame Features
For summarizing a video, the salient images from a large set of video frames need to be extracted. So, for extracting the salient frames, features of the images have to be investigated.
Feature extraction means mapping the image pixels into the feature space. Using this extracted feature, we can search, index and browse the image from the stored database and this feature can be used to measure the similarity between the stored images [3].
There may be low level, mid-level or high-level features. Low level features are the color and textures of an image.
Color Feature: Color features are the most widely used visual features in image retrieval because they are easier to extract compared to texture and shape information [4]. One of the main aspects of color feature extraction is the choice of a color space. A color space is a multidimensional space in which the different dimensions represent the different components of color [6].
RGB Color Space: An example of a color space is RGB, which assigns to each pixel a three-element vector representing the color intensities of the three primary colors, red, green and blue [6]. The space, spanned by the R, G, and B values, completely describes visible colors, which are represented as vectors in the 3D RGB color space. As a result, the RGB color space provides a useful starting point for representing color features of images. However, the RGB color space is not perceptually uniform. More specifically, equal distances in different intensity ranges and along different dimensions of the 3D RGB color space, do not correspond to equal perception of color dissimilarity [6].
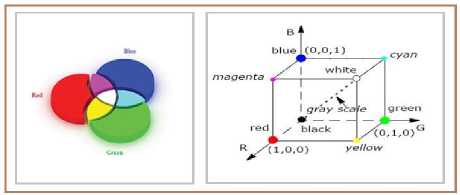
Fig.1. RGB color space
Color Histogram : The main method of representing color information of images in CBIR systems is through a color histogram. A color histogram is a type of bar graph, where each bar represents a particular color of the color space being used [7]. The bars in a color histogram are referred to as bins and they represent the x-axis [8]. The number of bins depends on the number of colors in an image. The y-axis denotes the number of pixels in each bin. In other words, it shows how many pixels in an image are of a particular color. It is a combination of three histograms based on the R, G, and B channels of the RGB color space. A color histogram can be also denoted by the joint probabilities of the intensities of the three-color channels [3]. The color histogram is defined as
H, G:B [ r , g , b ] = N . Prob { R = r , G = g , B = b } ? (1)
where in R, G and B are the three-color channels and N is the number of pixels in the image.
Color Moment: Color moments have been successfully used in many retrieval systems. The first order (mean), the second order (variance) and the third order (skewness) color moments have been proved to be efficient and effective in representing color distributions of images [3,8].
The variance (V£) is the variation from the mean of the distribution which is the second moment.
V^lyNUPij-Eij)2(2)
Here, Et represents the mean color value of image which is the first order moment.
E .X'j p(3)
Skewness ( St ) can be defined as a measure of the degree of asymmetry in the distribution and this is known as the third order moment.
Si = VV(4)
Here, i th color channel at the jth image pixel as Pt j and N is the number of pixels in the image.
-
B. Scale Invariant Feature Transform (SIFT)
The scale-invariant feature transform (SIFT) is an algorithm in computer vision to detect and describe local features in images. The algorithm was patented in Canada by the University of British Columbia and published by David Lowe in 1999 [9]. SIFT keypoints of objects are first extracted from a set of reference images and stored in a database. An object is recognized in a new image by individually comparing each feature from the new image to this database and finding candidate matching features based on Euclidean distance of their feature vectors [10]. Though this SIFT descriptor was widely used before, but it has become somewhat obsolete after SURF has come.
-
C. Speeded Up Robust Features (SURF)
SURF (Speeded Up Robust Features) is a robust local feature detector, first presented by Herbert Bay, Tinne Tuytelaars, and Luc Van Gool in 2006 [11]. It is partly inspired by the SIFT descriptor. This method is several times faster than traditional SIFT Operator [11]. SURF is based on sums of 2D Haar wavelet responses and makes an efficient use of integral images [12]. It uses an integer approximation to the determinant of Hessian blob detector, which can be computed extremely quickly with an integral image. The equation of Hessian Matrix can be viewed as [11]:
ГГ/ \ [ ^ XX (p,o ^ xy (p, o)
H(p,o) = (5) Lyx(p,o) L yy (p,a)
where L xx (p, σ) etc. is the convolution of the second-order derivative of gaussian with the image I(x,y) at the point x. The box filter of size 9×9 is an approximation of a Gaussian with σ=1.2 and represents the lowest level (highest spatial resolution) for blob-response maps [11,12].
For features, it uses the sum of the Haar wavelet response around the point of interest. Again, these can be computed with the aid of the integral image. Then the number of extracted features from each image is 64 as the image is divided into 4×4 square sub regions and 4 features are obtained from each sub region [11].
-
D. Some Mostly Related Works
Video summarization is relatively a new research area. So, there are not many works found in the literature. Still the works in [1-4,13-15] are noteworthy.
In [1], authors used superframe segmentation for the purpose of video summary. This was proposed by Michael Gygli, Helmut Grabner, Hayko Riemenschneider, and Luc Van Gool in 2014. Here, a summary of the original video is the output which contains the interesting parts of the video. Here, landmark detection, face detection and other techniques were used to find the interestingness score in the frames. K-means clustering method was used for finding the similar frames. As this approach deals with a large number of frames in the superframe segmentation, this approach is computationally expensive.
In [3], authors summarize the input video to make a poster output. This was proposed by Banalata Das and Taznin Jahan in 2013. Color moment was used in this paper to retrieve the features from the images. The output contains only 5 frames irrespective of the video length. It is not possible to understand the full sematic value of the original video only from the summary. So, this technique is not very promising in this area.
In [13,14] the authors have used unsupervised clustering method to detect the similar frames from a video. They have used some statistical model to find the keyframe which was relatively expensive in terms of computation.
In [15], the authors used automatic edge matching rate for finding the similar frames of different shots. This method was proposed by Dhagdi, Mr Sandip T., and P. R. Deshmukh in 2012. Though this method produces lesser number of keyfames, it looses the continuous semantic value of the video.
-
III. System Architecture
The proposed system is based on the low-level features of an image like color feature of the video frames. For feature extraction, we used color moment for the color feature extraction and SURF to find the interesting key points. Then, after the extraction of the feature, boundary of a definite shot needs to be detected. So, the matching of the frames is necessary between the consecutive frames. Euclidean distance was used to find the distance between the frames. A threshold was used for comparing the similarity between the features. After finding all shot boundaries by using the threshold, frames from each shot were found. But a lot of redundancy still exists in these frames. So, then color histogram technique was used to find the similarly between the consecutive images to eliminate the redundancy. Then, with the remaining frames, a summary slide was made in GIF format. Then the result is calculated with the relevance feedback provided by different users on the basis of a questionnaire.
The system architecture of our method can be viewed as in Fig. 2.
-
A. Frame Separation
For separating the frames from a video, MATLAB toolkit is used. The MATLAB function VideoReader(video) is used. The input video was in AVI or MP4 or 3GP format. This method calculates total number of frames of a video and separates the frames in order. During the separation and storing the separated frames, it is ensured that all images are reshaped in same size irrespective of video resolution. The frames are saved as 640x400 size. All the frames are saved in JPG format.
-
B. Color Feature Extraction using Color Moment
For extracting features from a frame, first the color feature is measured using color moment. It has been proved that for extracting color feature from an image, color moment gives the best result [3,7]. Three color moments; first order moment Mean; second order moment Variance and third order moment Skewness were calculated.
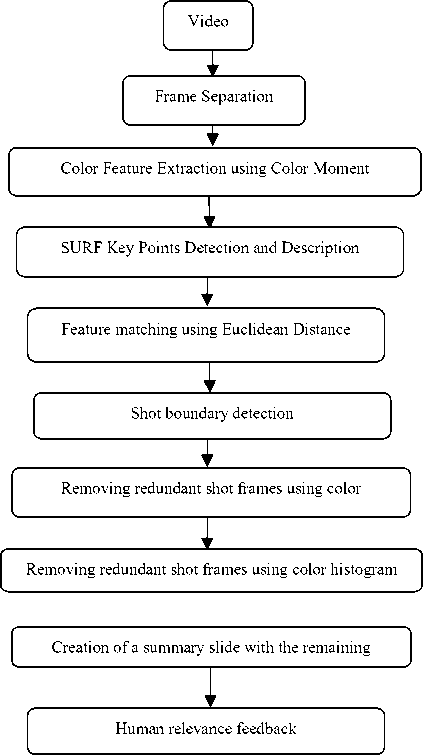
Fig.2. System architecture
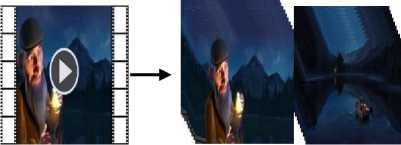
Fig.3. Frame Separation (Video:Starlight.mp4)
Equation 2 represents the equation to find the variance of the image. Variance, which is second order moment, represents the variation of the pixel values from the average value. Equation 3 represents the first order moment i.e. mean of a frame. Similarly, equation 4 represents the skewness of an image to measure the asymmetry of an image. At first, the three RGB color channels are separated and all the three moments for each color channel are found. This process generates 9 color features for each image.
-
C. SURF Key Points Detection and Description
As the 10th feature of the frames, Speeded Up Robust Features (SURF) is used. The interesting key points were detected and extracted as the 10th feature for our system in the database. Fig. 4 illustrates after detecting the key points from an image using SURF.
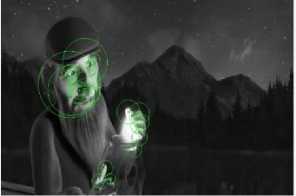
Fig.4. SURF Key Points Detection
-
D. Distance Measure using Euclidean Distance
After finding the color feature using color moment and SURF key points, the similarities between the consecutive frames are calculated. Euclidean distance is used to measure the dissimilarity between the frames. Euclidean distance is the most used metric to find the dissimilarity between the components. So, this distance is used and satisfactory result is found. Here is the formula for Euclidean distance:
D t = V^t - У е )2 (6)
Here x and y are two consecutive images for calculating the distance for feature i.
-
E. Shot Boundary Detection
We know shots are the video segments which are taken in single camera operation. As our objective is to generate the summary of the video by taking the frames from each shot, the shot boundary in the frames has to be found. To detect the shot boundary, two thresholds T1 and T2 are used. T1 is measured as the arithmetic mean of the distance vector which is calculated earlier as a vector of distances between two consecutive frames using the color moments. Similarly, T2 is measured as arithmetic mean of the SURF distance vector which is also calculated as the distances between two consecutive frames using SURF feature.
Now shot boundary is detected between any two consecutive frames if the distances are greater than the thresholds respectively. When the shot boundary is detected, the respective frames are stored for further operation.
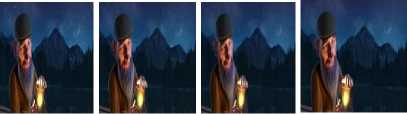
Frame1128 Frame1129 Frame1130 Frame1131
Frame1132 Frame1133 Frame1134 Frame1135
Fig.5. Shot Boundary Detection
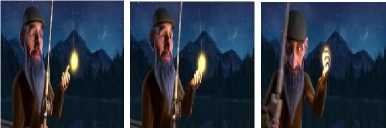
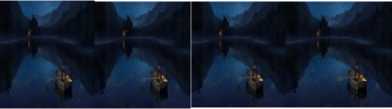
Fig.6. Redundant Frames
Here, an example of shot boundary detection is explained. In Fig. 5 it is shown from Frame1128 to Frame1135 of the video ‘Starlight.mp4’. Here we can see Frame1128, Frame1129, Frame1130 and Frame1131 are almost similar in nature. But Frame1132 is very much dissimilar than the Frame1131. Here, we can say a shot break is detected and we take Frame1132 as a shot boundary. During the calculation, the distance between frames Frame1128 and Frame1129 is found less than the thresholds and distance between frames Frame1131 and Frame1132 is found to be larger than the threshold. So, the boundary between the two dissimilar frames are detected.
-
F. Removing redundant shot frames using color histogram
When the shot boundaries are detected and the extracted frames are stored, many redundant frames still exist. So, redundant frames from the same shot need to be discarded. To overcome this problem, color histogram technique is used. At first, the three color channels are separated from the set of the extracted frames. Then the distribution of colors in the frames are measured using histogram. The number of each color present in any frame is measured and the distance between two consecutive frames with respect to that particular color is measured. Here, also a threshold is used as the arithmetic mean of the distance vector. If the distance between two frames is greater than the threshold, then the two frames are considered as same frame. Using the previous technique, the extracted frames are then stored, which set of frames are used to make the summary slide.
For example, it is found that total 210 frames, from frame number 922 to frame number 1131, comprise similar type of shot. After using color moment and SURF, the shot boundaries of this shot in 104 frames is found. So, the redundancy is very high. So, when the color histogram technique is applied in the extracted set of frames, the number of frames for this shot is only 1 frame - Frame1034. Thus, the redundancy of frames in the similar consecutive shot is removed using color histogram technique.
-
G. Creation of a summary slide with the remaining frames
After removing the redundancy of the similar shot frames, a summary slide is made with the remaining set of extracted frames. The slide is made in GIF format containing all the extracted frames. The transition between the frames is kept as 0.8 seconds. As the summary is made with the frames sequentially as the original order, the summary is quite understandable.

(a)
Fig.7. (a) The set of keyframes and (b) is the output summary slide

(b)
-
IV. Experiment
We used 4 videos for our experiment. We first ran our experiment on the certain videos and made the summary slide. We ran our program in an Intel Core i5 2.40 GHz processor, 6.00 GB memory machine. Then we used summary slide and original video for the survey. The videos we have used are given here-
Piano.mp4: An animated video of an old man playing piano while remembering his past.1
Starlight.mp4: An animated video of an old fisherman catching a star for his sick wife.2
Last Shot.mp4 : An animated video of a little girl and her broken camera.3
Geoff.mp4: An animated video of a food scientist and his family life.4
The shot frames obtained from the experiment on videos “Piano.mp4” and “Starlight.mp4” are shown in Fig. 8 and Fig. 9 respectively.
Table 1. Table for the data of the videos used in the experiment
|
Name of video |
Resolution |
Duration(min) |
Number of Total Frames |
Number of Frames in Summary |
|
Piano |
624x360 |
02.22 |
3569 |
38 |
|
Starlight |
864x368 |
02.14 |
3222 |
33 |
|
Last Shot |
640x360 |
02.36 |
3740 |
60 |
|
Geoff |
1280x720 |
03.15 |
4875 |
67 |
A. User Survey for Relevance Feedback
We conducted a human user relevance feedback survey for the result analysis. We then calculated the result on the basis of the responses in the questionnaire provided by our subjects. Our questionnaire contains five questions and each question has three answer options such as disagree, neutral and agree.
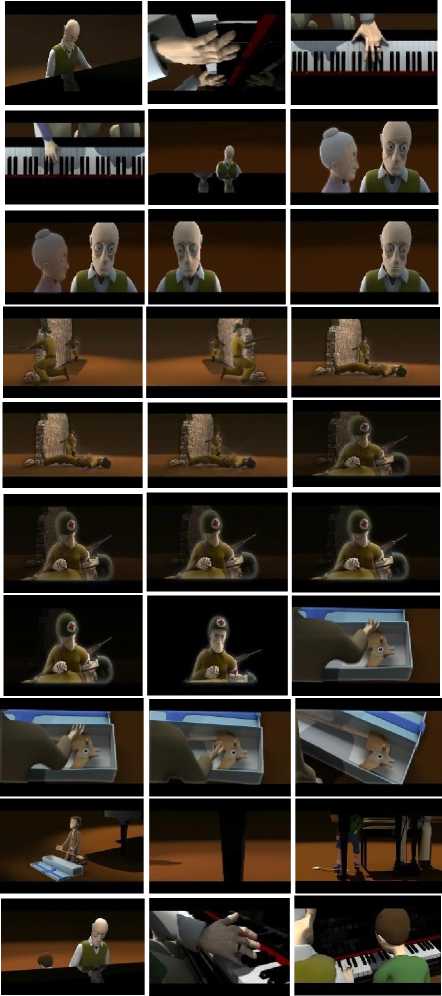
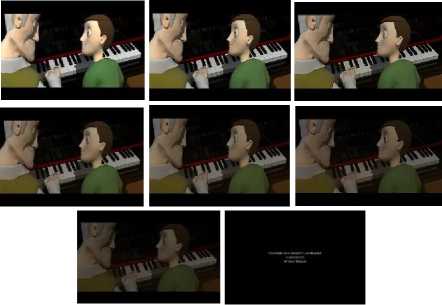
Fig.8. Frames of summary slide of video Piano.mp4

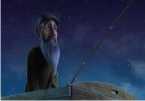
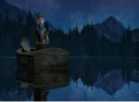
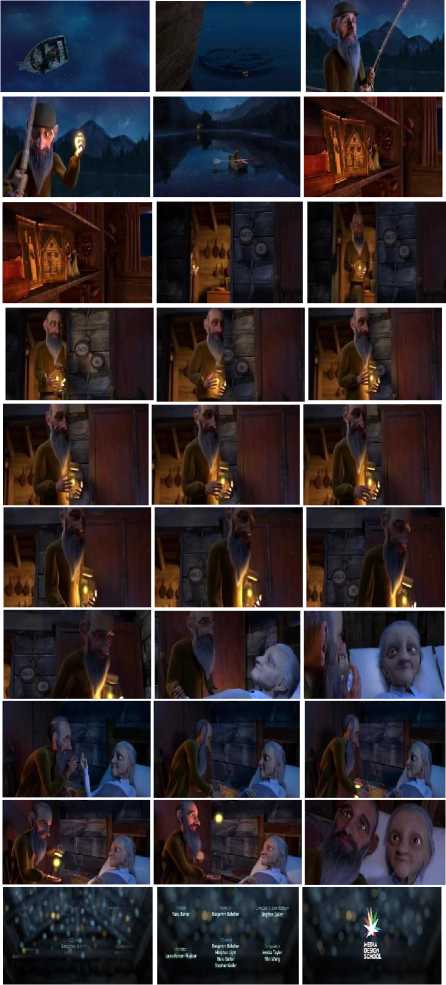
Fig.9. Frames of summary slide of video Starlight.mp4
Our questionnaire consists of the following questions:
Q 1: The summary slide is able to represent the original full video.
Q 2: The content of the summary is understandable.
Q 3: The summary has completely missed an important scene or sequence.
Q 4: The summary is too lengthy
Q 5: The content of the summary slide is satisfactory in context of the original video
We conducted our questionnaire-based survey on total 29 persons. Among them 3 are teachers, 1 is software engineer, 1 is graphic designer and rest are students of different semester and different departments. There were 11 bachelor students from computer science background, 3 bachelor students from sociology background, 2 were secondary students, 2 were from statistics department and 1 from each other department like architecture, mathematics, communication engineering and life science departments as forestry, fisheries and marine resources and pharmacy. Among them 1 student answered on 3 videos, 1 answered on 2 videos and rest answered on 1 video. That makes our survey of total 32 feedback reports.
We got 10 feedbacks on the video ‘piano.mp4’, 10 feedbacks on the video ‘starlight.mp4’, 8 feedbacks on the video ‘Last shot.mp4’ and 4 feedbacks on the video ‘Geoff.mp4’.
We first showed our subjects the summary slide and then the original video. We then asked them to answer the questionnaire form as per their perception on the summary. They then answered the form as per their perception.
We then calculated the result of the survey on the basis of three criteria- positive, negative and neutral. We considered the question number 1,2,5 as positive questions and question number 3 and 4 as negative questions. That means, if someone marks ‘agree’ in questions 1,2 and 5 that is positive result and if marks ‘disagree’ then it is considered negative result. Similarly, response is opposite for question 3 and 4. For each question, ‘neutral’ is considered as neutral result.
Table 2. Table for result analysis of the videos used in the experiment
|
Name of video |
Number of Subjects Participated |
Positive Review Percentage |
Negative Review Percentage |
Neutral Review Percentage |
|
Piano |
10 |
82 |
02 |
16 |
|
Starlight |
10 |
80 |
04 |
16 |
|
Last Shot |
08 |
75 |
03 |
22 |
|
Geoff |
04 |
75 |
05 |
20 |
-
V. Result Analysis
-
A. For video Piano.mp4
We obtained total 10 survey results for this video. Among the 10 subjects, 1 is software engineer and rest are students. Among the total 50 points (5 per form), we got 41 positive reviews, 8 neutral reviews and 1 negative review.
-
B. For video Starlight.mp4
We obtained total 10 survey results for this video. Among the 10 subjects, 2 are teacher, 1 is graphic designer and rest are students. Among the total 50 points (5 per form), we got 40 positive reviews, 8 neutral reviews and 2 negative reviews.
-
C. For video Last Shot.mp4
We obtained total 8 survey results for this video. Among the 8 subjects, 1 is teacher and rest are students. Among the total 40 points (5 per form), we got 30 positive reviews, 9 neutral reviews and 1 negative review.
-
D. For video Geoff.mp4
We obtained total 4 survey results for this video. Among the 4 subjects all are students. Among the total 20 points (5 per form), we got 15 positive reviews, 4 neutral reviews and 1 negative reviews.
The pie charts from the feedbacks obtained from the survey are shown in Fig. 10.
-
So, from the pie charts in Fig.10 , we can summarize our result analysis as 78% positive result, 18.5% as neutral result and only 3.5% negative result. Though we have some negative result and neutral opinions, the ratio of positive result is very high in comparison with the negative result. So, it is evident that our proposed technique performs better than the existing ones.
-
VI. Conclusion
At present the area of video summarization is very much emerging and evolving. Working in this area was quite challenging for us. Here, we have proposed a frame selection process from shots of a video with color feature and Speeded Up Robust Features (SURF) extraction methods. We have used three color moments such as first order moment mean, second order moment variance and third order moment skewness for each RGB channel that is total nine color features and SURF (Speeded Up Robust Features) key points as 10th feature and Euclidean distance for feature matching. We also used the Color Histogram technique for removing the redundancy among the similar frames of the same shot. Our experimental result is based on human relevance feedback which was on a questionnaire containing 5 3-options viz. disagree, agree and neutral questions. It is observed from the feedback that positive result obtained is about 78% which is quite satisfactory. Our result only shows 3.5% negative result on the basis of feedbacks provided by the users from different categories. This amount of negative result in negligible in contrast to the positive result which is 78% on average. So, our proposed method shows promising result.
In future, we wish to work on mid-level feature like shape feature and high-level feature like motion feature to improve the positive results.
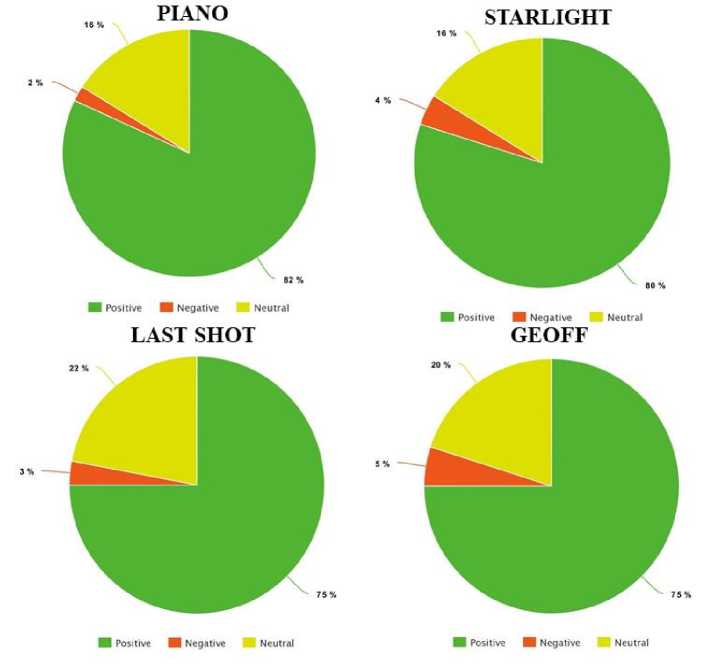
Fig.10. Pie charts of the results obtained in questionnaire-based survey for our four working videos- Piano.mp4, Starlight.mp4, Last Shot.mp4, Geoff.mp4
Acknowledgment
We like to show our gratitude to the people who spent their valuable time to provide us the feedbacks for the relevance survey.
References Creation of video summary with the extracted salient frames using color moment, color histogram and speeded up robust features
- Gygli, Michael, Helmut Grabner, Hayko Riemenschneider, and Luc Van Gool. "Creating summaries from user videos."In European conference on computer vision, pp. 505-520. Springer International Publishing, 2014.
- Lee, Yong Jae, Joydeep Ghosh, and Kristen Grauman. "Discovering important people and objects for egocentric video summarization." Computer Vision and Pattern Recognition (CVPR), 2012 IEEE Conference on. IEEE, 2012
- Banalata Das and Taznin Jahan. “DWT and Color Moment Based Video Content Extraction for Poster Generation with Relevance Feedback” (Bachelor Thesis, 2013, Khulna University, Khulna, Bangladesh) - Unpublished
- Lu, Zheng, and Kristen Grauman. "Story-driven summarization for egocentric video." Proceedings of the IEEE Conference on Computer Vision and Pattern Recognition. 2013.
- Oh, Jung, et al. "Video abstraction." Video data management and information retrieval (2004): 321-346.
- S. Mangijao Singh and K. Hemachandran. “Content Based Image Retrieval using Color Moment and Gabor Texture Feature”. In Proceedings of International Journal of Computer Science Issues (IJCSI), 2012.
- S.M. Mohidul Islam. “Implementation and Comparison among Feature Extraction and Similarity Measurement Methods for Image Retrieval Using Visual Contents” (Masters’ Thesis, 2016, Khulna University, Khulna, Bangladesh) - Unpublished
- Rafael C. Gonzalez, Richard E. Woods, “Digital Image Processing”, 3rd Edition. Pearson Education, 2009.
- Lowe, David G. "Object recognition from local scale invariant features." Computer vision, 1999. The proceedings of the seventh IEEE international conference on. Vol. 2. Ieee, 1999.
- Wikipedia, “Scale invariant feature transform”, https://en.wikipedia.org/wiki/Scale_invariant_feature_transform. Accessed on 30 July, 2017
- Bay, erbert, Tinne Tuytelaars, and Luc Van Gool. "Surf: Speeded robust features." Computer vision–ECCV 2006 (2006): 404-417.
- Wikipedia, “Speeded up robust features”, https://en.wikipedia.org/wiki/Speeded_up_robust_features, Accessed on 15 December 2017
- Zhuang, Y., Rui, Y., Huang, T. S., & Mehrotra, S. (1998, October). Adaptive key frame extraction using unsupervised clustering. In Image Processing, 1998. ICIP 98. Proceedings. 1998 International Conference on (Vol.1, pp. 866-870). IEEE.
- Yang, Shuping, and Xinggang Lin. "Key frame extraction using unsupervised clustering based on a statistical model." Tsinghua Science & Technology 10.2 (2005): 169-173.
- Dhagdi, Mr Sandip T., and P. R. Deshmukh. "Keyframe based video summarization using automatic threshold & edge matching rate." International Journal of Scientific and Research Publications 2.7 (2012): 1-12.
