Criteria of identification of individual heart cycle phases on ECG

Author: Rudenko Mikhail, Voronova Olga, Zernov Vladimir, Mamberger Konstantine, Makedonsky Dmitry, Rudenko Sergey
Journal: Cardiometry @cardiometry
Section: R&D engineering in cardiometry
Article in issue: 1, 2012.
Free access
Aims Criteria of identification of individual heart cycle phases according to an ECG curve are described in this paper. Materials and For this study, a single-lead system ECG is used only. Its distinctive methods feature is that an ECG signal is recorded within the body surface area of the ascending aorta. Using the theory of biological system process continuity, the individual heart cycle phase boundaries are determined at those points of the cardiac signals where we deal with an energy process transition in the cardiovascular system from the process of the energy build-up to its attenuation, and vice versa. The transition points are identified by us by mathematical differentiation of the ECG signals, and, as a result, they correspond to extrema of the ECG derivative. Some individual heart cycle phases are found according to maxima on the derivative, others are identified according to minima on the derivative curve, respectively. Results The method of application of the ECG derivatives allows to capture individual heart cycle phases in a very precise manner. Utilization of the ECG derivatives is a prerequisite for computer-assisted processing of the data to deliver measurements of durations of every heart cycle phase. Conclusion Using the ECG derivatives for fixing every heart cycle phase makes possible to fill up the gaps in the theory of phase analysis and avoid misinterpretations of any type of the ECG phase structures.
Сardiometry, cardiology, ecg, ecg derivative, heart cycle phases
Short address: https://sciup.org/148308719
IDR: 148308719
Text of the scientific article Criteria of identification of individual heart cycle phases on ECG
Aims Criteria of identification of individual heart cycle phases according to an ECG curve are described in this paper. Materials and methods For this study, a single-lead system ECG is used only. Its distinctive feature is that an ECG signal is recorded within the body surface area of the ascending aorta. Using the theory of biological system process continuity, the individual heart cycle phase boundaries are determined at those points of the cardiac signals where we deal with an energy process transition in the cardiovascular system from the process of the energy build-up to its attenuation, and vice versa. The transition points are identified by us by mathematical differentiation of the ECG signals, and, as a result, they correspond to extrema of the ECG derivative. Some individual heart cycle phases are found according to maxima on the derivative, others are identified according to minima on the derivative curve, respectively. Results The method of application of the ECG derivatives allows to capture individual heart cycle phases in a very precise manner. Utilization of the ECG derivatives is a prerequisite for computer-assisted processing of the data to deliver measurements of durations of every heart cycle phase. Conclusion Using the ECG derivatives for fixing every heart cycle phase makes possible to fill up the gaps in the theory of phase analysis and avoid misinterpretations of any type of the ECG phase structures. Keywords Сardiometry ≈ Cardiology ≈ ECG ≈ ECG derivative ≈ Heart cycle phases Imprint Mikhail Y. Rudenko, Olga K. Voronova, Vladimir A. Zernov, Dmitry F. Makedonsky, Konstantine K. Mamberger, Sergey M. Rudenko. Criteria of identification of individual heart cycle phases on ECG; Cardiometry; No.1; November 2012; p.133-142; doi:10.12710/cardiometry.2012.1.132141 Available from:
Studying of phases in the heart cycle structure was a challenge for many scientists for a long time. However, until nowadays, there is no consensus on how to identify the individual heart cycle phases. It results in a number of contradictions in understanding of biophysical processes determining the hemodynamics and the performance of the cardiovascular system. A lot of scientists carried out their studies with application of cardiographic multi-lead systems. But they were not capable of meeting the objective of the proper phase identification. Moving step by step in the multi-lead system direction, the cardiologists used to believe that it is possible to determine the phases using an ECG only. The authors of this article make their own contribution to the development of the theory of the heart cycle phase analysis [1]. By applying a new mathematical model of hemodynamics developed by them and utilizing the G. Poyedintsev – O. Voronova equations, the authors succeeded in establishing of clear identification criteria for fixing the phase boundaries on an ECG curve.This innovative concept was translated into a new device capable of measuring durations of every heart cycle phase and calculating blood volumes in each phase of a heart cycle. Despite the fact that the authors pioneered in automatic PC-assisted processing of the measured data, it should be mentioned that it is much more important to provide an understanding of the essence of this advanced phase analysis. This article is dedicated to “the ABC” of the innovative concept of the heart cycle phase identification.
Materials and methods
Graphic differentiation is widely used in mathematics. With differentiation we can treat different implicit functions which are difficult to describe by mathematical equations. The essence of the graphic differentiation is the determination of some specific points of a function, i.e., inflection points and local extrema of a curve. As a rule, the double differentiation is applied. Having obtained two derivatives of a function, it becomes possible with a high probability to detect laws or regularities in processes which generate a curve of the function. This is one of the essential tools applied to experimental researches.
The principle of the graphic differentiation of an elementary sinusoidal harmonic signal is shown in Fig.1 herein.
The curve of the function sin X and its derivative cos X are given in the figure below. The curve of the function cos X is the first-order derivative of the function sin X.
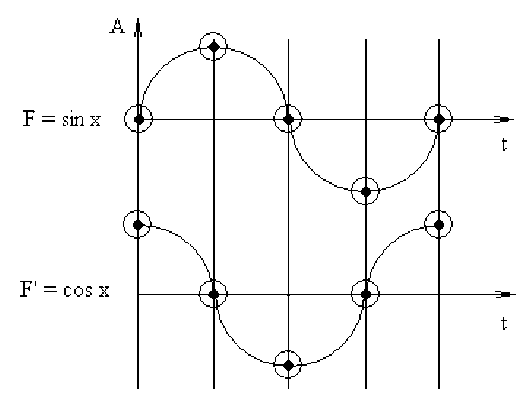
Figure 1 . Graphic differentiation of function sin X.
From the relation between the function and its derivative, it follows that first-order derivative extrema coincide with the respective curve inflection points. In this case, when the function changes from negative values to positive ones, or when its sign changes from minus to plus, an extremum of the first-order derivative is in our case positive. And vice versa, an extremum is negative in case the sign of the function changes from positive to negative one.
When using the graphic differentiation for treatment of a complex signal, it is important to study the formation of the first-order derivative extrema. Taking into account the fact that, from the physical point of view, the derivative characterizes the rate of a function variation, the first-order derivative extrema show the limits of changes in energy processes which form the function, i.e., in our case, the first-order derivative maximum should reflect the signal energy changes from the energy rise to its fall, the minimum of the same derivative should feature the energy changes from the energy fall to an attenuation. These boundary conditions are essential for dynamic processes. Since the blood circulation is also a dynamic process, any biological signal of electrical or mechanical nature, which characterizes the cardiac rhythm, can be properly analyzed using the derivative tools.
Results
Identification of point P
The point P on the ECG curve coincides with a local minimum of the derivative. In mathematics it is called an extremum of the derivative. It is clearly shown in Fig.2 given below herein. On the ECG curve, the point of the said derivative extremum is an inflection point as indicated in the figure below.
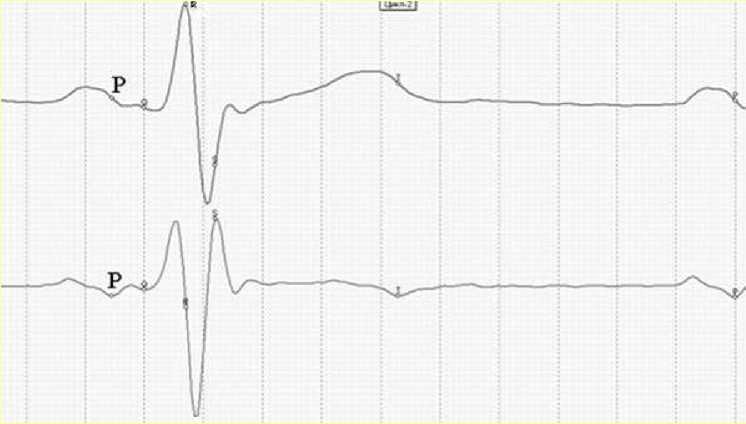
Figure 2. On the ECG curve, point P is an inflection point of the descending amplitude of wave P that coincides with a local minimum on the ECG first-order derivative.
It is impossible to find an inflection point on any ECG curve without derivatives. This is applicable to any segment of any ECG configuration. The atrioventricular valves start their closing at the moment corresponding to point P on the ECG. At this time, the volume of blood entering the ventricles decreases. At the time corresponding to the Q point, the valves are fully closed. The ventricles are filled with the required blood volume so that the pressure building-up for ejection of the required quantity of blood into aorta can be started.
The P wave represents the processes of intensive blood ejection by the atria. Each of the processes comprises two stages. The rapid ejection procedure begins at the time corresponding to a local maximum of the derivative that is an inflection point on leading edge of the P wave on the ECG curve. Further, the derivative curve shows a descending segment up to point P. After the P point, the filling procedure is completed with closing of the valves at the time corresponding to point Q.
The atrium is a large blood vessel. The atrium expansion undertakes the function of an efficient pump that is responsible for a difference in pressures between the periphery and the atrium. The efficiency of this performance is high enough so that the blood circulation is provided in all possible body positions, even in cases of full loss of blood vessel elasticity.
It should be noted that the P point can be easily determined both under normal and in pathological blood circulation conditions.
Identification of point Q
The Q point similar to point P should be found as another local minimum of the same derivative. It is illustrated in Fig.3 where the Q point is located before the QRS complex.
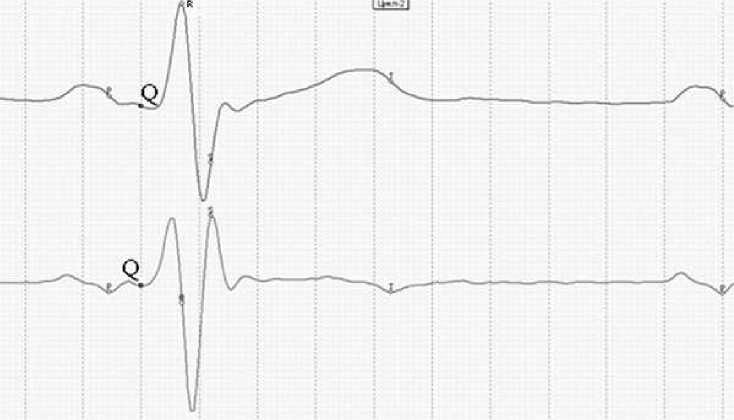
Figure 3. Point Q indicates the start of the septum contraction activation. It corresponds to the local minimum on the ECG first-order derivative as indicated herein.
As opposed to the P point, point Q is not always distinctly shown on the derivative curve. If the respective extremum cannot be clearly identified, i.e., if the Q point cannot be easily found, then it should be fixed at the point of time of a sharp elevation of the derivative curve in this phase.
Identification of point S
The precise identification of point S is of great importance for calculations of hemodynamic parameters. It should be mentioned that our technology makes it possible to properly find this point in 99.9% of the ECG records. It suggests that this innovative method shows both its high reliability and high confidence level. The S point coincides with the maximum of derivative as shown in Fig.4 below.
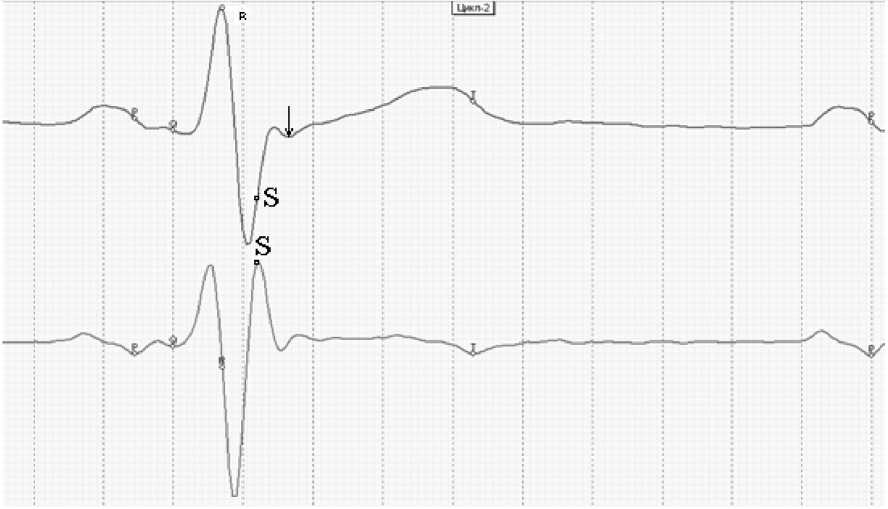
Figure 4. Point S is identified by the maximum of the derivative at the segment as shown above.
At the time corresponding to the S point, the aortic valve begins its opening procedure. But at this moment the aorta is in its ready-for-operation mode expecting the blood supply. Under the normal conditions, the blood supply to the aorta starts at the time that is arrow-marked on the ECG in the above figure.
Identification of interval S - j. Analysis of wave Z within this interval
The S – j interval is of significance for diagnostics. Within this period of time we observe the full aortic valve opening procedure. This interval is not used by us for calculations of the hemodynamic parameters, but it is involved in qualitative assessment of the performance of the aortic valve. The interval is recorded on the ECG curve as a two-wave configuration segment. One of them is of great amplitude with its top at the Z point. The amplitude of the other wave is much lesser. Under the normal conditions, point Z should be located approximately at the level of the isoelectric baseline conventionally drawn from point P. At exercise loading or in case of pathology, the Z point can be considerably shifted up- or downwards referred to the isoelectric baseline. As it was mentioned above, the S – j interval consists of two waves. Under the normal conditions, blood starts entering the aorta only at the time corresponding to the L point, i.e., at the onset of the second wave formation (s. Fig.5 herein).
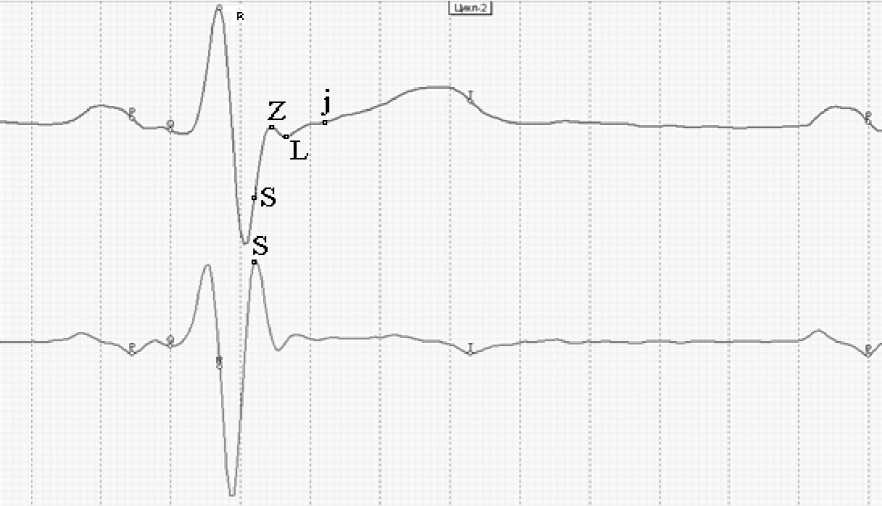
Figure 5. Interval S – j: myocardium load in S – L phase; full opening of the aortic valve in L – j phase. The Z wave amplitude is an indication of the valve opening tension.
Identification of point T
Treating the ECG segment beginning with the j point, we suggest that it represents the performance of the aorta as a pump. The T wave is involved in the assessment of the aorta performance only and cannot be used as a marker of the performance of the myocardium. The leading edge of the T wave is very significant. It is generated at the point j and has a straight segment. It ends at the point Tн. If the aorta elasticity is normal, the straight segment is very short. If the aorta elasticity is reduced, the straight segment is found to be longer. It should be stated that the other parameters might remain the same in this case. This period is the mirror of the slow ejection of blood from the ventricles. The degree of the temporary extension of this period depends on how fast the volume of blood ejected from the ventricle is distributed within the aorta. If the aorta elasticity is within the norm, this large blood vessel expands and receives the ejected volume of blood immediately. If the elasticity is under the norm, then some time is required for the blood volume distribution along the aorta length. The T wave is generated upon the complete distribution of blood within the aorta only. This point is designated as Tн.
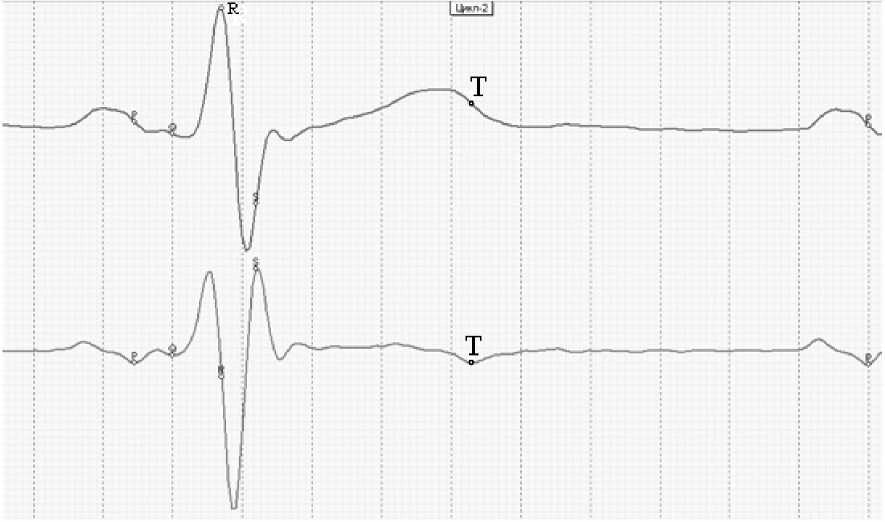
Figure 6. The T wave is involved in the assessment of the performance of the aorta but not the myocardium. The duration of interval j – T н depends on the actual elasticity of the aorta.
Identification of point R
The QRS complex reflects the performance of the heart in a two-stage mode. The first stage represents the septum contraction in phase QR. The second stage covers the ventricular wall contraction in phase RS. The septum remains contracted throughout the QRS interval.
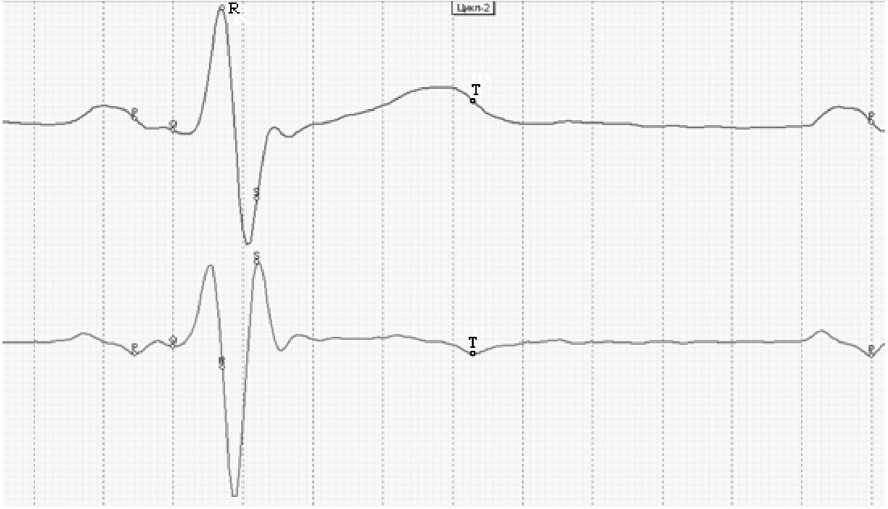
Figure 7. The R point is identified on the ECG as the top of the QRS complex in a similar way as described in other reference literature. This is the only point which is found by criteria other than those used for the phase identification procedure according to the derivative extrema.
The myocardium loading condition is maintained till the T wave decays, when the aortic valve starts its closing procedure. Only then the myocardium does revert to its initial state.
Discussion and conclusions
This paper deals with ideal ECG curves and their derivatives only. But in practice we have to treat a great variety of ECG types. Some of them are even difficult to classify as ECG curves. Various extrasystole types can distort ECG forms. All this hinders computer-assisted processing of phase identifying data. In this case, it should be noted that it remains the responsibility of an expert to identify every individual phase in every heart cycle pattern. But at the same time, it is just the expertise of the phase identification procedure that can open the door to the cardiometry.
Using the ECG derivatives for fixing every heart cycle phase makes possible to fill up the gaps in the theory of phase analysis and avoid misinterpretations of any type of the ECG phase structures.
Statement on ethical issues
Research involving people and/or animals is in full compliance with current national and international ethical standards.
Conflict of interest
None declared.
Author contributions
All authors contributed equally to this work. V.A.Z. read and met the ICMJE criteria for authorship. All authors read and approved the final manuscript.
References Criteria of identification of individual heart cycle phases on ECG
- М. Rudenko M., Voronova O. & Zernov V. Theoretical Principles of Heart Cycle Phase Analysis. Fouqué Literaturverlag. ISBN 978-3-937909-57-8, Frankfurt a/M. München -London -New York; 2009.
