“Cultural Compass” of International Sociological Ratings on the “Organizational Culture” of the Arctic States

Author: Kudryashova E.V., Makulin A.V., Openkov M.Yu., Sun Y., Yan K.
Journal: Arctic and North @arctic-and-north
Section: Northern and arctic societies
Article in issue: 58, 2025.
Free access
The article is devoted to a comparative analysis of open data from international sociological Internet resources (Trompenaars Hampden-Turner Connecting Viewpoints, Hofstede Insights Ltd) in relation to the Arctic countries. As it is known, the models of F. Trompenaars, G. Hofstede are focused on the study of differences in business cultures and the analysis of cross-cultural communication, i.e. the study of the national characteristics of the organizational culture of the countries, their “cultural compass”. The relevance of the proposed topic is dictated by a number of factors: firstly, the Arctic region is an area of geopolitical competition between Russia and predominantly Western countries; secondly, the most important element in the struggle for geopolitical supremacy is “organizational culture” as the most important element of “soft power”; thirdly, it is important to understand how Western sociological models see the relationship (similarities and differences) of cultural factors on the example of key stakeholders in the Arctic region; fourthly, it is important to determine the place that Russia occupies in these ratings; fifthly, Western attempts to constrain Russia in the region determine the need to include in the sample not only data on the members of the Arctic Council (represented, with the exception of Russia, only by NATO countries), but also on Russia’s allies within the BRICS, in particular data on the organizational culture of China, which has long-term interests in the Arctic region. Within this logic, a number of questions arise: what is the “vision” created by Western Internet resources about the organizational culture of different countries, how the data obtained correlate with each other in the light of the current geopolitical situation. Comparing the results of different models and the statistical results obtained on their basis can lead to non-trivial conclusions, in particular about the scientific component of such ratings and their impact on the business image of countries in the world as a whole, and the Arctic region in particular.
Cultural compass, national culture, stakeholder, model, Arctic, correlation of cultures, Arctic Council
Short address: https://sciup.org/148330881
IDR: 148330881 | UDC: 303.723(985)(045) | DOI: 10.37482/issn2221-2698.2025.58.159
Text of the scientific article “Cultural Compass” of International Sociological Ratings on the “Organizational Culture” of the Arctic States
DOI:
H, ORCID:
, ORCID:
, ORCID:
, ORCID:
Panoptic, or encyclopedic, analysis (and it is the breadth of the scientific view that comes to mind when we talk about the vast expanse of the Arctic and the number of geopolitical parties interested in its development) necessarily implies that new knowledge is found precisely at the crossroads of interdisciplinary methodologies and the intersections of the boundaries of different fields of knowledge and models. A systemic vision always makes sure that big data is not hidden from it by the dry statistics that constantly floats over the “ocean of Arctic information”. A comparative-analytical approach should certainly penetrate to a depth of facts and extract relevant knowledge from the darkness for all stakeholders interested in studying and developing the Arctic. It is no secret that not only those countries that border the Arctic, but also those that do not have a direct geographical connection to it, are now interested in exploring the Arctic. Therefore, at the present stage, this interest should be viewed through the prism of significant transformations, the most important of which is the so-called transition from “the Empty World to the Full World”. The metaphor of the “Empty World”, outlined in the Club of Rome report (2018), reflects the millen-nia-long history of humankind, when it steadily expanded the boundaries of the world through pioneering movements and outward frontier shifts, but due to the weakness of production systems was not able to make any significant impact on vast natural landscapes for a sufficiently long period of time.
The circles of cultural and economic expansion, emanating from different centers of human civilization, diverging and collectively synchronizing across the planet in a form that can be conventionally associated with spiral autowaves, permanently overlapped, reinforced, or absorbed each other, forming an invisible pattern of potential influence and quite visible contour of state and economic borders, determined both by the specific efforts of individual states and by purely geographical and climatic factors. The well-known “immensity of the world” absorbed the impacts of Man for a time. With the advent of the era of “Full World”, humanity not only mastered and occupied everything that could be mastered and occupied, but also reached boundaries that were previously considered undevelopable, in particular, the borders of the Arctic. A distinctive feature of the “Full World” was that the influence of the “economy” began to encroach on the ecosystem, and the growth of the economy was supposed to “bump” into the known limits of the Earth, following the law of conservation of matter and energy (the First Law of Thermodynamics), forcing humanity to seek ways of intensive development. Under such conditions, nature and the ecosystem began to be viewed not as a “workshop” or a bottomless “storeroom” of humanity, but as a stakeholder, i.e. a “living” subject of planetary synergetic and cybernetic relations, which has and “pursues” its “interests”. In this case, the relationship between nature and society is increasingly acquiring a noospheric character.
It is noteworthy that society itself is fundamentally changing. K. Popper’s famous metaphor of the “clocks and clouds”, i.e. an open and closed society, can no longer remain the only guideline and criterion, thanks to which the “open” is always opposed to the “closed”, and the “free” to the “unfree”. In the conditions of transition from an empty world to a full one, an open society also loses its ideological meaning, since almost everything is already open, in this case it becomes clear that the further development of an open society is a conditionally cyclical transition to its opposite.
Returning to the metaphor of the “ocean of Arctic information”, it should be noted that this ocean will be developed precisely in the light of the struggle of the conditional “cloud” and “clock”, i.e. mixed strategies of open and closed types of society. This synthesis will give rise to well-known and new cultural dilemmas both in relations between different countries and within them. Isolationism in Arctic development will compete with international co-operation, open data in the development of the Arctic will alternate with closed data of national security and strategic tasks. Common use of the Arctic will determine the so-called “tragedy of the commons” in international “Arctic affairs”, when individual users, having open access to the common good of all users and not having exclusive rights to it, will lead to the depletion of the common resource by their uncoordinated actions. The solution to this dilemma lies in the balance between the needs of users and the degree of resource depletion. Consequently, the Arctic becomes a center of attraction for many players, stakeholders. It is clear that modelling such a balance of strategies of Arctic players is complex. The general direction of uncoordinated actions continues to remain within the framework of the so-called “zero-sum game”, where a win for one side necessarily funds a complete loss for the other side.
The search for an Arctic “Nash equilibrium”, i.e. a set of strategies in a game for two or more players, in which no participant can increase their winnings by changing their strategy if the other participants do not change their strategies, seems to be the most important task of forming “multi-stakeholder governance”, the purpose of which is to ensure the best quality in decisionmaking.
The latter is impossible without the transition from the so-called smart mobs to smart stakeholders.
Interoperability of stakeholders, i.e. their functional compatibility in education, science, production, innovation and, of course, culture, should become a condition for realization of this transition. Soft skills and hard skills should be combined with the functional literacy of all participants in the process.
We should not forget about other problems, such as the “tragedy of anti-commons”, when the owners of exclusive rights to breakthrough Arctic technologies or some good maximize only their own profits. For example, patent payments to the author of an invention used in the production of goods can lead to unprofitability of the product if there are too many patents. Moreover,
NORTHERN AND ARCTIC SOCIETIES
Elena V. Kudryashova, Artem V. Makulin, Mikhail Yu. Openkov, Sun Yanan, Yan Ke … everyone suffers: authors of patents (underpayments), producers (forced to raise prices and sell less), consumers (buy at triple the price).
Another factor determining the modern development of the Arctic is the so-called disruptive technologies and innovations, which are the essence of “creative destruction” (alternative: German Schöpferische Zerstörung). The term was popularized by the economist Joseph Schumpeter in the 1940s. In other words, the challenges posed by the so-called Industry 4.0 create a problem that can be conventionally designated as Arctic 4.0. It is no longer steam and steel, electricity and nuclear energy, computers, i.e. everything that was the driving force of the past three industrial revolutions, that will determine the sustainable development of the world, but the emergence of intelligent machines, the Internet of Things, big data will set the vectors of economic, social and even cultural development of mankind.
It will be possible to gain the necessary advantages in the undoubtedly competitive Arctic environment only by working with big data, i.e. by extracting elements of not only breakthrough technical information, but also arrays of information about the soft power of geopolitical players, about the organizational culture of countries, their cultural code, their ability to resist “linguistic imperialism”, their ability to preserve cultural sovereignty in the era of artificial intelligence and big linguistic models.
In this regard, let us attention to a number of existing methodologies that, through broad longitudinal sociological studies, reveal a number of questions that, on the one hand, relate to the description of how countries act on the basis of the most general cultural and value orientations inherent specifically to these countries, and on the other hand, how these countries can interact, for example, in the context of developing the Arctic, how compatible their organizational cultures are, and how existing models and ratings, built on the basis of broad sociological surveys, reflect this organizational and cultural compatibility/incompatibility.
Methodology of research on the “cultural compass” of the subarctic countries
Among the variety of [1, Ashurbekov R.Kh.] sociological methods, one can highlight the World Values Survey (WVS) and the so-called Inglehart–Welzel cultural map of the World (R.F. In-glehart). It is also impossible to ignore the methods of G. Hofstede (Hofstede’s cultural dimensions theory), S. Schwartz (Theory of Basic Values) [2, Kuznetsov A.E.], F. Trompenaars (Trompenaars’s model of national culture differences, F. Trompenaars, C. Hampden-Turner) 1. It is noteworthy that there is already an array of accumulated data over several decades of research. The most famous method is the Hofstede model, which has been the subject of many works [3, Veriga V.L.; 4, Gorbunova O.A.; 5, Minkov M.; 6, Myasoedov S.P.]. Recently, works devoted to the application of models to specific countries, such as the PRC, have been published [7, Mikhelson S.V.; 8, Skalnaya O.A.; 9, He Ya.; 10, Kikot I.N.]
Thus, impressive data has been accumulated, which are expressed in laconic models, for some of which there are dynamic visualizations showing the transformation of a country’s position over a certain period of time (for example, the Inglehart–Welzel Cultural Map) (Fig. 1).
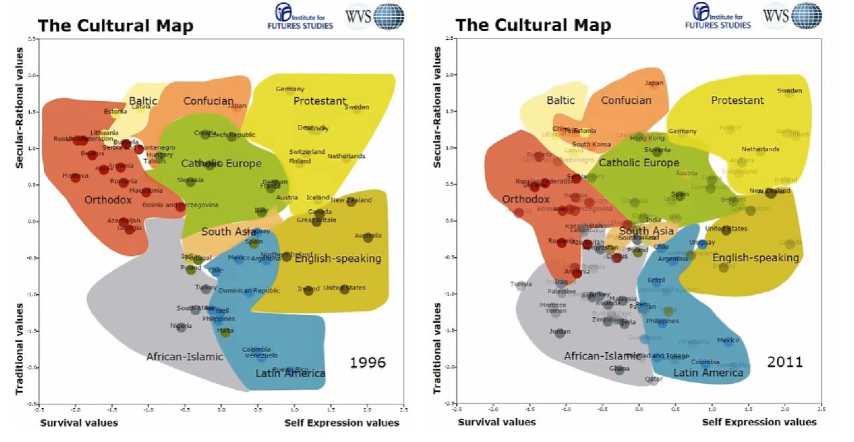
Fig. 1. Inglehart–Welzel “Cultural Map of the World” (1996–2011)
Y-axis: traditional values, secular-rational values; x-axis: survival values, self-expression values 2.
For 2023, the value correlations according to the Inglehart–Welzel Cultural Map are as follows
(Fig. 2):
The Inglehart-Welzel World Cultural Map 2023
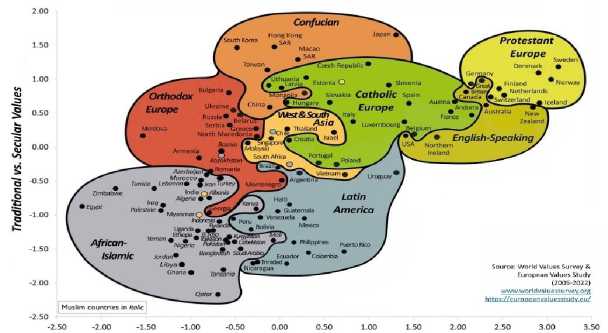
Survival vs. Self-Expression Values
Fig. 2. Inglehart–Welzel “Cultural Map of the World” (2023)
Y-axis: traditional values vs. secular-rational values; x-axis: survival values vs. self-expression values 3.
For other models, online resources have been created that allow entering country names into search engines and seeing their profile, i.e. their structured description using various premeasured indicators.
-
2 Inglehart–Welzel Cultural Map. URL: https://www.worldvaluessurvey.org/WVSContents.jsp?CMSID=findings (accessed 02 March 2024).
-
3 Inglehart–Welzel Cultural Map. URL: https://www.worldvaluessurvey.org/images/Map2023NEW.png (accessed 02 March 2024).
The resource allows comparing the indicators of any two countries.
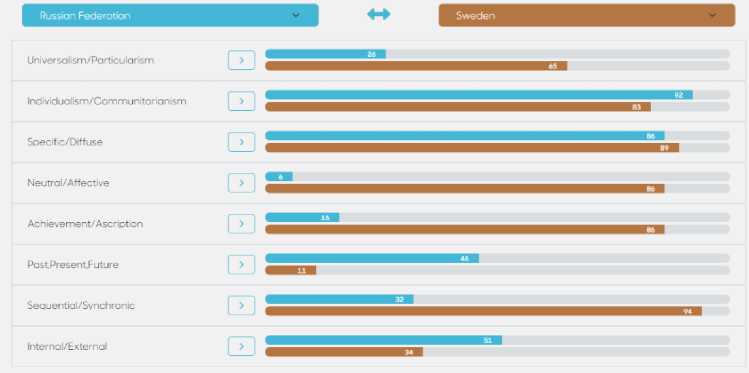
Fig. 3. Trompenaars’s model of national cultural differences (Russia / Sweden) 5.
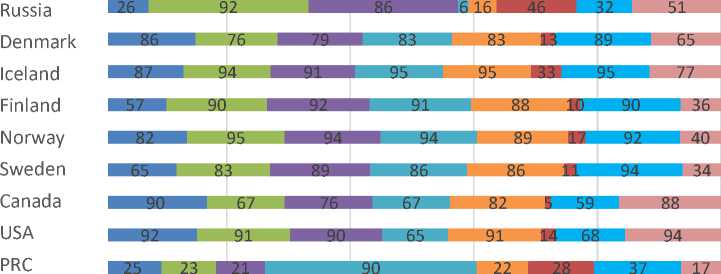
Using this resource, we obtained the result we were interested in, in particular, the indicators of the Arctic Council countries and China, which are presented in Table 1 and Fig. 4.
Table 1
Indicators of the Arctic Council countries and China (F. Trompenaars’s model)
|
.5 |
< |
го го с го о |
с ф ф 5 СУ) |
го" 5 о г |
го с |
го о |
го Е ф Q |
|||
|
1 |
Universalism/ Particularism |
26 |
92 |
90 |
65 |
82 |
57 |
87 |
86 |
25 |
|
2 |
Individualism/ Communitarianism |
92 |
91 |
67 |
83 |
95 |
90 |
94 |
76 |
23 |
|
3 |
Specific/ Diffuse |
86 |
90 |
76 |
89 |
94 |
92 |
91 |
79 |
21 |
|
4 |
Neutral/ Affective |
6 |
65 |
67 |
86 |
94 |
91 |
95 |
83 |
90 |
|
5 |
Achievement/ Ascription |
16 |
91 |
82 |
86 |
89 |
88 |
95 |
83 |
22 |
|
6 |
Past, Present, Future |
46 |
14 |
5 |
11 |
17 |
10 |
33 |
13 |
28 |
|
7 |
Sequential/ |
32 |
68 |
59 |
94 |
92 |
90 |
95 |
89 |
37 |
4 Trompenaars Hampden-Turner Connecting Viewpoints. URL: factory/culture-explore/compare-countries/ (accessed 02 March 2024).
5 Ibid.
|
Synchronic |
||||||||||
|
8 |
Internal/External |
51 |
94 |
88 |
34 |
40 |
36 |
77 |
65 |
17 |
-
■ 1. Universalism/Particularism
-
■ 2. Individualism/Communitarianism
-
■ 3. Specific/Diffuse
-
■ 4. Neutral/Affective
-
■ 5. Achievement/Ascription
-
■ 6. Past, Present, Future
■ 7. Sequential/Synchronic
■ 8. Internal/External
Fig. 4. Comparative indicators of the Arctic Council countries and China (Trompenaars’s model).
Besides, the electronic resource “Trompenaars Hampden-Turner Connecting Viewpoints” makes it possible to obtain a decoding of the obtained results. Let us consider what the extreme and average values express on a specific example (Russian Federation — Sweden). The obtained data are presented in Table 2.
Table 2
Decoding of indicators for the Russian Federation and Sweden (F. Trompenaars’s model)
|
1 |
Universalism/ Particularism |
26 — Russians are relationship-oriented. |
65 — Swedes tend to value rules in relationships. |
|
2 |
Individualism/ Communitarianism |
92 — Russians have a strong personality orientation. |
83 — Swedes tend to rate individuality highly on this dimension. |
|
3 |
Specific (special culture)/ Diffuse |
86 — Russians have a very low level of personal involvement in business. |
89 — Swedes tend to rate personal involvement in business very low on this dimension. |
|
4 |
Neutral/ Affective |
6 — Russians have a very high tendency to show emotions. |
86 — Swedes tend to hide emotions. |
|
5 |
Achievement/ Ascription |
16 — Russians tend to use their given status. |
86 — Swedes tend to value achievement (in what they do) very highly. |
|
6 |
Past, Present, Future |
46 — Russians’ orientation in this regard is balanced between extremes. |
11 — Swedes tend to be very future-oriented. |
|
7 |
Sequential/ Synchronic |
32 — Russians are more inclined to multitask than to perform a single task. |
94 — Swedes tend to be more task-oriented. |
|
8 |
Internal/External |
51 — Russians’ orientation is balanced between extremes. |
34 — Swedes tend to “go with the flow” rather than to take control. |
It is also necessary to consider the data for other countries.
Attention should be paid to China and the USA.
-
1. The Chinese, as a rule, highly value relationships in this aspect.
-
2. — / —, as a rule, highly value groups in this aspect.
-
3. — / —, as a rule, highly value personal participation in business.
-
4. — / —, as a rule, tend to hide their emotions.
-
5. — / —, as a rule, tend to use their status.
-
6. — / — tend to have a high future orientation.
-
7. — / — tend to be more inclined to multi -task than single-task.
-
8. — / — tend to “go with the flow”.
USA:
-
1. Americans tend to value rules very highly in this dimension.
-
2. — / — tend to value individuals very highly in this dimension.
-
3. — / — tend to have a very low level of personal involvement in business in this dimension.
-
4. — / — tend to hide rather than show emotions.
-
5. — / — tend to value achievements (what they do) very highly.
-
6. — / — tend to value the future very highly.
-
7. — / — tend to be more inclined to single-task than multi-task.
-
8. — / —, as a rule, are very inclined to take everything under control.
Using such data, assuming that they are correct, it is possible to build predictive models of interaction in business, taking into account the strategies of the parties. For example, in this regard, in our opinion, convenient tools would be: the game-theoretic model “Prisoner’s Dilemma”, “SWOT analysis”, etc.
The second resource for analyzing the world of values of different countries is the Geert Hofstede model — not the model itself, but the data obtained on its basis and published by “The culture factor group” — the current brand of Hofstede Insights Ltd.6 — a Finnish consulting company on cultural analytics and strategy. The company’s website states that this organization has offices in 10 countries and strategic alliances covering more than 60 countries.
The concept of the Dutch social anthropologist Geert Hofstede 7, similar in its purpose to the model of F. Trompenaars, also represents a universal model for determining the characteristics of the culture of countries. In its modern form, it is represented by the following indicators: Power distance index; Individualism vs. Collectivism; Motivation towards Achievement and Success (in Russian scientific literature this parameter is called “femininity/masculinity” — editor’s note); Uncertainty avoidance index; Long-term orientation vs short-term orientation; Indulgence vs restraint. In sociological and socio-philosophical discourses, Geert Hofstede’s model [11, Bataeva B.S.] is also known as the “culture compass”. This metaphor expresses a certain research inten- tion to search for “cultural barriers” that hinder understanding between people belonging to different cultures and, accordingly, being carriers of different cultural attitudes, values, algorithms and patterns of cultural behavior.
It is also striking that the metaphor of the “compass of values” was expressed quite accurately by W. Heisenberg in his work “Physics and Philosophy. Part and Whole”. He wrote: “The question of values is, after all, a question of what we do, what we strive for, how we should behave. Therefore, it is a question about man and for man; it is a question about the compass, which we should be guided by when finding our way in life. This compass has received different names in different religions and worldviews: happiness, God’s will, meaning and many others. The difference in names speaks of very deep differences in the structure of consciousness of human groups that have called their compasses by such names. I in no way wish to belittle these differences.
However, I have the impression that all formulations refer to the attitude of people to the central world order” [12, Heisenberg W.].
On the Hofstede-insights website 8, in the tabs “Our Models” — “Country comparison tool”, one can select a country and see its indicators according to the above criteria (Fig. 5).
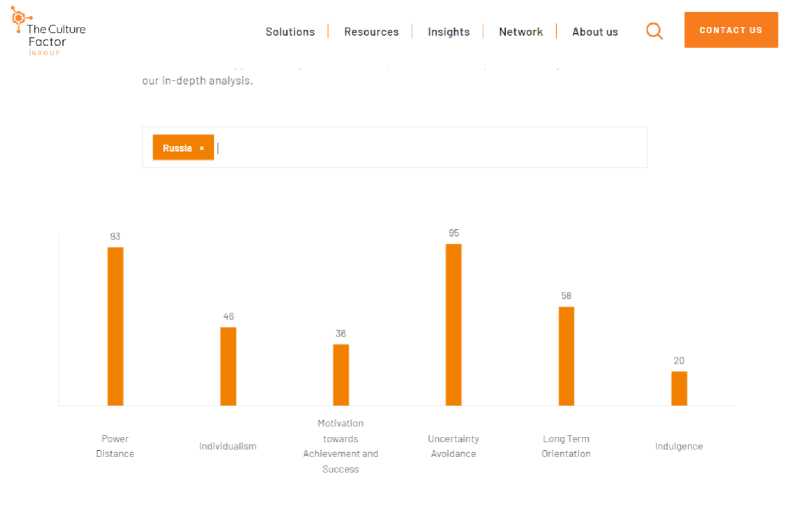
Fig. 5. Russia’s indicators in “Hofstede’s Dimensions of Culture” 9.
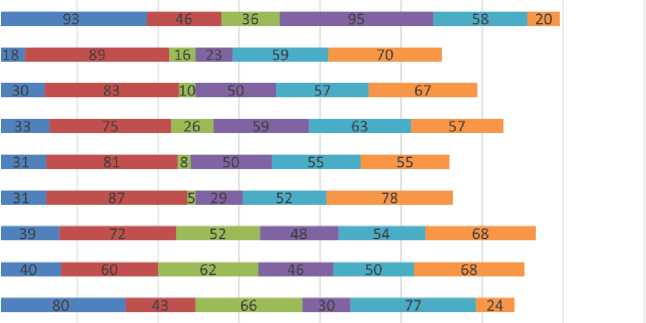
By analogy with the model of F. Trompenaars’s, we can build a data table based on G. Hof-stede’s model (Table 3, Fig. 5).
Table 3
Indicators of the Arctic Council countries and China (G. Hofstede’s model)
|
5 |
< о |
го го с го о |
с ф ф 5 СУ) |
го" 5 о г |
"с го с |
"с го о |
го Е с ф Q |
||
|
Power distance index (PDI) |
93 |
40 |
39 |
31 |
31 |
33 |
30 |
18 |
80 |
|
Individualism vs. collectivism (IDV) |
46 |
60 |
72 |
87 |
81 |
75 |
83 |
89 |
43 |
|
Motivation towards Achievement and Success |
36 |
62 |
52 |
5 |
8 |
26 |
10 |
16 |
66 |
|
Uncertainty avoidance index (UAI) |
95 |
46 |
48 |
29 |
50 |
59 |
50 |
23 |
30 |
|
Long-term orientation vs. short-term orientation (LTO) |
58 |
50 |
54 |
52 |
55 |
63 |
57 |
59 |
77 |
|
Indulgence vs. restraint (IND) |
20 |
68 |
68 |
78 |
55 |
57 |
67 |
70 |
24 |
Russia
Denmark
Iceland
Finland
Norway
Sweden
Canada
USA
PRC
О 50 100 150 200 250 300 350 400
■ 1. Power distance index (PDI)
■ 2. Individualism vs. collectivism (IDV)
■ 3. Motivation towards Achievement and Success (MAS)
■ 4. Uncertainty avoidance index (UAI)
■ 5. Long-term orientation vs. short-term orientation (LTO)
■ 6. Indulgence vs. restraint (IND)
Fig. 5. Comparative indicators of the Arctic Council countries and China (Hofstede’s model).
Comparative analysis of organizational culture in Arctic countries and China
Now we can compare the results obtained by two companies based on the Trompenaars and Hofstede models. The comparison provides an interesting picture of the variation in indicators in these models.
The next step is to understand the difference between the indicators of different countries. This can be done by identifying the difference between the indicators of the compared countries. In general, if we take 9 countries, then combinatorial search will give us a finite set of combinations (Table 4).
Table 4
Paired comparison of countries based on sociological data (Trompenaars model (TM) and Hofstede model (HM))
|
RF |
1 RF — USA |
2 RF — Canada |
3 RF — Sweden |
4 RF — Norway |
5 RF — Finland |
6 RF — Iceland |
7 RF — Denmark |
8 RF — PRC |
|
TM |
316 |
331 |
315 |
328 |
305 |
338 |
331 |
282 |
|
HM |
198 |
195 |
264 |
208 |
177 |
219 |
261 |
134 |
|
USA |
9 USA — Canada |
10 USA — Sweden |
11 USA — Norway |
12 USA — Finland |
13 USA — Iceland |
14 USA — Denmark |
15 USA — PRC |
|
|
TM |
75 |
151 |
130 |
151 |
106 |
109 |
420 |
|
|
HM |
29 |
122 |
106 |
95 |
97 |
131 |
148 |
|
|
Canada |
16 Canada — Sweden |
17 Canada — Norway |
18 Canada — Finland |
19 Canada — Iceland |
20 Canada — Denmark |
21 Canada — PRC |
||
|
TM |
172 |
181 |
190 |
161 |
94 |
363 |
||
|
HM |
101 |
77 |
66 |
68 |
106 |
169 |
||
|
Sweden |
22 Sweden — Norway |
23 Sweden — Finland |
24 Sweden — Iceland |
25 Sweden — Denmark |
26 Sweden — PRC |
|||
|
TM |
59 |
32 |
119 |
82 |
327 |
|||
|
HM |
56 |
97 |
47 |
47 |
234 |
|||
|
Norway |
27 Norway — Finland |
28 Norway — Iceland |
29 Norway — Denmark |
30 Norway — PRC |
||||
|
TM |
49 |
72 |
87 |
362 |
||||
|
HM |
45 |
19 |
75 |
218 |
||||
|
Finland |
31 Finland — Iceland |
32 Finland — Denmark |
33 Finland — PRC |
|||||
|
TM |
115 |
102 |
327 |
|||||
|
HM |
52 |
92 |
195 |
|||||
|
Iceland |
34 Iceland — Denmark |
35 Iceland — PRC |
||||||
|
TM |
93 |
404 |
||||||
|
HM |
56 |
229 |
||||||
|
Denmark |
36 Denmark — PRC |
|||||||
|
TM |
355 |
|||||||
|
HM |
229 |
Formal analysis of the obtained data allows ranking the countries by the degree of similari-ty/difference in the two models (Table 5).
Table 5
Comparative table of ranking countries by the degree of differences (in ascending order) in the Trompenaars
(TM) and Hofstede (HM) models
|
Rating |
Country |
TM |
Country |
HM |
|
High level |
||||
|
1. |
23 Sweden — Finland |
32 |
28 Norway — Iceland |
19 |
|
2. |
27 Norway — Finland |
49 |
9 USA — Canada |
29 |
|
3. |
22 Sweden — Norway |
59 |
27 Norway — Finland |
45 |
|
4. |
28 Norway — Iceland |
72 |
24 Sweden — Iceland |
47 |
|
5. |
9 USA — Canada |
75 |
25 Sweden — Denmark |
47 |
|
6. |
25 Sweden — Denmark |
82 |
31 Finland — Iceland |
52 |
|
7. |
29 Norway — Denmark |
87 |
22 Sweden — Norway |
56 |
|
8. |
34 Iceland — Denmark |
93 |
34 Iceland — Denmark |
56 |
|
9. |
20 Canada — Denmark |
94 |
18 Canada — Finland |
66 |
|
10. |
32 Finland — Denmark |
102 |
19 Canada — Iceland |
68 |
|
11. |
13 USA — Iceland |
106 |
29 Norway — Denmark |
75 |
|
12. |
14 USA — Denmark |
109 |
17 Canada — Norway |
77 |
|
Medium level |
||||
|
13. |
31Finland — Iceland |
115 |
32 Finland — Denmark |
92 |
|
14. |
24 Sweden — Iceland |
119 |
12 USA — Finland |
95 |
|
15. |
11 USA — Norway |
130 |
13 USA — Iceland |
97 |
|
16. |
10 USA — Sweden |
151 |
23 Sweden — Finland |
97 |
|
17. |
12 USA — Finland |
151 |
16 Canada — Sweden |
101 |
|
18. |
19 Canada — Iceland |
161 |
11 USA — Norway |
106 |
|
19. |
16 Canada — Sweden |
172 |
20 Canada — Denmark |
106 |
|
20. |
17 Canada — Norway |
181 |
10 USA — Sweden |
122 |
|
21. |
18 Canada — Finland |
190 |
14 USA — Denmark |
131 |
|
22. |
8 RF — PRC |
282 |
8 RF — PRC |
134 |
|
23. |
5 RF — Finland |
305 |
15 USA — PRC |
148 |
|
24. |
3 RF — Sweden |
315 |
21 Canada — PRC |
169 |
|
Low level |
||||
|
25. |
1 RF — USA |
316 |
5 RF — Finland |
177 |
|
26. |
26 Sweden — PRC |
327 |
2 RF — Canada |
195 |
|
27. |
33 Finland — PRC |
327 |
33 Finland — PRC |
195 |
|
28. |
4 RF — Norway |
328 |
1 RF — USA |
198 |
|
29. |
2 RF — Canada |
331 |
4 RF — Norway |
208 |
|
30. |
7 RF — Denmark |
331 |
30 Norway — PRC |
218 |
|
31. |
6 RF — Iceland |
338 |
6 RF — Iceland |
219 |
|
32. |
36 Denmark — PRC |
355 |
35 Iceland — PRC |
229 |
|
33. |
30 Norway — PRC |
362 |
36 Denmark — PRC |
229 |
|
34. |
21 Canada — PRC |
363 |
26 Sweden — PRC |
234 |
|
35. |
35 Iceland — PRC |
404 |
7 RF — Denmark |
261 |
|
36. |
15 USA — PRC |
420 |
3 RF — Sweden |
264 |
Analysis of the positions of countries at three levels (high, medium, low) gives the following results. According to both models, a high level of similarity of the “cultural compass” can be found only among Western countries, and the level of similarity is quite high among the northern countries. The leaders of the rating are Sweden — Finland (TM) and Norway — Iceland (HM). A high level can also be noted for the pair USA — Canada. At the medium level, Russia is added to the list of countries with common features. It is also noteworthy that in both models, Russia — China share 22nd position out of 36 possible. A low level of compatibility of indicators, according to both models, is noted in those pairs where Russia and China appear. The pair USA — China is the most different according to TM, and Russia — Sweden — according to HM.
One should also note a significant difference of indicators between the models: thus, TM evaluates the level of common values of the pair Russia — Sweden as the lower limit of the medium level, while HM places this pair on the last step of its rating.
In general, it can be noted that both ratings place Russia and China at the lowest level of formation of common cultural positions in relations with Western countries. Both models give very different results for a number of countries. For example, TM evaluates the similarity of the
USA — China as the most negative (36th position), on the other hand, HM puts the same pair on the lower limit of the medium level (23rd position). Other data also look contradictory, for example, the Russian Federation is similar to Finland, just as the USA is similar to China (23rd position), the Russian Federation is similar to Sweden, just as Canada is similar to China (24th position).
The main factors that formed the difference in organizational culture were the following parameters:
-
• Within the TM: a significant difference between Russia and other Arctic Council countries was revealed for a number of indicators at once (1. Universalism / particularism; 4. Neutral / affective; 5. Achievement / ascription (belonging); 6. Past, present, future; 7. Sequential/ Synchronic). A significant contribution to the difference in the organizational culture of the USA and Canada from such countries as Sweden, Norway, Finland was made by parameter 8. Internal / external.
-
• Within the HM: “power distance index” in relations between Russia and other countries, with the exception of China; “motivation towards achievement and success” in relations between the USA and Canada on the one hand and the Arctic Council countries, excluding Russia and China, on the other.
Thus, both ratings regarding organizational culture on the example of Arctic countries seem to be relatively coinciding. However, despite the partial coincidence of the ratings’ findings, it can be noted that there are also serious contradictions.
Conclusion
Several conclusions can be drawn from the analyses conducted:
-
1. The development of models of national and organizational culture, as well as their verification through mass sociological research, is an important area of social epistemology, sociology and cultural studies, making it possible to look at the world community as a dynamic, heterogeneous system consisting of many ways of cultural development and intercultural communication.
-
2. The comparative analysis of foreign sociological studies (the Dutch Internet resource “Trompenaars Hampden-Turner Connecting Viewpoints”, the Finnish Internet resource “The culture factor group” Hofstede Insights Ltd), created on the basis of national culture models (F. Trompenaars, G. Hofstede), shows that the results obtained in these surveys in relation to the Arctic countries are generally correlated with each other, but there are also exceptions when the same pair occupies completely different positions in the ratings.
-
3. The presence of a clear correlation for some countries and the absence of such for others indicate either errors in the use of primary data, or the use of incorrect data.
