Cyclic Spectral Features Extracting of Complex Modulation Signal Based on ACP Method

Author: ZHANG Xin, LIU Feng, ZHENG Peng, Wang Ze-Zhong
Journal: International Journal of Information Technology and Computer Science(IJITCS) @ijitcs
Article in issue: 3 Vol. 3, 2011.
Free access
Based on averaged cyclic periodogram cyclic spectral density estimating method(ACP), the cyclic spectral features of complex modulated signals are studied and the correspondence with signal parameters is investigated. The feature extraction methods without prior knowledge are developed. Firstly, the expression of complex modulated signals is described and the relationship between signal parameters is given; Secondly, the cyclic spectral features of signals are analyzed using ACP cyclic spectral density estimating method, the features correspondence with signal parameters is obtained; Based on the above, a method for parameter extracting based on cyclic spectral features is proposed. The normalized RMS error (NRMSE) of frank coded and Costas coded signals parameter extraction are measured to verify the validity of the method.
Complex modulation signal, cyclic spectral analysis, feature extraction
Short address: https://sciup.org/15011626
IDR: 15011626
Text of the scientific article Cyclic Spectral Features Extracting of Complex Modulation Signal Based on ACP Method
Published Online June 2011 in MECS
Complex modulation technique is widely used in low probability of intercept wideband signal [1], which makes Non-cooperative intercept receivers difficulty in looking for these signals. The conventional signal processing methods such as energy detection and power spectral density analysis cannot provide details about the complex modulation parameters. Recent research [2] have shown that intercept receiver can increase its processing gain by implementing cyclo-stationary signal processing method so as to raise the effect of features extraction.
This paper investigates an improved cyclic spectral feature extracting method based on averaged cyclic periodogram The key parameters (bandwidth B , code length Nc , code rate Rc , codes period tm , modulation period T and carrier frequency fc etc.) of complex modulated signals are estimated on the condition of unknown prior knowledge. The detail procedures of the method are presented and the extracting effects on the frank coded and costas coded signals are evaluated, since the two typical complex modulated signals have the firstand second-order statistic periodicity [9].
-
II. M ODELING OF S IGNAL P ARAMETERS
The complex modulated signal intercepted by noncooperate receiver can be written as
A t) = s( t) + < t) (1)
where n ( t ) is addictive white Gaussian noise (AWGN), s ( t ) is complex modulated signal. Two typical signals are modeling as below.
-
A. Frank Coded Signal
Frank coded signal is one type of polyphase-coded signal which can be written as[4]
s ( t ) = A exp{ / 2 p f c t + f t ) + qc\} (2)
where A is the margin of s ( t ) , f is carrier frequency, q c is initial phase. We start from a pulse of duration T .The pulse is divided into N bits of identical duration tb = T / N ,the code rate is R ^ = 1 / T ,and each bit is assigned with a different phase value at , k = 1,2, L , N .The phase envelope is
N ft) = ^ a/ect(/- ktb) ,which can be presented in k=1
Table.1
a Frank code is used with M sub-codes, a carrier frequency of f = 1000 Hz and sampling frequency of f = 7 kHz with SNR=0dB [10]. The Frank code is a polyphase code with each sub-code phase defined as fu=2P (i -1,(/'1f (3)
where i = 1,2, L M , j = 1,2, L M , Nc = M . The number of codes is M , total code length is Nc and code period is tm [11]. The ambiguity function of Frank coded signal can be written as
m = -•
| g„ (t) | Wh (t, n +

B. Costas Coded Signal
Costas coded signal is divided into N bits of identical duration b = T / N , the frequency code sequence is a = { a 1 , a , , L , а м } ,the code length is M . The complex envelop of Costas coded signal can be described as[6]
d t) =
where
1 M , ^ a um[^-
( m - 1)/ b ]
g„ (t) = 7 oT%(t)^tt — t) ejpnt/T»(5)
•
Wh(t, n) =o wh(t)w*(t- t)e j2pntdt(6)
- • and
X t) = Wh (t) ◊ %(t)
% where %(t) is periodic extend of x(t) , wh (t) is the
where
um (t)
and
= I exP(T2.pvmt), = t0
0 £ t £ tb elsewhere
a
window function with length T .Fig.1 shows the ambiguity function of 16 elements Frank coded signal.
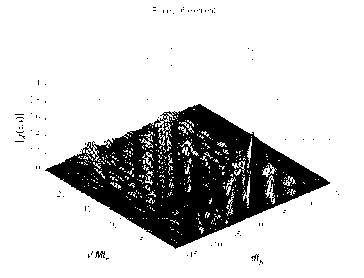
Figure 1. Ambiguity function of 16 elements Frank coded signal
The AF of Frank coded signal can be written as
1 M
c^ t, n) = a exp[j2,p(m - 1)mb{F mm(t, m)
M m = 1
M
+ a Fmn[ t - (m - n)b, mi}
where
F mn ( t , m = (1 - ^ )^^^ ^ exP(-. j b - j 2 P f n t ) >| t | £ t b tb a
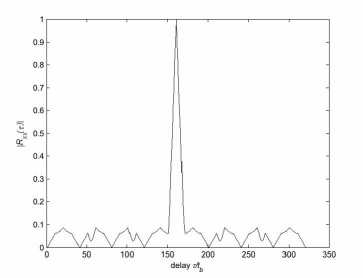
Figure 2. Zero-Doppler cut of 16 elements Frank coded signal AF
Fig.3 shows the ambiguity function of 7 elements Costas coded signal.
Figure 3. Ambiguity function of 7 elements Costas coded signal
The zero-doppler cut AF of Frank coded signal is shown in Fig.2, which is also the autocorrelation function of Frank coded signal. The correlation function is zero for displacements of multiples of M since the rows of the Frank matrix are orthogonal. The autocorrelation has a magnitude of unity for displacement of one more or one less than multiples of M . The Frank code exhibits good properties of relatively low sidelobes.
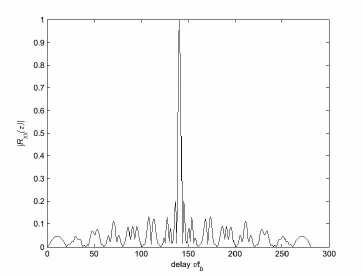
Figure 4. Zero-Doppler cut of 7 elements Costas coded signal AF
The zero-doppler cut AF of Costas coded signal is shown in Fig.4, which is also the autocorrelation function of Costas coded signal. We can conclude the first null is located at T / M = tfc / M = tfc / 7 .This implies that the pulse compression of a Costas signal is M . To reduce the sidelobe pedestal, M will have to be increased. Besides, the value M / tb is approximately the spectral width of the Costas signal[6].
We can summarize both Frank and Costas coded signals’ parameters and the interrelationship among them like:
b = 1/ b
T = N ◊ b (15)
Rc = 1 / T in Frank coded signal and
B = M / t b, T = N ◊ b R c = 1 / t
-
III. C YCLIC S PECTRAL F EATURES BASE ON ACP M ETHOD
-
A. A General Quadratic Form of ACP Method
Given an finite length signal sequence { Xn ]} L = 0 , any non-parametric estimator $ 2 x ( f , a, L ) of the cyclic spectrum S 2 j X f , a can be deduced from the general quadratic form[7].
$2x(f, a,L) = Da L- p = 0
L - 1
1a ql [p qXp q = 0
X
X[qi * e" j2P f+ ba)pD e^P f - ba) qD where QL is a suitably chosen positive semi-definite kernel such as to preserve the interpretation of $2 x( f, a, L) as a power density and in particular $2x( f a, L) 3 0 for a = 0 .The double Discrete Time
Fourier Transform (DTFT) of kernel QL which can be used as y(l , h)
L - 1 L - 1
y L (l , h) = D 2 a a Q l [ P q i e jpl ( p - q ) D e j 2 ph q D (18) p= 0 q = 0
Different kernel QL result in different spectral estimators. Let { w [ n |} N w 01 be a positive and smooth N -long data-windows and let w^n | = w [ n - kR be its shifted version by R samples. Then the double DTFT of kernel QL is
L - 1 L - 1
y(l , h) = D 2 a a Ql [ P q i e j 2 pl ( p- q ) D e -j 2 phqD p= 0 q = 0
= W( l) W(l - h) * DR (h) e-jphRD1^ K-1’ with W( f) the DTFT of w[ni and
D R D у) = Islnl p/ R D L ) .
K K sinpl R D)
The averaged cyclic periodogram is obtained by introducing (19) into (17)
K
$ 2 x ( f, a , L) = -L- a X^ k ( f + ba ) X ( k ( f - ba )* (20) K D t = 1 N w N w
R + N „ - 1
with X(k (f) =D a wk[nШnie j2pfnD the w n = R short-time DTFT of the kth weighted sequence { w^[n^ni} R+ Nw-1 and
K = |( L - N w ) / Ri + 1 .Formula(20) can be very efficiently implemented since the parallel two liner FFT processing faster than double DTFT in (17).Imposing Nw to be a power of 2, the ACP method is more efficient. In practice application, we can use the modulo[8] cyclic spectrum density function (or the modulus square) after the method of integration along the frequency axis, that is defined by spectral correlation model function of the marginal distribution cycle frequency.
P s ( a, L ) =q+ ^ I $ 2 x ( f , a, L ) | df (21)
This reduces the frequency of the same cycle phase between different frequency spectral of random phase cancellation, concentration energy, highlighting the relative intensity of spectral lines, improving the detection probability and estimation accuracy.
-
B. Cyclic Spectral Features of Frank Coded Signal
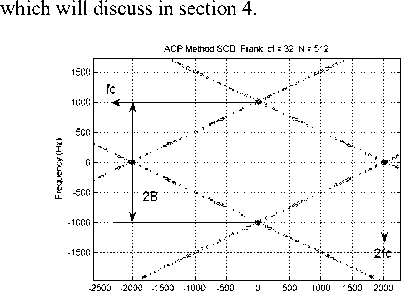
The ACP method estimation results of a Frank coded signal are shown in Fig.5 and Fig.6, which represent signal parameters in bi-frequency plane respectively. Fig.1 illustrates the measurement of fc andB ; Fig.2 illustrates the measurement of fc and Rc [14]. In Fig.5, we can get B by measuring the distance of coordinates of peak value on frequency axis, namely B = 1000 Hz, and get carrier frequency by projecting the peak value of support area on cyclic frequency axis, namely fc = Fc / 2 ; In Fig.6, we can get Rc by measuring the distance between main and sub- support areas on cyclic frequency axis. We can calculated more parameters in the basis of B , Rc and fc ,
Cycle frequency (Hz)
Figure 5. Cyclic spectral features of Frank coded signal in main support area
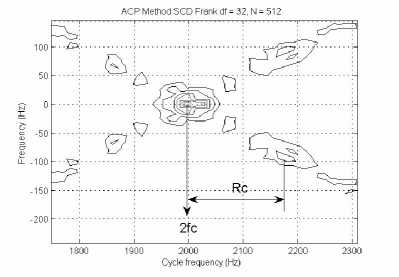
Figure 6. Cyclic spectral features of Frank coded signal in sub-support area
-
C. Cyclic Spectral Features of Costas Coded Signal
The ACP method estimation results of a Costas coded signal are shown in Fig.7 and Fig.8, which represent signal parameters in bi-frequency plane respectively. Fig.7 illustrates the measurement of B ; Fig.8 illustrates the measurement of fm and Rc [14]. In Fig.7, we can get B by measuring the distance of coordinates of peak value on frequency axis, In Fig.8 we can get Rc by measuring the distance between main and sub- support areas on cyclic frequency axis. and get frequency modulation sequence by projecting the peak value of support area on cyclic frequency axis; We can see the cross terms[9] exists between frequency 4.7KHz and 5.6KHz, which mean the two frequency in the frequency modulation sequence are adjacent, but we can’t get the order of the frequency sequence. We can calculated more parameters in the basis of B , Rc and fc , which will discuss in next section.
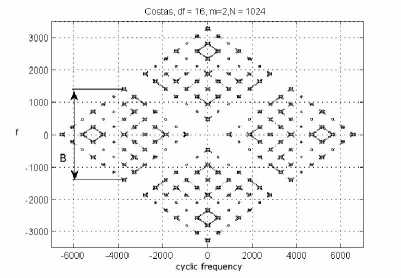
Figure 7. Cyclic spectral features of Costas signal in main support area
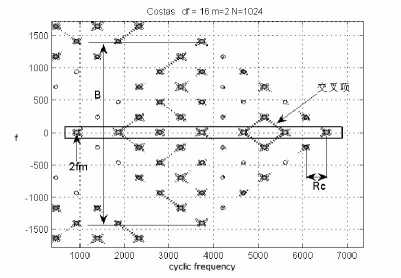
Figure 8. Cyclic spectral features of Costas signal in sub-support area
With -10dB noise added, measurement ability in Fig.5, 6, 7 and 8 remains fairly robust [15] since AWGN is not correlated and is suppressed in this cyclic spectral analysis.
-
IV. C YCLIC F EATURES E XTRACTION OF C OMPLEX M ODULATED S IGNALS BASED ON ACP M ETHOD
The block diagram of the complex modulation extraction algorithm that uses ACP method results is shown in Fig. 9.
-
A. ACP Method Processing on Frank Coded Signal
The first step is to crop main and sub-support area[11]. After cropping the area of support, an adaptive threshold operation is performed to reduce the amount of noise present on bifrequency plane[10]. This is followed by scanning axis for detection of maximum magnitude on bifrequency plane. The scanning results are used to measure the bandwidth B , carrier frequency fc , subsequently calculate the code length N modulation period tm and modulation period T .
An approximation to the PDF is constructed by scanning both the i -and j -axis and finding the magnitude above threshold corresponding to each index in main and sub-support areas simultaneously. The horizontal scan gives the i -index values as
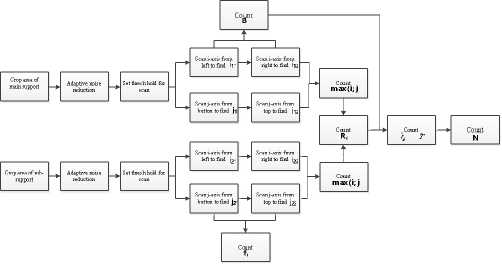
Figure 9. Block diagram of complex modulation signal feature extraction processing using ACP method
N x, a S(,j) (22)
j = 1
and
PDF. = . x /=(1: N (23)
a x j = (1: N )
This energy distribution enables the location of the support areas in the bifrequency plane to be determined. In main support area, the scan on both i - and j - axis from the lower index values to the higher index values to a level above -6dB gives i 11 and j 11 ; from the higher index values to the lower index values to a level above -6dB gives i 12 and j 12 . In sub-support area, the scan remains the same as in main support area and give i 21 , i 22 , j 21 , j 22 . Thus
2 f = i 21 2 i 2 2 (24)
and
B = j 11 2 j iz (25)
We introduce(24) and (25) into (15),the modulation time tb ,code length N and modulation period T can be obtained.
-
B. ACP Method Processing on Costas Coded Signal
For Costas coded signal, the ACP algorithm processing steps remains the same on the whole, but the key parameter fc in Frank coded signal becomes frequency modulation sequence fm [11].In main support area of Costas coded signal, the scan on both i - and j -axis from the lower index values to the higher index values to a level above -6dB gives i11 and j11 ; from the higher index values to the lower index values to a level above -6dB gives i1M and j1M . In sub-support area, the scan remains the same as in main support area and givei21 i22 , j2M , j2M . Thus
2 f = i ! i + i !( i + 1) c 2
and
B = j i1 + jM
1 M
R„ (^ - i )
c m - 1 i " 2 2 i 2( i - 1)
We introduce(26), (27)and (28)into (16), the modulation time tb ,code length N and modulation period T can be obtained[12].
In terms of a noisy background, the scan method described above will degrade the signal’s PDF. The procedure can be modified to use an adaptive noise filter[13].
-
V. T ESTING THE A LGORITHM
To evaluate the algorithm’s accuracy, the parameter extraction algorithm is tested in this section.
-
A. ACP Method Processing on Frank Coded Signal
The algorithm checks the signal for the existence of the noise and uses cyclic spectral analysis method to extract the parameters. The signals with no noise can analyzed with 64Hz of frequency resolution but the signals with -6dB noise cannot analyzed with it due to the computational difficulties. The signal with -6dB noise do not have a code rate solution, since the resolution of the frequency should be smaller than the largest parameter being measured or extracted [14].When code length Nc is
9 and 16, the corresponding code rate Rc are
R = — = ---1---= 111.1 Hz > 64 Hz (29)
Nt b, 9 * 10 - 3 s
R = — = ---1---= 62.5 Hz < 64 Hz (30)
c Nt6 16 * 10- 3s from (29)and (30)We see the frequency resolution D f can achieve 64Hz when Nc £ 9 ,while N3 16 , D f can’t achieve 64Hz,,neither the code Rc ,the effectiveness of ACP is decided by code length Nc .
Three Frank coded signals are analyzed in the test, the key parameters are fc , fs , B , N , and the range of SNR is -10~0dB.The normalized RMS error (NRMSE)[15] is used to verify the effectiveness of parameter extracting. If $ k ( k = 1,2, L , N ) is the estimate value of a quantity whose exact value is a , then NRMSE is defined by:
NRMES = 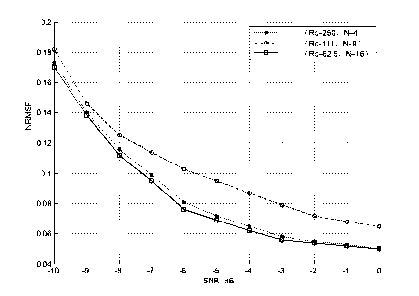
Figure 10. fc NRMSE curves of Frank coded signal
TABLE I. T URE AND M EASURED P ARAMETERS OF F RANK
S IGNAL
|
Signal |
True Parameters |
|||||
|
fc |
B |
Rc |
tb |
T |
Nc |
|
|
1 |
1K |
1k |
250 |
1 |
4 |
4 |
|
2 |
1K |
1k |
111 |
1 |
9 |
9 |
|
3 |
1K |
1k |
62.5 |
1 |
16 |
16 |
|
Signal |
Measured Parameters |
|||||
|
1 |
1001 |
1012 |
246 |
0.99 |
4.07 |
4.11 |
|
2 |
998 |
1231 |
116 |
0.81 |
8.62 |
10.61 |
|
3 |
1073 |
957 |
61.5 |
1.04 |
16.3 |
15.56 |
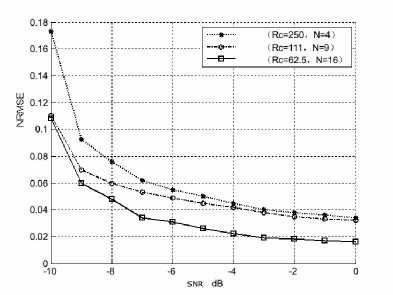
Figure 11. Bandwidth B NRMSE curves of Frank coded signal
TABLE II. NRMSE OF K EY P AMAMETERS OF F RANK S IGNAL
|
Signal |
fc |
B |
Rc |
t µ b |
T µ |
N µ |
|
1 |
0.081 |
0.055 |
0.013 |
0.036 |
0.013 |
0.087 |
|
2 |
0.073 |
0.049 |
0.010 |
0.032 |
0.012 |
0.127 |
|
3 |
0.072 |
0.031 |
0.009 |
0.029 |
0.010 |
0.053 |
For the test results, The NRMSE curve of carrier frequency fc and bandwidth B are shown in Fig.6, The curves of code rate Rc and modulation period T are just like the curve of fc [17],which are influenced by resolution of cyclic frequency D a ;the curves of modulation time tb is just like the curve of B ,which is influenced by the resolution of frequency D f .
The test results shows that the NRMSE curves of B and tb are more remarkable than that of the other parameters. The NRMSE of code length Nc is decided by both D a and D f , the results is more complicated. The NRMSE of other parameters decline with the increase of N , since the long code length can obtain good processing gain.
-
B. ACP Method Processing on Costas Coded Signal
First we evaluate the computation complexity of ACP method on feature extraction of Costas signals. The code length is N , ACP method compute two parallel FFT, and each computation follow the linear logarithm complexity[18], means O ( 2 N l og2 N ) .The traditional cyclic spectral estimator compute double FFT, the computation follow the quadratic order complexity, mean O ( N ) . O ( 2 N log2 N ) is lower order than O ( N ) in general[19], and the computation complexity of ACP method declines significantly as code length N increases. Meanwhile, the resolution restriction is just the same as Frank coded signal showed in (29) and (30), hence the effectiveness of ACP is decided by code length N .
200 times Monte Carlo simulation tests are carried out in the condition of different SNR. The parameters used to generate the Costas coded modulations are fs =7000Hz, fc =1000Hz, B =1000Hz, and f m = {4,7,1,6,5,2,3} Hz . The NRMSE curves are plotted in Fig. 12 .
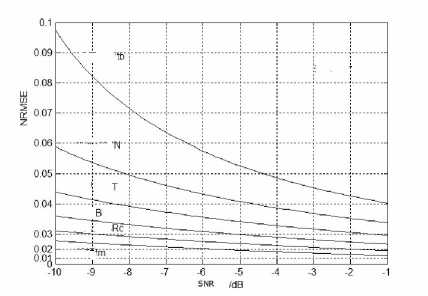
Figure 12. True and Measured Parameters of sig5 and sig6
in Fig.12,The curves of the key parameters preserve the same declining type. The NRMSE of modulation time tb , code length N and modulation period T is larger than the other parameters, which means the former three parameters are easily influenced by AWGN[20]. In addition, the ACP method processing results of Costas coded signal has the more limitations than Frank coded signal. The effectiveness of extracting limited by the resolution of frequency and cyclic frequency on both situations, while ACP method can’t determine the order of Costas coded signal frequency modulation sequence.
References Cyclic Spectral Features Extracting of Complex Modulation Signal Based on ACP Method
- P. E. Pace, “Detecting and Classifying Low Probability of Intercept Radar”, Norwood, MA: Horizon House Artech, 2004.
- P. D. Sutton, K. E. Nolan and L. E. Doyle, “Cyclostationary Signatures in Practical Cognitive Radio Applications”, Selected Areas in Communications, IEEE Journal on, vol.26, pp. 13-24, 2008.
- Sanmartin-Jara, Burgos-Garcia,M, and Retamosa-Sanchez, Radar sensor using low probability of interception SS-FH signals.[J].IEEE Aerospce and Electronics Magazine, April 2000. pp 23-28
- Akay O,Erozden E. Use of fractional autocorrelation in efficient detection of pulse compression radar signals[C], IEEE First International Symposium on Contrlo, Communications and Signal Processing, 2004:33-36
- N Levanon L U. Two-Valued frequency-coded waveforms with favorable periodic autocorrelation[J]. IEEE Trans on AES. 2006,42(1):p237-p248.
- N Levanon, E Mozeson, Radar Signals[M],A John Wiley & Sons,INC., Hoboken,New Jersey:100-168,2004.
- Jennison B K.Detection of polyphase pulse compression wave forms using the Radonambiguity transform[J].IEEE Trans.on Aerospce and Elec.Sys,2003,39:225-343
- Milne P R, Pace P E. Wigner distribution detection and analysis of FMCW and P4 polyphase LPI waveforms[C]. Proc.IEEE International Conf.on Acoustics, Speech and Signal Processing, 2002:3944-3947
- W. Jiandong, C. Tongwen and H. Biao, “Cyclo-period estimation for discrete-time cyclo-stationary signals”, Signal Processing, IEEE Transactions on, vol.54, pp. 83-94, 2006.
- K.-S. Lii and M. Rosenblatt, “Estimation for almost periodic pro-cesses,” Ann. Statist., vol. 34, no. 3, pp. 1115–1139, 2006.
- T. O. Gulum, P. E. Pace, “Extraction of Polyphase Radra Modulation Parameters Using a Wigner-Ville Distribution-Radon Transform”, IEEE International Conf. on Acoustics,Speech and Signal Processing, Las Vegas, NV, March 2008
- Gardner, W. A., “Statistical Spectral Analysis: A Nonprobabilistic Theory”, Prentice-Hall, Englewood Cliffs, NJ, 1987.
- R. S. Roberts, W. A. Brown and Jr. H. H. Loomis, "Computationally efficient algorithms for cyclic spectral analysis," Signal Processing Magazine, IEEE, vol.8, pp. 38-49, 1991.
- Gardner, W.A, “Signal interception: A unifying theoretical framework for feature detection”, IEEE Trans. on Communications, vol. 36, No. 8, pp. 897-906, Aug. 1988.
- Antonio F. Lima, Jr. “Analysis of low probability of intercept radar signals using cyclostationary processing”, Naval Postgraduate School Master’s thesis, Sept.2002.
- T. O. Gulum, “Autonomous Nonlinear Classification of LPI Radar Signal Modulations,” Naval Postgraduate School Masters Thesis, Sept. 2007.
- Dobre.O.A. Abdi.A, Bar-Ness.Y. Su, W. “Survey of automatic modulation classification techniques: classical approaches and new trends”, Communications, lET,volume 1, pp. 137 - 156, (2007).
- A. V. Dandawate and G. B. Giannakis, “Asymptotic Theory of Mixed Time Averages and kth Order CyclicMoments and Cumulant Statistics,” IEEE Trans. Inform. Theory, vol. 41, pp. 216–232, January 1995.
- Antonio Napolitano, “Discrete-Time Estimation of Second-Order Statistics of Generalized Almost-Cyclostationary Processes”, IEEE Trans on signal processing, vol. 57, No. 5, May 2009
- A. Napolitano, "On the spectral correlation measurement of non-stationary stochastic processes," in Proc. 2001 Signals, Systems and Computers, 2001. Conference Record of the Thirty-Fifth Asilomar Conference on, pp. 898-902.
