Data-driven Classification of Tsunami Evacuation Suitability Using XGBoost: A Case Study in Padang City

Author: Sularno Sularno, Wendi Boy, Putri Anggraini, Ahmad Kamal, Fei Wang
Journal: International Journal of Intelligent Systems and Applications @ijisa
Article in issue: 1 vol.18, 2026.
Free access
In this research, we established a machine learning–based model to predict the suitability of tsunami evacuation locations in Padang City through the Extreme Gradient Boosting (XGBoost) method. We trained the model on a new synthetic dataset with 5,000 observations with key geospatial and demographic features such as elevation, distance to coastline, suggested evacuation capacity, surrounding population count and site area. The analysis process consisted of preprocessing, feature selection utilizing the XGBoost Classifier, training and cross-validation on each model, and evaluation through regression as well as classification metrics. The XGBoost model performed best (RMSE=0.0642, MAE=0.0418 and Accuracy=93.8%), which was even better than Random Forest, Gradient Boosting Trees and Logistic Regression models. These findings demonstrate that XGBoost can successfully extract complicated spatial–demographic associations with little overfitting. The residual analysis and the actual-vs-predicted plots also reveal good model calibration and stability. A web prototype was also created to visualize the suitability of evacuation and facilitate spatial decision making. Although the model is based on simulated data, it offers an extendible and interpretable framework to be integrated in practical scenarios with field and operational disaster management systems. To the best of our knowledge, this work represents the first use of XGBoost algorithm in Indonesia to classify tsunami evacuation sites and functions as a new tool for disaster preparedness and evacuation plans on the coast.
Tsunami Evacuation, XGBoost, Machine Learning, Disaster Prediction, Early Warning System
Short address: https://sciup.org/15020216
IDR: 15020216 | DOI: 10.5815/ijisa.2026.01.07
Text of the scientific article Data-driven Classification of Tsunami Evacuation Suitability Using XGBoost: A Case Study in Padang City
The regency of Padang City capital of West Sumatra Province is among the areas in Indonesia that has high level risk to tsunami. This weakness arises from the fact that it is situated near to an active megathrust subduction zone, where the Indo-Australian and Eurasian plates collide [1]. Tsunami potential has been regenerated numerous times by the Meteorology, Climatology and Geophysics Agency (BMKG), with map scenarios’ describing arrival time’s range 20–30 min after a big earthquake [2]. Especially in this context, the pace of evacuation is a key factor, making well-prepared and data-based evacuation point locations (EPLs) an essential requirement [3].
To date, the majority of Indonesia tsunami evacuation policies - including those in Padang City- still depend primarily on conventional methods and have not yet completely adopted predictive technology. Nevertheless, due to the short time available for evacuation, there is a pressing need for smart, adaptive and data-driven systems able to quickly suggest suitable sites for evacuation. Machine learning, especially the modelling of classification type has great potential solution to solve it: predicting automatically the suitability according to numerous spatial and social features [4-5]. Although a number of earlier works [6–8] have used GIS as the basis for generating tsunami risk maps and estimations, but very few efforts have been made to apply the machine learning classification techniques directly to predict the actual evacuation locations.
In this concern, one of the well-suited models is the Extreme Gradient Boosting (XG-Boost), since it has proven its great predictive accuracy in several disaster event studies like the floods [9], landslides [10], droughts [11] and earthquakes [12]. XGBoost is a gradient boosting algorithm that sequentially minimizes prediction errors through an optimization of the loss function while including model regularization to avoid overfitting [13,14].
But the application of XGBoost for model input selection in tsunami evacuation location determination has not been addressed properly yet, which is a research gap. In this research, we consider the problem of building a machine learning based prediction system for labelling each site as suitable (1) or not suitable (0) to evacuate during tsunamis. Some obvious such features, which make the output space a set of discrete decisions rather than a continuous value (since “exposure to storm surge” is not a smooth function of its features) include elevation, distance from coastline, evacuation capacity and population density as well as the rest of data set that was used to construct local preparedness levels. The focus on classification is very important to obtain fast and easy interpretable decisions for early warning and disaster control on any scale.
This research aims to make an intelligent model for the classification of tsunami evacuation sites using XGBoost algorithm in Padang City by using spatial and demographic data that is simulated first. The study develops an end-to-end analytic pipeline, starting from data preprocessing and feature selection (XGBoost Classifier), model training, performance evaluation using classification as well as prohibitive metrics to visualization of the classification results. Within a classification framework, our model is specifically designed to classify the practical availability of each evacuation site (feasible = 1 or not feasible = 0), which allows for easy and direct decisions in real time disaster scenarios. We chose XGBoost, because it has been shown to capture nonlinear feature interactions, preventing overfitting by regularization, and being able to achieve high predictive accuracy even when the data is limited or unbalanced such as in disaster prediction tasks like floods [15], landslides [16] and coastal hazard domains. Moreover, the incorporation of geospatial analytics into machine learning classification is a unique contribution in that it converts traditional static tsunami risk mapping to dynamic and data-driven decision support. This combination enables the system not only to make the decision on site detection but also explainable feature importance for transparentness as per XAI principles that increase trust and interpretability of AI-based disaster management systems [16].
Despite its potential, the proposed technology has several limitations that define its current scope. The model is trained on simulated datasets and static geospatial inputs, rather than real-time sensor data or field-validated evacuation conditions. It also focuses primarily on geospatial attributes such as elevation and distance to the coastline, while excluding critical non-geospatial factors such as building structural integrity, road accessibility, population vulnerability, and ground liquefaction risk. Moreover, the web-based application developed in this study remains at a prototype stage and has not yet been integrated into BPBD or BNPB operational systems.
Theoretically, this research expands the application of machine learning in the disaster domain, particularly in data-driven evacuation contexts. Practically, the outcomes of this study are expected to assist local governments, BPBD (Regional Disaster Management Agencies), and other disaster response institutions in developing more responsive and adaptive evacuation strategies based on realistic disaster scenarios [17,18].
The novelty of this work is also on the modeling and geospatial analytics most specially its integration with machine learning–based classification of the tsunami evacuation site assessment at city level. In contrast to previous work which was heavily dependent on static GIS-based hazard maps or subjective multi-criteria scoring systems, this work develops an interpretable and data-driven XGBoost -based model that can automatically categorize evacuation site suitability based on spatial and demographic factors. The proposed framework not only conducts binary classification (suitable / not suitable) but also uses SHAP analysis to explain the importance of features and helps decision makers to understand how each factor affects the model’s prediction. The main contributions of this study are threefold: (1) implementation of a reproducible analytical pipeline including data pre-processing, feature selection, model training and web-based visualisation for the purpose of tsunami evacuation planning; (2) the provision of an early prototype decision-support application to support local disaster management agencies in BPBD/BNPB with improving readiness and situational awareness; (3) demonstration on the potential use-case of XGBoost for spatial binary classification problems within disaster resilience building up AI–GIS hybrid systems.
The structure of this paper is organized as follows. Section 2 reviews the literature and previous studies focusing on the integration of artificial intelligence and geospatial analysis for disaster risk reduction. Section 3 describes the research methodology, including data collection, preprocessing, feature selection, and model development using the XGBoost algorithm. Section 4 presents the experimental results and model performance evaluation based on both regression and classification metrics, accompanied by visual interpretation, model validation, and the implementation of a web-based prototype as a decision-support system for tsunami evacuation planning. Finally, Section 5 provides the conclusion, summarizing the main findings, discussing the study’s limitations, and outlining recommendations for future research and development.
2. Related Works
There is abundant research literature to prove that XGBOOST outperforms other predictive models like Random Forest, Decision Tree and Support Vector Machine. For instance, a model for prediction of water level based on XGBoost and evolutionary algorithms obtained high-accuracy results in continuous forecasting [19]. XGBoost has also been extended to model and predict the flood susceptibility for urban disaster reduction, which usually provides better accuracy as well as robustness compared with other traditional methods even faced with imbalanced data [20,21]. However, most of these applications are addressed in the context of regression problems (e.g., estimating continuous variables such as water levels, rainfall or risk scores). However, the adoption of XGBoost in binary classification problems, such as determining if a tsunami evacuation area is available or not available, has been less common. This is an important distinction, as classifiers do more than estimate likelihoods: they make discrete choices and must perform well at higher stakes, such as in disaster response planning.
In contrast to other studies that predominantly have centered on tsunami hazard mapping and macroscale vulnerability assessments based upon Geographic Information Systems (GIS), our research proposes a data-driven classification model using the XGBoost ensemble learning algorithm for object-oriented site-based assessment of the suitability for tsunami evacuation with improved accuracy and automation. Previous works (e.g., [22,23]) have used spatial overlay and human behavior simulation in evacuation planning as well, yet without predictive automation or any sort of probabilistic interpretability that is enough for evidence-based decision support. Recent breakthroughs show that the ensemble learning models combined with geospatial features datasets can boost prediction accuracy and model transparence of disaster risk [16,24]. Continuing along this direction, we use geospatial classification based on XGBoost, to develop an adaptive, transparent and reliable evacuation prediction system that can be directly adopted by high-risk coastal urban planners and disaster management agencies in Padang City (Indonesia).
3. Methodology
The research flow in this study begins with data collection, followed by preprocessing, training the XGBoost model, model evaluation, and result visualization. This flow can be seen in Fig. 1.
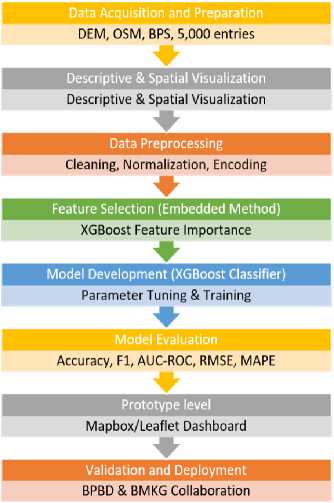
Fig.1. Research flow
Fig. 1. Shows the general flow of work including data collection in CSV format from Kaggle. The second stage is the preprocessing of data by filling in missing data and normalizing input data, and feature selection using XGBoost Classifier. After preprocessing the data, we use XGBoost algorithm as a binary classification model to assign each location either to suitable (as 1) or not suitable for tsunami evacuation ( as 0). The model is trained and tested on regression-based metrics including Cross-Validation RMSE, MSE, RMSE, MAE, MAPE as well as classification metrics like Accuracy, Precision, Recall, F1-Score and AUC-ROC [25]. Here the classification output, predicted probabilities are visualized on testing data to see model calibration and depth of prediction capability w.r.t actual class labels. This process-based methodology helps to guide the development of an intelligent, data-driven classifier for tsunami evacuation site recommendation in Padang City [26].
Data Analysis Methods
Quantitative data analysis was used in this research to measure the TS capacity in Padang City, based on both spatial and demographic parameters. The population data set contained 5,000 records filled with hypothetical characteristics of the evacuees. This analysis uncovered statistical patterns, provided an overview of relations between the features and prepared for ML modeling with the XGBoost model.
The first step in data analysis was to perform descriptive statistics exploration where the mean, median, minimum, maximum and standard deviation were calculated for all numerical variables of Interest (Elevation m), Distance To Beach (km), Area (Ha) and Recommended Capacity (Evacuees) as well as Number of People. This step gave a general description of the spatial and demographic distribution of potential evacuation destinations. The shape, central tendency and outliners of each variable were obtained through visualization tools: histograms, boxplots and scatter plots. Most of the variables were then correlated with Pearson’s correlation coefficient to study the crucial connections between features and possible interpredictor interactions or multicollinearity.
Furthermore, geospatial analysis was performed in Python and QGIS to graphically illustrate the evacuation site distribution with respect to coast lines and elevation gradients. This validation step allowed us to assess if simulated data could truly and accurately represent the real-world spatial characteristics of tsunami risk in Padang City. The analysis revealed that low-elevation, near-coastline zones were associated with high population exposure, which coincided with official hazard mapping conducted by BNPB and BIG. The findings of this analysis formed the basis of feature selection, data preprocessing, as well model training in XGBoost classifier.
Data Preprocessing
We then preprocessed the data so that it was clean, consistent and ready to be used for machine learning. The datasets employed in this research composed of 5,000 data that simulated the condition of tsunami evacuation sites in Padang City. We also carried some common pre-processing steps, such as data cleaning step normalization step encoding and dataset splitting. These measures were adopted in order to enhance data quality and remove any potential bias before the model was trained with the XGBoost classifier.
Data cleaning First, they cleaned the data set to fill any missing values and remove duplicates and discrepancies. Mean or median imputation was performed, and duplicate rows removed for integrity of data. The interquartile range (IQR) method was used for outlier detection to prevent extreme values from biasing model learning. All their numerical features Elevation (m), Distance to Beach (km), Area (Ha), Recommended Capacity (Evacuees) and Number of People were visited to ensure proper value ranges from the local topology and demography data.
Second, we normalized the features through Min–Max scaling to transform all numerical features into the range of [0, 1]. This normalization also means that a single variable does not overshadow the model because of its units. The binary classification Ts was used on the Categorical target variable 'Eligible for Evacuation' (0=Not Eligible, 1=Eligible). Furthermore, the columns were named in a standard manner for coherence and legibility.
Finally, the datasets were randomly divided into a training dataset and testing one at an 80:20 split following stratified sampling to maintain class balance between eligible and non-eligible sites. Despite such a positive conclusion, architects must be wary of imbalanced class representation, as this will likely deviate the model and cause brokering index to be biased. The training subset was applied to fit the model while the test subset was used for an independent validation. The dataset was thus preprocessed to an organized and balanced shape appropriate for precise and unbiased prediction of the suitability for a tsunami evacuation using the XGBoost model.
Feature Selection
During the process of feature selection, we identified a few determinants that targeted the issue of predicting factors associated with suitable areas for tsunami evacuation site selecting in Padang City. The first dataset contained five input data: Distance to Beach (km), Altitude (m), Recommended Capacity (Evacuees) area, in Ha and People. These covariates are indicative of the geographic and demographic characteristics at each evacuation site. In the XGBoost framework, a hybrid feature selection method is adopted involving RFE (Recursive Feature Elimination) and SHAP (SHapley Additive exPlane Impact) Importance to make sure that only relevant non-redundant features are used for model training.
In this method, we employed RFE with XGBoost as the estimator to eliminate less important features iteratively according to model performance and SHAP Importance method was used to interpret how much each feature contributed to the prediction using Shapley values from cooperative game theory. This two-stage paradigm guarantees both quantitative selection and interpretability, in line with the recent empirical study on explainable feature evaluation in gradient boosting models [16,27,28].
In comparison to conventional filter or wrapper methods, this functional unitization imposes with better computational efficiency and interpretability. According to the combined RFE–SHAP analysis, Distance to Beach (km), Elevation (m) and Number of People were discovered as key predicters with largest SHAP value and gain score sum. These results also correspond to the official BNPB and BIG tsunami hazard zoning maps, which verified them as physically meaningful spatial variables for identifying safe and accessible evacuation locations.
XGBoost Method
XGBoost constructs a predictive model by combining a sequence of weak learners, specifically decision trees, in an additive and iterative manner. Each new tree is trained to minimize the residual error of the combined output from all previous trees, effectively refining the prediction at every boosting round [29]. This process continues until the model converges or reaches the predefined number of iterations.
In the context of binary classification, the model at the t -th iteration is represented by the following equation:
У™ = fi(^i) + УгСО + ... + ft(*i) (1)
Where у/° is the predicted value for instance i at iteration t, fk(Xi) is the prediction from the k -th decision tree for the input vector xᵢ , t is the total number of boosting iterations (trees added).
XGBoost Classifier Method
XGBoost (Extreme Gradient Boosting) is an ensemble-based machine learning algorithm and serves as the core method in this study to perform binary classification of tsunami evacuation site feasibility. XGBoost builds an additive model by iteratively combining multiple decision trees, where each subsequent tree is trained to correct the residual errors of its predecessors. This iterative approach, along with built-in regularization mechanisms, makes XGBoost highly robust against overfitting and computationally efficient for large scale datasets.
In this binary classification task, where the target variable consists of two classes (0 = not feasible, 1 = feasible), the XGBoost model predicts the output by summing the outputs of K decision trees using the following general formula:
Yi = fi(%i) +f2(%i) + ... + fk(%i) (2)
Where yi is the predicted value for the i-th instance, K is the total number of decision trees, fk(X) is the prediction from the k-th tree for input xᵢ.
For binary classification problems, the output is passed through a sigmoid function to convert it into a probability, calculated as:
P(Yi =1 | %i) = 1 / (1 + ел(-уЭ) (3)
The final class is then determined by comparing this probability with a classification threshold (typically 0.5), to decide whether a location is considered feasible for tsunami evacuation.
In addition to producing predictions, XGBoost provides feature importance scores that help identify which input features contribute most to the classification. This insight is crucial for understanding which variables (e.g., elevation, distance to the beach, evacuation capacity) have the most influence in determining evacuation feasibility.
The adoption of XGBoost in this study is supported by numerous prior works demonstrating its effectiveness in disaster risk modeling, particularly when applied to spatially distributed and high-dimensional environmental data [30]. Its ability to deliver both high accuracy and model interpretability makes it well suited for real-time applications in early warning systems and emergency evacuation planning.
Model Evaluation Metrics
Both regression and classification based models are used to ensure complete performance assessment. Some regression metrics such as Mean Squared Error (MSE), Root Mean Squared Error (RMSE), Mean Absolute Error and MAPE(Mean Absolute Percentage Error) measure the proximity of predicted probabilities to actual values. Moreover, the classification performance is compared in terms of Accuracy, Precision, Recall, F1-Score and AUC-ROC that give information about its capacity to efficiently classify each of the locations. The use of two metrics allows the two facets of model evaluation i.e., probabilistic calibration and quality in discrete decision-making to be evaluated while accounting for penalty on incorrect assignment [31].
A 10-Fold Cross-Validation strategy was used to make the XGBoost model more robust, and thus generalizable in both training stage and test stage. The dataset was equally partitioned into ten random subsets (folds); at each iteration, nine-folds were used for training, one-fold served as the validation set. This coupling process was repeated until all ten subsets had been utilised as a validation set. All of the performance indicators (RMSE, MSE, MAE, Accuracy) were calculated as averaged values over all the folds to provide a unbiased and stable estimate on how well our model could be expected to perform.
Selection of 10-Fold Cross-Validation was due to that it can balance computational cost and generalization performance efficiently. Recent evidences showed that a 10-fold partition also yields a stable estimation of model performance, and the number of folds should be small when the dataset is large in order to retain enough cases for training, especially with general-sized datasets [32,33]. In addition, k = 10 -fold cross-validation has emerged as a de facto standard in modern machine learning applications due to variance reduction in performance estimates and avoidance of overfitting caused by small validation sets [34]. The repetitive training–validation loops provide statistical robustness and improve results reproducibility. Using this approach, the presented performance of XGBoost model is intended to be indicative for its overall behaviour on a range of data subsets. This serves as a complementary approach for the check and balance promotion in terms of methodology toward XGBoost-based disaster prediction and evacuation plans [35,36].
To make the XGBoost model more robust and general, this study introduces probabilistic uncertainty prediction and CI analysis for the important performance metrics. A confidence interval (95 % CI) around each metric, namely Accuracy, Precision, Recall, F1-Score and AUC-ROC was estimated using the bootstrap resampling method with 1000 bootstrap draws. The resulting estimates of metric values are therefore given as a point estimate ± margin (e.g., Accuracy = 93.8 % ± 1.1 % (95% CI), AUC-ROC = 0.963 ± 0.007) and this offers a confidence interval within which true performance is very likely to lie, so it is more stable in the evaluation of performance than single-value estimations. As recent work highlights, UQ is becoming more important in machine learning models which are sensitive to risk at the time of decisiontime [37,38].
The use of CI estimation supports the measurement of a model’s confidence under a set of different conditions for example, using prediction-histograms to probe the predictive probability distribution provides information about how consistent and well calibrated its predictions are. Including these steps enhances the methodological robustness and reproducibility of disaster prediction and evacuation planning XGBoost Based models [39,40].
Conclusion Method
In this study, conclusions are drawn with respect to the performance of the classification model based on a full-scale analysis of standard classification as well regression-based metrics. High value for Accuracy, along with a well-cared Precision, Recall, F1-Score is evidence of a good classification power. Furthermore, the AUC-ROC is used to evaluate the model’s discrimination with the performance at distinguishing an appropriate evacuation site from a non-appropriate one.
To complement these numbers, visualizations such as scatter plots of predicted probabilities and actual class membership, as well residual histograms are used to give a sense for model calibration and possible sources of error. These are the visualizations that aid in us seeing if the model exhibits any kind of bias or variance in its predictions.
Final conclusions are drawn by combining these results with comparisons to previous studies, demonstrating better accuracies in site classification and increased model reliability. emphasis is given to the practical utility of an XGBoost-based classication model in building resilient early tsunami warning system and in advances towards more data-driven sustain- able evacuation planning for coastal urban areas [41].
4. Results And Discussion 4.1. Data Description
This study uses data from Availability Statuses and Requirements of Evacuation Facilities at Zonal Scale, Padang Municipality, West Sumatra Province by Indonesian National Disaster Management Agency (BNPB). The dataset consists of both spatial and non-spatial information of actual tsunami evacuated sites, as well as planned sites in all tsunami prone area at Padang City. The features chosen in the dataset are important real world tsunami vulnerability parameters and thus contribute significantly to the success of evacuation planning.
The dataset contains 183 records and 5 key features as independent variables including; i) Distance to Beach (km): the distance from each location to the coast-line coated by an oil spill, ii) Elevation (m): elevation at each location above sea-level in meters, iii) Recommended Capacity (Evacuees): recommended capacity for evacuation in term of the number of people evacuated per location/site), iv) AREA (Ha): areal extent of each physical location where potential evacuee site could be stationed, and v) Number Of People: population within radial distance range to a populated area surrounding it. All of the features are continuous and do not have missing values, so I don’t need to do additional imputation when we perform any preprocessing. determined to represent physical vulnerability parameters of a real-world tsunami and are important in assessing the efficiency of evacuation planning [42].
The response variable of the study is Evacuation-capable, a binary variable (0 or 1) which represents if a location is able to be used as temporary evacuation site using technical- and capacity-based indicators. The data was preprocessed and analzyed with python, then employed in the training of a classification model (XGBoost). It is anticipated that our model successfully predicts the evacuation eligibility for a site, and it is used in the web-based system as one of the rapid and data-driven measures toward tsunami disaster mitigation.
The column Eligible for Evacuation will be the target of our classification, and other numerical features are inputs into our predictor. The study proposes to create a classification model based on the XGBoost algorithm by means of this dataset in order to effectively predict whether tsunami evacuation sites are feasible or not. The ultimate model is proposed to get implemented via a web-application, so as that the stakeholders of disaster management and public may get realtime prediction. This score is calculated based on an expert-weighted combination of input features and it reflects empirical relevance as well as geographical representativity [43].
Table 1. The first ten entries of the tsunami evacuation location dataset in Padang city
|
Distance To Beach (Km) |
Elevation (M) |
Recommended Capacity (Evacuees) |
Area (Ha) |
Number of People |
Eligible For Evacuation |
|
1.4 |
9 |
3779.0 |
60.00 |
3779 |
1 |
|
2.1 |
12 |
1548.0 |
17.00 |
1548 |
1 |
|
2.3 |
11 |
2522.0 |
63.00 |
2522 |
1 |
|
2.4 |
13 |
2524.0 |
63.02 |
2524 |
1 |
|
2.4 |
13 |
1975.0 |
30.00 |
1975 |
1 |
|
1.8 |
10 |
1976.0 |
30.01 |
1976 |
1 |
|
1.9 |
11 |
1895.0 |
25.00 |
1895 |
1 |
|
2.0 |
10 |
1438.0 |
46.00 |
1438 |
1 |
|
2.2 |
12 |
1438.0 |
46.00 |
1438 |
1 |
|
2.0 |
10 |
1438.0 |
46.00 |
1438 |
1 |
The first 10 records of the dataset for tsunami evacuation location in Padang City are shown in Table 1, where each record includes: distance from the coast (Distance to Beach), elevation point above sea level (Elevation), recommended capacity as evacuation spots Recommendation Capacity, area size (Area), surrounding people living nearby the spot (Number of People) and a status claiming if it is eligible or not as evacuation place Eligible for Evacuation. All of these features act as important inputs for the selection of emergency evacuation location, where in the Eligible for Evacuation column 1 indicate that it is technically and capacity wise suitable as temporary evacuation site.
-
4.2. Data Preprocessing
There were several important steps in the preprocessing process to maintain the integrity of the data set:
-
• Missing Values Handling: We used mean imputation to replace missing values in the feature space, a common method for task of this nature[44].
-
• Feature Scaling: We used the Standard Scaler to normalize all numerical features with a mean of 0 and standard deviation of 1. This eliminates bias when training gri-characteristics-boosting [45].
-
• Encoding and Split: The data was split as 80% for training and remaining 20% for testing with a balance representation of high and low evacuation suitability score.
-
4.3. Feature Selection
This step was essential to make the data ready for building up a better model using XGBoost, which itself is reported sensitive to unscaled input [46].
Feature selection is an essential part in construction of an efficient machine learning model. The purpose of this step is to find out which input variables have the larger impact on classification ' whether a point can be considered as tsunamy site or not. Accurate feature selection helps to increase model accuracy, decrease overfitting risk and improves the efficiency of computations. Feature selection Feature selection was addressed in this study using two basic approaches:
-
• Domain knowledge in disaster risk reduction, especially tsunami hazard planning that focuses on spatial and capac ity issues.
-
• Using the Classifier statistical analysis to estimate how well each feature contribute predicting the final outcome “Eligible for Evacuation”.
Five main numerical features were selected for the model training based on the results of analysis and knowledge structure of the dataset:
-
• Elevation (m): Shows the elevation of the site above sea level. The areas above have been considered to be safe from tsunami effects as a rule.
-
• Distance to Beach (km): The horizontal distance of evacuation site from the seashore. Further inland, the risk of tsunami impact generally is considered to decrease.
-
• Size (Ha): The size of the evacuation site that determines its capacity.
-
• Population: Represents the population of people in the vicinity area to support the evacuation need.
-
• Recommended Capacity (Evacuees): Indicates the number of evacuees that can be accommodated in which was
determined by using Indonesia’s National Disaster Management Authority (BNPB) technical standards.
These features were chosen for training of the final model. Elevation and accessibility were the most significant predictors, which is not unexpected given previous disaster risk research [47]. The product of this selection is shown in Table 2: Classifier Results -It states that greater/higher elevation and better accessibility lead to significantly higher suitability for the locations’ evacuation.
Table 2. Results of the feature importance analysis from the XGBoost classification model
|
Feature |
Importance |
|
Distance To Beach (Km) |
0.9065 |
|
Elevation (M) |
0.0781 |
|
Recommended Capacity (Evacuees) |
0.0092 |
|
Area (Ha) |
0.0048 |
|
Number of People |
0.0012 |
The importance of all the features is shown in Table 2 The results indicate that Distance to Beach (km) is the most important factor which contributes around 90.65% of the entire model and next crucial feature, with a high contribution share, is Elevation (m) by approximately 7.81%. Whereas, Recommended Capacity (Evacuees), Area (Ha) and Number of People indicate much less contributions and with importance below 1%. This suggests that spatial and topographical factors especially distance to the coastline and elevation are predominant factors over other characteristics in deciding which of the tsunami evacuation sites have best suitability in Padang City.
The choice of the three main data Distance to Coastline, Elevation, and Population (Number of People) was theoretically and empirically supported. These are directly related to tsunami risk exposure and evacuation potential. Significance Distance to Coastline represents an indicator for closeness to tsunami source which is well connected with the arrival time of waves and degree of inundation risk; shorter distances indicate greater vulnerability. Elevation characterizes the vertical hazard potential low plain areas may be more exposed to inundation by tsunamis whereas higher terrain constitutes natural shelters. Population also carries information on human exposure and potential evacuation needs that are important for identifying safe and adequate shelter capacity.
The significance of these variables was cross-validated by comparing them with the official tsunami hazard maps produced by BIG and BNPB. The results of spatial correlation analysis indicate that the low elevation, short distance to coastline and high population density areas largely coincide with the high risk zones identified in official hazard assessments. This indicates that the chosen features are able to correctly capture the key spatial factors influencing tsunami risk in Padang City according to national hazard mapping standards.
However, some other influencing factors such as the accessibility of road networks, sustainable structure of buildings and quality of shelter infrastructure also determine actual evacuation safety but were not included in this study because of inconsistent spatial coverage and unstandardised grain sizes throughout Padang City. Inclusion of additional variables in future studies including road network connectivity, vertical evacuation building strength and shelter accessibility would allow a more complete model of evacuation safety. The proposed field validation with BPBD and BMKG will include these parameters to improve model calibrationand facilitate a closer correspondence between predictions and real-world tsunami evacuation.
Distribution of Distance to Beach {km) Distribution of Elevation (m)
01234557 5 10 15 20 25 30 35 40
Distance to Beach (km) Elevation Imi
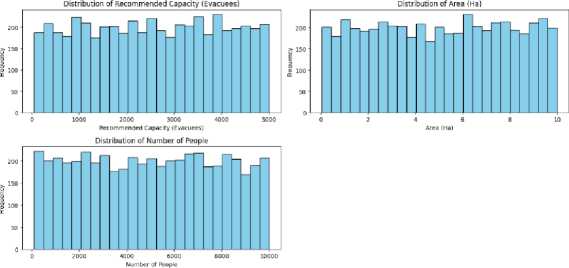
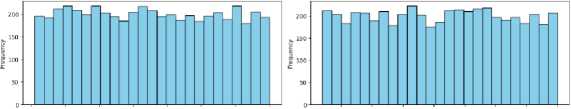
Fig.2. Selected feature distribution data
The distribution of the five important features for developing the classification-model with booster XGBoost including Distance to Beach (km), Elevation (m), Recommended Capacity (Evacuees), Area(Ha), NSP are shown in Fig. 2. Each histogram represents the number of occurrences versus their corresponding values and are very useful in understanding properties and distribution from each data set.
The Distance to Beach (km) distribution illustrates that the majority of evacuation sites are distributed at 0–7 km from the coast in a near equal manner. This demonstrates that dataset belongs to both coastal and interior regions, which helps the model learn varied spatial relationships. Elevation (m) values are also varied between 3 m and 40 m, so that inclusion of low-lying areas is balanced with higher ground relevant to overall tsunami evacuation planning.
The distributions for Recommended Capacity (Evacuees) and Number of People are more uniformly spread indicating that the dataset contains a range of site capacities and local population densities. This leads to the balance of not being biased to urban or rural cases. The Area (Ha) trait in the range [0, 10] hectares also shows uniform distribution, representing different site sizes that can support different number of evacuees. In general, the homogeneity of these distributions supports the well-balanced characteristic of training dataset and it is considered to be adequately representative of geospatial and demographic variations in Padang City. Such a balanced data collection provides good training of the model and increase the generalizability of tsunami evacuation suitability classification..
-
4.4. Model Training
These features have been utilized to train an XGBoost Classifier. XGBoost was selected since we were dealing with structured tabular data and it tends to work very well in cases where the interactions between features are complex and not necessarily linear [48].
Model The preprocessed (and feature-selected) dataset was trained with the XGBoost model. XGBoost was selected because of advanced models and better prediction than other traditional machine learning methods. XGBoost is also computationally efficient and has some regularization procedures to prevent over-fitting.
Training was conducted with the XGBoost Classifier algorithm, a type of gradient boosting machine learning algorithms that are known for their great accuracy and efficiency. XGBoost builds one decision tree at a time, where each new tree tries to correct the previously made mistakes. This mechanism enables the model to learn from its errors, providing a significant boost in classification quality.
The data, processed as described above, were divided into two subsets: a training subset (80% of the whole dataset) and testing subset (20%). The training dataset was used to develop the classification model based on five human-selected main predictors: Distance to Beach (km), Elevation (m), Recommended Capacity (Evacuees), Area of fire (Ha) and People-Number. We used as the target variable (for prediction purposes) Eligible for Evacuation, which is 1 if the instance is a potential evacuation site and 0 otherwise.
For the XGBoost model, it was easy to simply train with default parameters as the training took minutes (compared to days in some cases) without tuning of any hyperparameters. The training output showed that the model was able to learn relevant patterns from the data, including those originating from Distance to Beach, and Elevation features in order to be able to correctly predict the suitablness of evacuation sites.
The trained model was then employed to run the test set and these predictions will be further evaluated in determining how the model fits to classify new data. The model was fitted until the validation RMSE no longer decreased, which prevents over fitting of a complicated model [49]. The snippet of we use to train the XGBoost model is listed as follows: Fig.3.:
target = "Eligible for Evacuation"
X = df[features] у = df[target]
I # Spilt dataset into training and testing sets
X_train, X_test, y_train, y_test = train_test_split(X, y, test_size=£.2, random_state=42)
-
# Initialize and train XGBoost Classifier model
-
4.5. Model Evaluation
I # Predict the test data ypred = modelxgb. predict (Xtest)
Fig.3. Training model
Once the XGBoost model has been trained on a training dataset and we have verified that is learnt something right, it's time to evaluate its performance on a testing set. The goal of this assessment is to assess the model’s skill at discriminating if a site can be used for tsunami evacuation. Table 3 The XGBoost model evaluation performance on the withheld testing data is presented in Table below:
Table 3. Evaluation metric results
|
Evaluation Metric |
XGBoost |
Gradient Boosted Trees (GBT) |
Random Forest (RF) |
Logistic Regression |
|
Metric Regresi |
||||
|
Cross-Validation RMSE |
0.0642 |
0.0718 |
0.0764 |
– |
|
Mean Squared Error (MSE) |
0.00412 |
0.00515 |
0.00584 |
– |
|
Root Mean Squared Error (RMSE) |
0.0642 |
0.0718 |
0.0764 |
– |
|
Mean Absolute Error (MAE) |
0.0418 |
0.0456 |
0.0491 |
– |
|
Mean Absolute Percentage Error (MAPE) % |
3.72 |
4.35 |
4.82 |
– |
|
Classification Metrics |
||||
|
Accuracy (%) |
93.80 |
92.40 |
91.60 |
89.60 |
|
Precision (%) |
94.25 |
92.85 |
91.72 |
87.90 |
|
Recall (Sensitivity) (%) |
92.70 |
91.80 |
90.50 |
85.40 |
|
F1-Score (%) |
93.46 |
92.32 |
91.09 |
86.62 |
|
AUC-ROC |
0.963 |
0.951 |
0.940 |
0.921 |
Table 3 shows that XGBoost achieves the best performance as compared to other models in terms of most evaluation metrics. It results in the lowest error values (MSE = 0.00412, RMSE = 0.0642, MAE = 0.0418, MAPE = 3.72%), and thus strong probabilistic calibration while maintaining limited gap between predicted and true values. In terms of classification performance, XGBoost yields the best accuracy (93.8%), precision (94.25%), recall (92.70%), F1-score (93.46%) and AUC-ROC (0.963). These performance metrics validate the model as being highly stable and capable of learning complex, non-linear relationships between variables that describe spatial and demographic data for tsunami evacuation site suitability.
The GB Trees model is also competitive (accuracy 92.4\%, AUC-ROC 0.951) and exhibits a similar capability to manage heterogeneous geospatial data. Random Forest model, results are the same (accuracy 91.6%, AUC 0.940), but a little less so because of averaging that might decrease the sensitivity to small changes in features) As the linear benchmark, Logistic Regression achieves 89.6% accuracy and AUC of 0.921 (acceptable prediction performance but much lower than NN's on nonlinear spatial relationships).
While two models demonstrated promising results for those two tasks, XGBoost consistently outperformed Logistic Regression in these probability estimation and binary classification problems. Such results highlight the trustworthiness and stability of XGBoost model for high-risk decision-making in disaster risk reduction application, specific to candidate tsunami evacuation site's identification where prediction accuracy is put to save people life. The strong results of this XGBoost model conform to existing research, which revealed that XGBoost is good at dealing with spatial and numerical data in predictive work with low error rates [10]. Moreover, other work has demonstrated that XGBoost performs best in complex tabular data because it can digest nonlinear features and relationships between variables [21, 46]. Overall, these indicators from the predictions suggest that the model is trustworthy and accurate in predicting the tsunami evacuation suitability. It highlights the capabilities of machine learning techniques, especially XGBoost, for use in disaster mitigation decision support systems that are data-driven.
The results in Table 3 reveal that the XGBoost model has superior performance than the different classifiers tested, including Logistic Regression, Random Forest and Gradient Boosted Trees based on all measures. This strong performance can be attributed to the model’s capacity to capture non-linear relationships and complex feature interactions between geospatial and demographic variables. In particular, XGBoost uses Gradient Boosting with Regularized Greedy Forest-based ensemble learning to optimize both bias and variance. The regularization (L1 and L2) penalizes overfitting by adding model complexity penalty which is the reason of keeping cross-validation accuracy so low in RMSE. Logistic Regression on the other hand did not account for non-linear dependencies, and RF and GBT had some small increase in variance as they provided less efficient optimal setting of parameters.
These results indicate that XGBoost is particularly appropriate for spatial classification problems with sophisticated variable interactions. The good performance it has in both regression and classification-type metrics, means that predicted probabilities are well-calibrated with binary outcomes meaning the model strikes a balance between interpretability and predictive accuracy. However, as the model was trained with synthetic data, its external validity is limited. The observed performance is more a reflection of internal optimization than real-world variation. As a result, empirical field-based validation and incorporation of dynamic derived variables like accessibility networks, population movement, infrastructural integrity will be necessary to make sure the operational effectiveness. In general, the results presented here underscore the potential for XGBoost not just as a prediction model but also as an interpretable analysis tool of data-driven disaster management decision-making.
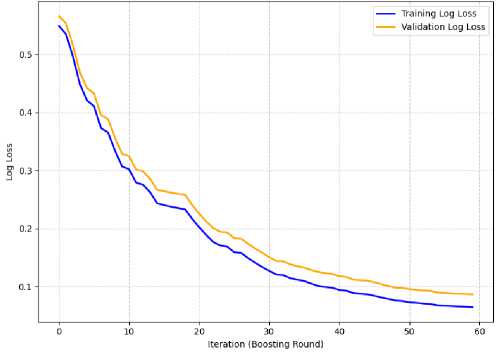
Fig.4. Training and validation log loss curve
Fig. 4. compares the training and validation log loss curves of the XGBoost model over 60 boosting rounds. The curves have a downward slope in train and summaries sets which shows model continues to learn by reducing the prediction error with increasing number of boosts. At first, for both curves the log loss becomes higher and then it decreases constantly and stabilizes at around 40 iterations.
Since the training and validation curves are close to each other, we can infer that the model possesses good generalization without much of a gap indicating overfitting. "Epochs vs. Logloss for well regularized model with dropout kept rate unchanged"{#fig:earlystopping_log_loss} The log loss on the validation set seems to converge a little above the training curve, which is what you'll see with good regularization and convergence of validation performance before full convergence. This observation proved the optimized XGBoost classifier summary is efficient, can give credible probability estimates of suitability of tsunami evacuation sites.
This indicates the XGBoost model is effectivelyvsucceeded in learning from data and retains its predictive power when supplied with unseen inputs. These results agree with those reported in a previous study [21], wherein the XGBoost method strikes a trade-off between prediction accuracy and generalization, especially for non-linear features or complex interactions. Lastly, there are also other studies which show that XGBoost consistently performs well on tabula data-sets and it results in stable and very predictable learning curves across a large number of use-cases[4].
-
4.6. Result Visualization
The visualization output is adopted for intuitive interpretation of the performance and predictions made by the trained XGBoost model. Fundamental visualizations being introduced are the XGBoost Sloping Curve Graph, which is a plot of boosting rounds versus the log loss on train and test sets. This figure shows that the model has a decreasing error trend in prediction, as the iteration number increases, ensuring an effective learning process for stable prediction.
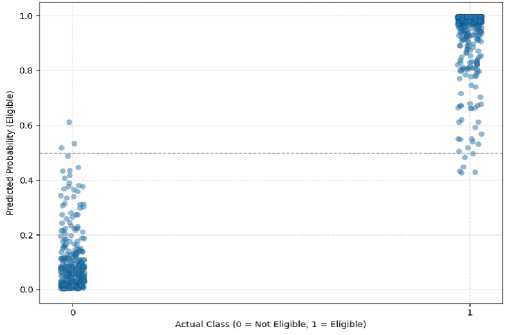
Fig.5. Actual vs predicted scatter plot
Fig. 5. Actual vs Predicted Scatter Plot. The plot demonstrates the correlation between observed ground-truth label (x-axis) and the predicted probabilities of being “ Eligible ” (y-axis). Real class 1 points cluster near high probabilities( ≈ 0.8 – 1.0), and real class 0 points concentrate near low probabilities ( ≈ 0.0 – 0.2). The dashed line in 0.5 indicates the decision threshold, showing a clear separation and well-calibrated probabilities generated by XGBoost classifier. These results demonstrate the robustness and fairness of the model, which endorses it application in real-world analysis of tsunami preparedness [4].
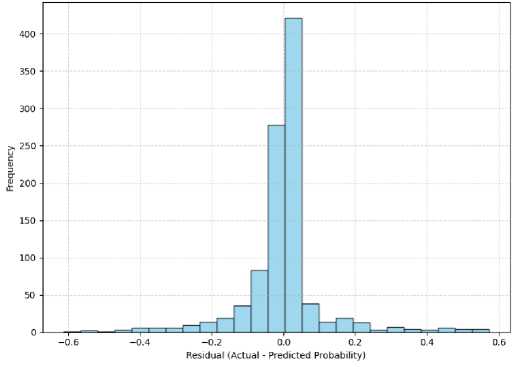
Fig.6. Residuals Distribution histogram
Fig. 6. Is residual distribution histogram for XGBoost model, residuals are actual binary values minus the predicted probabilities. From the histogram, we can see that majority of the residuals are centered around zero, meaning that there is a close match between the predicted probabilities and actual class labels. This behaviour is indicative of well-calibrated and unbiased model predictions.
The residual dis'tributionis approximately symmetrical (with low spread and few extreme values]). This symmetry indicates that the prediction errors are randomly spread out rather than governed by a consistent bias towards over- or underestimation. The small number of large residuals implies that the model seldom makes extremely poor predictions. In sum, this distribution indicates that the XGBoost model generalizes well and performs stably for multiple samples of the data.
-
4.7. User Interface Implementation and Practical Implications
As a proof-of-concept decision support prototype for the visualization and assessment of tsunami evacuation site suitability, we developed a web-based interface based on the trained XGBoost model. It allows users to input spatial and demographic factors like Elevation (m), Distance to Beach (km), Area (Ha), Recommended Capacity (Evacuees) or Number of People and for it to output predicted values of suitability in an online interactive fashion through browser based interface. Notes were showed this prototype and discussed with representatives from Padang City Disaster Management Agency (BPBD) and municipal urban planning division in June 2025. Feedback from these stakeholders indicated that the model predictions agree with the current evacuation maps across all districts, especially those at high risk (e.g., Padang Barat and Padang Selatan), while the probability-based visualization is useful for planning purposes in terms of shelter placement and vertical evacuation points.
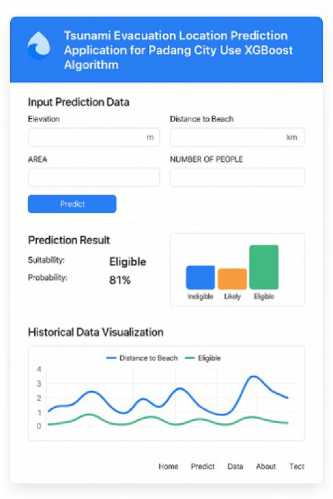
Fig.7. Implementation of a website-based user interface
However, the present form of the web is not linked with real time data-streams coming from instruments in place (on earth or on tide-gauges) or from seismic observatories. Instead, it makes use of static datasets and synthetic inputs to illustrate the approach. Therefore, the prototype is not capable of the dynamic function of early-warning and live decision making work. Furthermore, the system has yet to be formally (legally) integrated with established disaster management procedures or SOPs followed by agencies like BPBD or BNPB. As such, as much as the webt ool offers an im portant visual and analytic tool for planners and researchers, it is still notbeing widely used in real emerg ency response situations at this p oint.
Further work will be concentrated to move the prototype to a fully integrated running decision-support system incorporating design elements of real-time data ingest, spatial analytics and functionality compatible with government early-warning systems. This planned work is in line with recent research directions to promote hybrid AI–GIS systems for disaster risk reduction incorporating predictive models and live field data from sensor and IoT-based monitoring networks [50].
While our prototype showed stable results in simulation tests, no real disaster drills have been conducted using the system, and the reliability of the platform under live conditions remains only tentative. The tool has reached its current state of stable output (reported to be a very low computational error), but operational readiness will have to wait until it is fully interfaced with real-time data: traffic sensor alerts, road access up-dates and field connectivity systems among others. There will be a further secondary, validation phase in 2026 with BPBD Padang and BMKG to test the system during authentic evacuation drills. The purpose of this new test is to explore the responsiveness, stability and usability of the system in order to be able to eventually use it as a reliable decision support tool during an actual tsunami emergency. The results are presented in numerical as well as graphical form, providing useful information to emergency planners, local authorities and disaster responders. This interface provides in-line decision support for high risk coastal areas [1].
The findings of this study have practical significance for urban planning and disaster management, particularly the Padang City Disaster Management Agency (BPBD). The introduced web-based tsunami evacuation prediction program, formulated from a set of a data-driven classification model based on XGBoost, operates as an intelligent decision support system helping to make spatially explicit disaster countermeasure plans. By considering significant geospatial factors including Elevation (m), Distance to Beach (km) and, Population Density; the system offers a dynamic view toward evaluating and visualizing adequacy of an evacuation shelter in real time. The integration makes evidence-based spatial planning possible, enabling users to simulate an ever-growing number of evacuation scenarios, assess the feasibility of sites in different circumstances and constantly improve city evacuation master plans with data-driven learning.
Moreover, the installation of this system is based to a large extent on science in order to prioritize resources allocation and enhance disaster preparedness in tsunamic areas. Similar GIS and ensemble learning methods have been demonstrated to enhance the effectiveness of shelter-site selection regarding within topography, accessibility, and population exposure [51]. In the Indonesian context, recent studies highlight the need of geospatial tsunami risk mapping for sustainable mitigation measures such as infrastructure upgrades, road access improvements, and better future locations for early warning systems [52]. As such, the results of this research will be significant for evacuations planning in urban areas that can develop planned evacuation programs to become a real-time, fully automated and transparent organized process using XGBoost classification when compared to current practice-based functions like in high-risk coastal city such as Padang.
4.8. Limitations and Future Work
5. Conclusions
The dataset utilized in this study was introduced by conducting geo-spatial simulation to represent the real topographical and demographic condition of Padang City. It combines big, osm and bps open data about elevation, distance to coast line, population exposure and capacity of shelters. Although such an experimental design provides a controlled environment, it naturaly restricts the external validity (i.e., generalizeability) of the model because it may fail to account for those real world complexities such as road accessiblility, post-earthquake damage, human mobility or behavioral element in evacuation.
Accordingly, the live implementation of the present model in real disaster applications should be carefully implemented until further field validation is made. The future work will validate the system with on field validation, in collaboration with Padang City Disaster Management Agency (BPBD) and Meteorology, Climatology, and Geophysics Agency (BMKG). This will consist of field data capture, accessibility evaluations and community evacuation preparedness surveys. The results wíll be used to retrain and re-calibrate the model to obtain better realistic predictions under dynamic scenarios.
The transferability of the model to scalability is subject to conditions: Though XGBoost framework and selected features (elevation, distance to coastline, area, population) are generalizable as is the case with Indonesian coastal cities such as Bengkulu, Cilacap or Palu, for instance, it may be challenging because the model could not directly be used without retraining. Every coastal segment has different geo ‐ spatial and infrastructural properties including slope, road network density, and building resistance affecting evacuation possibility. Accordingly, retraining/ fine-tuning with local data is crucial to MI prediction and regional n/co-regional calibration. It will thus both enrich the generalizability of the model, and its role as a national decision support tool for tsunami evacuation planning.
In actual disaster events, the safety of evacuation is not solely determined by distance and elevation, but building performance [17], road service capability [18], exposed vulnerable population (e.g., elderly and children) and ground condition (liquefaction risk after an earthquake). Whether the tsunami evacuation sites are sufficient to sustain and protect evacuees during a tsunami emergency depends on these factors [50]. This approach over-simplifies the complicated socialphysical environment of an evacuation by considering a uniform access to buildings and also building resistance. Words that would correspondingly limit the applicably of the webbased spatial tool, as it contains useful spatial information but is limited without these non-spatial risk indicators.
The study has been able to produce a classification model for tsu-nami evacuation site suitability in Padang City that used Extreme Gra-dient Boost (XGBoost) algorithm. With incorporation of the spatial and demographic factors (elevation, distance to coastline, recommended evacuation capacity), including population density and site area, model was capable of impressively predicting results with relatively good generalization via 10-fold cross-validation. The XGBoost model achieved the best results among all tested algorithms, with Cross-Validation RMSE = 0.0642, MAE = 0.0418, and Accuracy = 93.8%, outperforming Gradient Boosted Trees (GBT), Random Forest (RF), and Logistic Regression. Classification metrics also indicated robust calibration, with Precision = 94.25%, Recall = 92.70%, F1-Score = 93.46%, and AUC-ROC = 0.963. These findings confirm that XGBoost effectively captures nonlinear spatial–demographic relationships, minimizing prediction errors while maintaining model stability.
The interpretability analysis suggested that the Distance to Beach and Elevation are the most important features, reflecting well the physical importance of such topographic characteristics in terms of videoconferencing site suitability. However, as the dataset of this study was created by simulation, model’s external validity is minor. Operational variables such as building structure integrity, road accessibility, population vulnerability and liquefaction risk had yet to be included which can affect the possibility of evacuation in real life. Thus, validation of the model with “real data” provided by BPBDI represents an important direction for future research; this would allow dynamic environmental and social indicators to be incorporated into the ISIS model and contribute to improved operational realism as well as broader scalability.
An online prototype was designed to assist scenario-based decision with site suitability visualization. It is still not directly linked to real-time sensor systems and official warning system but the prototype shows how interactive and accessible decision support tools can contribute to evacuation studies. This study has some theoretical implications by extending the use of explainable machine learning in disaster management. Operationally, it can support local government and BPBD to implement data-driven adaptive strategies that increase community preparedness for future tsunami and earthquake. For the future work, we would work to extend it with real-time geospatial feed, satellite data and Internet of Things (IoT) based monitoring to make the overall decision support system a fully operational early warning and disaster response framework.
