Decision support system of fulfillment the number of lecturers based on dikti form using expert system approach

Author: Azhari. Ali Ridha., Sulistyo Puspitodjati
Journal: International Journal of Modern Education and Computer Science @ijmecs
Article in issue: 12 vol.10, 2018.
Free access
Assessment of education is the standardization imposed by the government to be followed by all universities in Indonesia. Fulfillment of national standards of education aims to ensure quality higher education practices and the quality of its graduates, One of the education practices assessment are assessment of the ratio of lecturers to students. This study aims to help the managerial prepare lecturers to facilitate the process of education and the accreditation process to be faced. Model used with expert system for its inferencing engine with the help of ARIMA forecasting algorithm to predict until the period of accreditation, Forecasting results show the model (1,1,0) which is eligible for prediction.
Decision support system, ARIMA, Expert System, Human Resource
Short address: https://sciup.org/15016813
IDR: 15016813 | DOI: 10.5815/ijmecs.2018.12.02
Text of the scientific article Decision support system of fulfillment the number of lecturers based on dikti form using expert system approach
Published Online December 2018 in MECS DOI: 10.5815/ijmecs.2018.12.02
The problem of decision making is basically a form of selection of various alternative actions that may be chosen which process through a particular mechanism, with the hope that it will produce the best decision. Computer-based information systems are needed, especially in the development of an organization, in this case a university. The fulfillment of the number of lecturers can be done, but this kind of handling will experience many obstacles, especially in terms of accuracy, to be able to overcome it, another system that can handle it is needed to obtain the right and fast information and can overcome the difficulties in managing manually.
As with a higher managerial level, in the process of Universitas Singaperbangsa (UNSIKA) which was established on February 2, 1982, has a vision to become a university that is competitive at the national level in 2020. then the University of Singaperbangsa (UNSIKA) continues to strive to improve the quality of graduates so that they can be competitive. For this reason the
University of Singaperbangsa (UNSIKA) seeks to comply with and fulfill whatever has been outlined by BAN PT to obtain and improve the quality of graduates. Universitas Singaperbangsa (UNSIKA) which has 8 faculties, 2 Post Graduate Programs, 18 study programs has a number of students> 10,000 students. Informatics Engineering study program which was established on June 25, 2008 Based on the regulations on the implementation of higher education, including:
-
1) Letter of the Director General of Higher Education No. 2920/2007 concerning capacity
-
2) Higher Education Law No. 12 of 2012
-
3) Government Regulation Number 4 of 2014 concerning Implementation of Higher Education
-
4) Minister of Education and Culture Regulation No. 49 of 2014 concerning National Standards for Higher Education the ratio of lecturers / students is 1:25 in general, and updated in 2010 to Science 1:30, and Social 1:45.
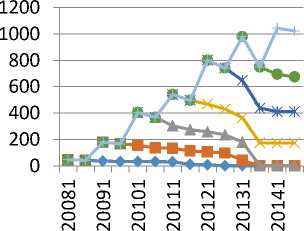
Universitas Singaperbangsa Karawang whose status has changed from private universities to state universities face the problem of the availability of lecturers and lecture halls. Of course the change in status from private universities to state universities raises several problems that must be solved, including the problem of availability of lecture halls and lecturers. The growth of the number of students also grew rapidly along with the change in the status of the Singaperbangsa Karawang university. The following is a graph of the number of FASILKOM students at Universitas Singaperbangsa Karawang.
Changes in the status of Universitas Singaperbangsa from the private sector to state University influenced graduates of the high School and Vocational High School especially in the West Java region to register and enter the Singaperbangsa karawang University. The increase in the number of prospective students who want to enter UNSIKA must of course be balanced with the fulfillment of the number of Lecturers and Classrooms in order to fulfill the requirements outlined in the Higher Education Form. The following is the number of permanent and non-permanent lecturers at the Fasilkom Universitas Singaperbangsa Karawang.
—•— 2013
—*— 2010
—2009
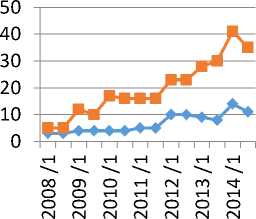
— ■ —dosen lb
— ♦ —dosen tetap
Fig.2. Total Lecturer Fasilkom UNSIKA
The development of fluctuations in the number of lecturers in Fasilkom for their fulfillment must be considered with the number of students and the managerial level that must be taken into account.
Fig.1. Student growth chart for Fasilkom Unsika
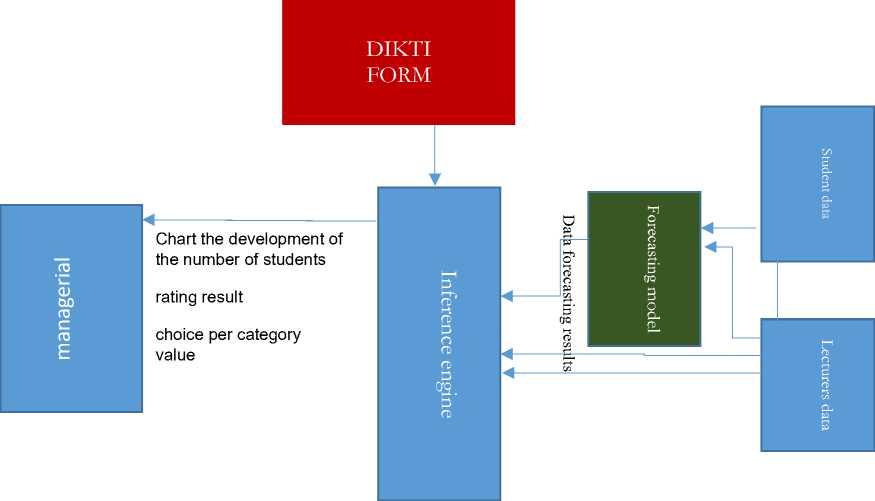
Fig.3. Decision support system for the fulfillment of lecturer
Fig.4. Types of SPK
Figure 3 divided into 3 parts of data, inference engine and managerial display to be used as managerial steps when facing accreditation assessment from the agency Steven L. Alter, at that time a doctoral student at MIT, based on the framework of Gory and Scott Morton conducted a study of 56 decision support systems. This research allows developing a taxonomy and six types of SPK based on the level of problem solving support. The six types are shown in Figure 4.
-
II. Proposed Methedology
The research design of the number of lecturers' decision support system is based on the forms assessed by the Jenkins box method that will be carried out by the researcher as illustrated as in Figure 3.
In this study will be carried out in several stages in the implementation of which.
Data Collection Process
In this study, accurate data and information can support the research process. Some data collection methods in this study are::
-
1) Literature Study
By conducting a study of expert systems, the box jenkins method and form assessment criteria through literature such as journals, books, scientific sources obtained from the internet with topics related to it.
-
2) Interview
Direct interviews with experts on issues taken to obtain accurate data regarding the assessment of the Higher Education Form. The interview process is carried out by conducting question and answer with experts and experts giving the value of the criteria contained in the forms.
-
III. Results and Discussion
Needs Analysis
In a study forecasting applications meeting the needs of lecturers on the course, using the linear sequential development methods, while the stages are Information System Modeling Is the initial stage in the linear sequential model in which the model will be divided into 2 things

Head of study
|
The Head of Study examines the desired item |
Collecting tiie number of active students on the semester |
Gather the number of permanent lecturers in the semester |
process each criterion accreditation forms |
Being in the assessment of how much for this form, the rating is divided into 4,3,2,1 |
|
In this study is devoted to the needs of lecturers, namely in point 4.3.1 |
Fig.5. System running
Analysis system runs
Accreditation preparation system that is running in Fasilkom UNSIKA can be seen in the picture below
-
1) . Problem Analysis
Analyzing the problem or obstacle experienced by the object of research is by observing the problems for the obstacles that occur when facing the evaluation of accreditation, the analysis is Problems on the head majors
The problems experienced by the head majors are when they will face accreditation assessment when the head majors wants certain grades according to the form in terms of lecturers' needs, the study program head has difficulty determining the number of lecturers in accordance with what should be needed at the teacher's point because the number of students is dynamic per semester
-
2) . Needs Analysis
After analyzing the problems of the users then needed by the user, i.e :
-
a. The information will be given a forecast conditions at the time the student will be accredited
-
b. Expert systems will provide the service conditions of students who must possess at the time of the accreditation assessment
-
c. References in making the proposed addition or subtraction HR lecturers in the study program.
Description of Initial System Functions
Decision support systems meet the needs of lecturers to help users prepare for the optimal number of lecturers in Higher Education borang assessment, in consultation function will display the amounts that should be prepared by the user to achieve the value in standardized by Higher Education.
Knowledge base consists of two basic elements, namely facts and rules. In this case enter the facts required by the system. In this study focused on HR lecturers where the lecturers are divided into several more criteria, namely permanent lecturers (Dt)
Table 1. Standard Accreditation forms
|
point 1 : |
• If KD 1 ≥ 90%, then score = 4. |
|
|
• If 30% < KD 1 <; 90%, then score = (20 x KD 1 / 3) – 2. |
||
|
• If KD 1 ≤ 30%, then score = 0. |
||
|
point 2 : |
= 4.
= 2+ 5 x KD 2 . |
|
|
point 3 |
• If KD 3 ≥ 40%, then score = 4 |
|
|
• If KD 3 < 40%, then score = 1+7.5 x KD 3 |
||
|
point 4 |
• If KD 4 ≥ 40%, then score = 4 |
|
|
• If KD 4 < 40%, then score = 1+7.5 x KD 3. |
||
|
point 5 (science) |
• If 17 ≤ R MD ≤ 23, then score = 4. |
|
|
• If 23 < R MD < 60, then score = 4 x (60 - R MD ) / 37. Jika R MD < 17, then score = 4 x R MD / 17. |
||
|
• |
Jika R MD ≥ 60, then score = 0. |
|
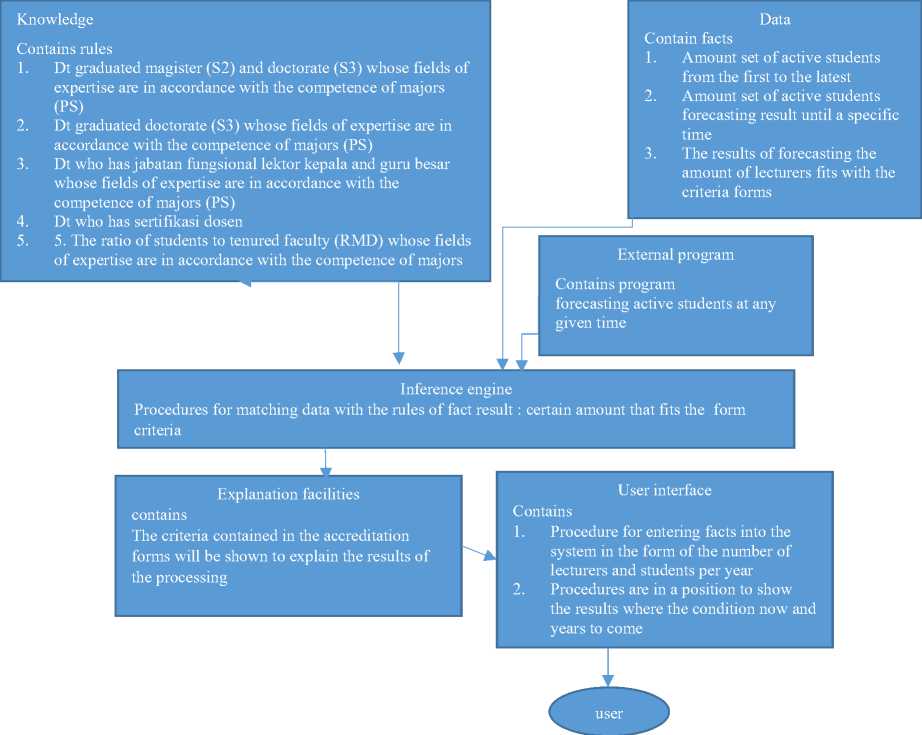
Fig.6. proposed expert system
Non-permanent lecturers (dtt) in the assessment point there are rules that are used as a reference
-
1. Dt graduates master degree and doctorate degree whose expertise is in accordance with the Major competence (KD1)
-
2. Dt doctorate degree whose expertise is in accordance with the Major competence (KD2)
-
3. Dt who has jabatan fungsional lektor kepala above (KD3)
-
4. Dt has sertfikasi dosen (KD4)
-
5. The ratio of students to permanent lecturers whose fields of expertise are in accordance with major field (R MD)
Data
The data constructed consists of facts i.e.
-
1) . Total active students
-
2) . Total lecturers
-
1) Total active student data is taken from the data in the period from the last accreditation to the current condition and active student data at the time of the upcoming accreditation with the help of a forecasting system
-
2) The total lecturer data will be in the form of suggestions to users of this data obtained from the student data forecasting results and the total lecturers will be calculated which must be owned by the study program according to the desired assessment criteria
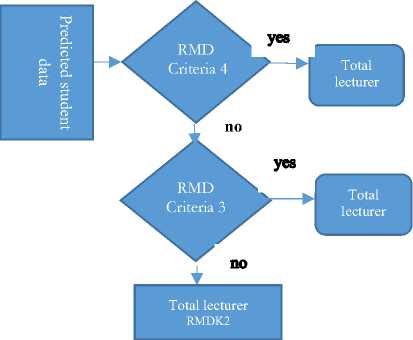
Fig.7. Total permanent lecturers flowchart
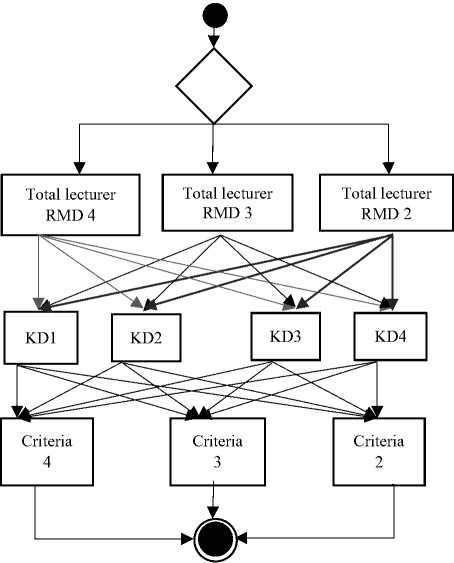
Fig.8. Criteria activity diagram
-
a. KD1 total forecasting criteria lecturers will be made to the forecasting of lecturers graduated from master and Doctorate
-
b. KD2 total forecasting criteria lecturers will be made to the forecasting of lecturers graduated from doctorate
-
c. KD3 total forecasting criteria lecturers will be made to the forecasting of lecturers with jabatan fungsional lektor kepala and above
-
d. KD4 forecasting criteria lecturers will be made to the forecasting of lecturers with sertfikasi dosen
Inference Engine
Inference engine will compare the existing data with the rules contained in the form of Higher Education (the assessment of each component is in the respective criteria), then the approach used by the expert system to determine the deficiencies in the assessment starting from the calculation of forecasting of data entered by the user, then processed the forecast will be displayed.
hasil berada di daerah penilaian tertentu
pemberian saran untuk memenuhi poin dalam borang dikti
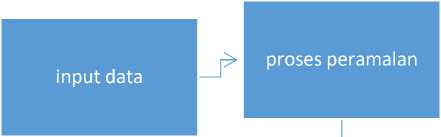
Fig.9. Decision support system flow
-
a. Input data
This process is to enter the data set that contains the number of students that have been collected from the previous to the present time
Autocorrelation Function for C2 (with 5% significance limits for the autocorrelations)
Lag
Partial Autocorrelation Function for C2 (with 5% significance limits for the partial autocorrelations)
12345678 Lag
Fig.10. Acf and pacf
1,0
0,8
0,6
0,4
0,2
0,0
-0,2
-0,4
-0,6
-0,8
-1,0
-
b. Forecasting process
This process is to predict the condition of the number of students in a certain period with the forecasting methods which in this research using the method ARIMA
ARIMA process
The first process is to check data stationary using Minitab applications aid the result is
ARIMA (2,1,0) result
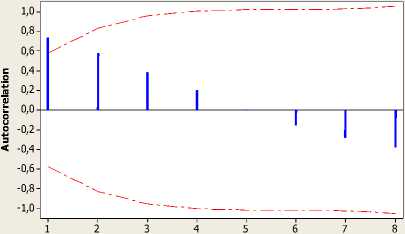
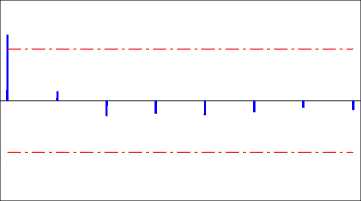
Seen from the acf chart shows down to 0 and continues to decline meaning that data is not stationary to the mean it must be differentiated first. After differentiation 1, the results of the graph are c. Forecasting data
Seen the data is stationary against the mean and looks acf cut at lag 1 then ar model 1 and pacf cutin lag 1 then MA model are 1, the model that allows for forecasting are
Final Estimates of Parameters
|
Type |
Coef |
SE Coef |
T |
P |
|
AR 1 |
-0,8458 |
0,3411 |
-2,48 |
0,033 |
|
AR 2 |
0,0821 |
0,3655 |
0,22 |
0,827 |
|
Constant |
145,40 |
23,29 |
6,24 |
0,000 |
Differencing: 1 regular difference
Number of observations: Original series
14, after differencing 13
Residuals: SS = 68721,6
(backforecasts excluded)
MS = 6872,2 DF = 10
Table 2. Probability model ARIMA
|
Model |
Mean Square Deviation |
information |
|
ARIMA (1,1,0) |
6267,9 |
|
|
ARIMA (2,1,0) |
6872,2 |
|
|
ARIMA (3,1,0) |
2372,3 |
Result ARIMA (1,1,0)
Final Estimates of Parameters
Modified Box-Pierce (Ljung-Box) ChiSquare statistic
|
Lag |
12 |
24 |
36 |
48 |
|
Chi-Square |
15,0 |
* |
* |
* |
|
DF |
9 |
* |
* |
* |
|
P-Value |
0,091 |
* |
* |
* |
|
P-Value |
0,168 |
* |
* |
* |
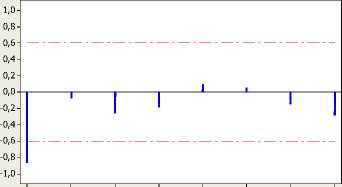
Autocorrelation Function for C5 (with 5% significance limits for the autocorrelations)
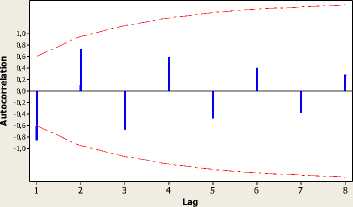
Partial Autocorrelation Function for C5 (with 5% significance limits for the partial autocorrelations)
Lag
Fig.11 acf dan pacf plot after diferensiated 1
Type Coef
AR 1 -0,9132
Constant 157,07
SE Coef TP
0,1385 -6,590,000
21,98 7,150,000
Differencing: 1 regular difference
Number of observations: Original series
-
14, after differencing 13
Residuals: SS = 68946,4
(backforecasts excluded)
MS = 6267,9 DF = 11
Modified Box-Pierce (Ljung-Box) ChiSquare statistic
|
Lag |
12 |
24 |
36 |
48 |
|
Chi-Square |
14,1 |
* |
* |
* |
|
DF |
10 |
* |
* |
* |
|
P-Value |
0,168 |
* |
* |
* |
From the test results it is known that in t test, all p-value <α, then all model types have been significant. The error value or MSE of this model is also quite small compared to the testing of the other models, namely 6267.9. From the results of the Box-Pierce (Ljung-box) test, all p-value values> α, the residual is said to meet the white noise assumption. From this test concluded that the model can be accepted.
For ARIMA 3,1,0
From the test results it is known that in the t test, all p-value values are some that exceed α which is 0.067. The error value or MSE of this model is 2372.3. From the results of the Box-Pierce (Ljung-box) test, all p-value> α values are said to have not fulfilled the assumption of white noise. From this test concluded that the model cannot be accepted because the value of the p value is not met.
Then from the 3 models above the model that is more qualified for forecasting is in ARIMA (1,1,0).
|
Final Estimates of |
Parameters |
||
|
Type P |
Coef |
SE Coef |
T |
|
AR 1 |
-0,5174 |
0,2084 |
-2,48 |
|
0,035 AR 2 0,067 |
-0,5109 |
0,2449 |
-2,09 |
|
AR 3 |
-1,0012 |
0,2845 |
-3,52 |
|
0,007 Constant 0,000 |
259,92 |
13,75 |
18,90 |
|
Differenci |
ng: 1 regular difference |
||
|
Number of |
observations: Original |
||
|
series 14, |
after differenci |
ng 13 |
|
|
Residuals: |
SS = |
21350,6 |
|
|
(backforecasts excluded) |
|||
|
MS = |
2372,3 |
DF = 9 |
|
|
Modified Box-Pierce Square statistic |
(Ljung- |
Box) Chi- |
|
|
Lag |
12 |
24 36 |
48 |
|
Chi-Square |
9,3 |
* * |
* |
|
DF |
8 |
* * |
* |
|
P-Value |
0,320 |
* * |
* |
Final Estimates of Parameters
|
Type |
Coef |
SE Coef |
T |
|
P AR 1 |
-0,9132 |
0,1385 |
-6,59 |
|
0,000 Constant |
157,07 |
21,98 |
7,15 |
0,000
Differencing: 1 regular difference
Number of observations: Original series 14, after differencing 13 Residuals: SS = 68946,4
(backforecasts excluded)
MS = 6267,9 DF = 11
Modified Box-Pierce (Ljung-Box) ChiSquare statistic
|
Lag |
12 |
24 |
36 |
48 |
|
Chi-Square |
14,1 |
* |
* |
* |
|
DF |
10 |
* |
* |
* |
|
P-Value |
0,168 |
* |
* |
* |
Forecasts from period 14
95% Limits
Period Forecast Lower Upper
Actual
|
15 |
1198,34 |
1043,13 |
1353,54 |
|
16 |
1195,29 |
1039,50 |
1351,08 |
|
17 |
1355,15 |
1143,74 |
1566,55 |
|
18 |
1366,23 |
1153,39 |
1579,07 |
|
19 |
1513,18 |
1262,39 |
1763,98 |
|
20 |
1536,06 |
1282,96 |
1789,15 |
|
21 |
1672,24 |
1390,36 |
1954,12 |
|
22 |
1704,95 |
1419,97 |
1989,92 |
The Faculty of computer science in Singaperbangsa karawang university will face re-accreditation in 2018 so the data needed to be predicted until that year student data after being processed by the MINITAB helper application is obtained as follows provision of advice to meet Higher Education Higher Education Form accreditation
Table.3. Data on the number of students Fasilkom UNSIKA
|
year |
periode |
student |
|
2008 |
1 |
46 |
|
2 |
41 |
|
|
2009 |
3 |
180 |
|
4 |
166 |
|
|
2010 |
5 |
404 |
|
6 |
367 |
|
|
2011 |
7 |
541 |
|
8 |
496 |
|
|
2012 |
9 |
800 |
|
10 |
741 |
|
|
2013 |
11 |
980 |
|
12 |
748 |
|
|
2014 |
13 |
1043 |
|
14 |
1023 |
|
|
2015 |
15 |
1198 |
|
16 |
1195 |
|
|
2016 |
17 |
1355 |
|
18 |
1366 |
|
|
2017 |
19 |
1513 |
|
20 |
1536 |
|
|
2018 |
21 |
1672 |
|
22 |
1705 |
The following is the calculation process from the point points there are rules that will produce an assessment on the accreditation points, i.e. :
In this process will be divided into 4 processes including.
-
1) . Dt graduated from master and doctorate whose fields of expertise are in accordance with the competence of Major (KD1)
-
2) . Dt, who has a doctorate education whose field of expertise is in accordance with the competence of doctorate (KD2)
-
3) . Dt who has the position of head lector and professor whose expertise is in accordance with the competence of PS (KD3) and Dt who have lecturer certification (KD4)
-
4) . Ratio of students to permanent lecturers whose fields of expertise are in accordance with the field of PS (R MD)
This section is the part in the form that relates to the assessment of the number of lecturers in the study program and each section has its own assessment even though there are items that have the same assessment system.
1). Dt graduated from master and doctorate whose fields of expertise are in accordance with the competence of Major (KD1)
This section will display suggestions for fulfilling point 4.3.1 form where it will show the movement of the number of students in the study program and will choose the source data from the results of forecasting student lecturer ratio (RMD) to use which criteria and will produce the number of lecturers with master and doctorate education must be fulfilled when the major wants these criteria where the formulation is KD1 = master and doctorate lecturer / total number of lecturers, the total lecturers are taken from the proposed RMD estimate, for criterion 4 KD1 = 90%, translated to 90% * TD, for those who do not meet the conditions criterion 4
Score = (20 x KD 1 / 3) – 2.(1)
Score+2=20 x kd1/3(2)
skor+2 _ kd.1,-.
20 — 3
-
3 x (sk°r+2) = kdl(4)
For 3rd criteria
-
3 x (3+2) = kdl(5)
above KD1=75%, then for advice lecturers master and doctoral graduates will be annoted 75%*TD, (3)
For 2nd criteria
' ' kdl (6)
Above KD1 = 60%, then for master and doctoral lecturer advice it translates to 60% * TD, the result of the calculation of the RMD amount is obtained the value
Table 4. RMD assessment results
|
point KD1 |
criteria 4 |
criteria 3 |
criteria 2 |
|
|
90% |
4 |
68 |
48 |
31 |
|
75% |
3 |
56 |
40 |
26 |
|
60% |
2 |
45 |
32 |
20 |
-
1) . Dt, who has a doctorate education whose field of expertise is in accordance with the competence of major (KD2)
This section will display suggestions for fulfillment of 4.3.2 point items which will show the movement of the number of students in the study program and will select the source data from the results of forecasting student lecturer ratio (RMD) to use which criteria and will produce the number of doctorate educated lecturers (S3) who must fulfilled when the study program wanted these criteria where the formulation, KD2 = S3 lecturer / total number of lecturers, total lecturers taken from the proposed RMD estimate, for criteria 4 KD2 ≥ 40%, if <40 then score = 2+ 5 x KD 2A = b + c x d% (7)
A – b = c x d% d% =
a
b
c
For the third criteria is taken from the lower threshold which is in 26,67%, so the total lecturer's suggestion s3 = 26,67 x total lecturers d% = 3^2 (8)
For the second criteria is taken from the lower threshold which is in 13,33 so the total lecturer's suggestion s3 = 13,33 x total lecturers d% = 2^ (9)
-
1) . Dt who has the position of lektor kepala and professor whose expertise is in accordance with the competence of major (KD3) and Dt who have lecturer certification (KD4)
This section will display suggestions for fulfilling 4.3.3 and 4.3.4 form items which will show the movement of the number of students in the study program and will select the source data from the results of forecasting student lecturer ratios (RMD) to use which criteria and will produce the number of lecturers have jabatan fungsional (jabfung) lektor kepala (LK) and professors (GB) that must be fulfilled also for assessment for the number of lecturers who have sertifikasi dosen (serdos) so the number of lecturers when the study program wants these criteria where the formulation, KD3 = lecturer jabfung Lk and the professor / total number of lecturers, the total lecturers are taken from the proposed RMD estimates, in the form rules If KD 3 ≥ 40%, then the score = 4.
For criterion 4, KD3 and KD4 are needed = total jabfung / total lecturers
Total jabfung = KD3 x total lecturer Total jabfung = 40% x total lecturer
If KD 3 <40%, then the score = 1 + 7.5 x KD3.
A = b + c x d%
d%
a b + c
d%
1 + 7,5
Criterion 3
For criterion 3 is taken from the lower threshold which is in 32,29%, so the total lecturer's suggestion with jabfung and serdos = 32,29 x total lecturers and do roundup numbers d% = — 1+7,5
Criterion 2
For criterion 2 taken from the lower threshold of 23.53%, it is recommended total lecturers of Jabfung and Serdos = 23.53 x total lecturers and roundup numbers
-
4) . Ratio of students to permanent lecturers whose fields of expertise are in accordance with the field of major (R MD)
This section will display suggestions for fulfillment of 4.3.2 point items which will show the movement of the number of students in the study program and will select the source data from the results of forecasting student lecturer ratio (RMD) to use which criteria and will produce the number of doctorate educated lecturers who must fulfilled when the study program wants these criteria where the formulation is, For a value of 4 RMD = total student / number of lecturers where the RMD must be between 17 to 23. For further assessment hsf = 4 x (60 - R MD) / 37. 4 x (60 - (total students / total permanent lecturers)) / 37. Where the RMD must be between 24 and 60. So it can be formulated
Criteria 4 is targeted to fulfil 23, the total number of permanent lecturers = student forecast results (HSF) / 23.
With a forecast value of 1705, for criteria 4 the total lecturers must have 1705/23 = 75 lecturers
Criterion 3 is targeted to fulfil at 32
Criteria value = 4 x (60 - R MD) / 37. 4 x (60 - RMD) / 37 for mathematical notation
a = bx(c - d)/e (12)
axe = bx(c - d)
axe
— = (c - d)
d = c
axe
-
b
So the recommended RMD is d = 60
hsx37
d = 60
3x37
For value 3 must be smaller than the value of 32.2% for value 2 must be smaller than the value of 41.5%. Furthermore, absolute rounding is done because the object is human and for the total forecast the lecturer is needed
RMD = hsf / total lecturer
Want to where the position of these criteria if you want to 3 then take the maximum number
Total lecturers = HSF / RMD Total lecturers = HSF / 32.5
With a forecast value of 1705, for criteria 4 the total lecturers must have 1705 / 32.5 = 53 lecturers
If you want in 2 then take the maximum number
Total lecturer = HSF / 50
With a forecast value of 1705, for criteria 4 the total lecturers must have 1705/50 = 34 lecturers
-
IV. Conclusion
From the discussion of the results of the analysis that has been described, conclusions can be drawn, namely:
-
1. The movement of the number of students in the computer science faculty at singaperbangsa karawang university shows a trend and does not have seasonal conditions.
-
2. This application can be used after the forecast data is calculated using a variety of models.
-
3. With the results of forecasting majors director can prepare the number of lecturers needed when accreditation arrives.
-
4. With the help of the application major director can plan a lecturer career where the lecturer career will be a value in the form
Suggestions
Based on the results of the analysis in the discussion, suggestions can be given by the author, namely:
-
1. For researchers who will do the same research, it is recommended to analyze student data with other methods.
-
2. For future research, the forecasting process can be integrated from the identification of models and adjustments for forecasting and forecasting as a whole with the DSS application
-
3. For research in the field of academic administration can be integrated with more complex systems in both the application for accreditation or assist in the academic system.
References Decision support system of fulfillment the number of lecturers based on dikti form using expert system approach
- E. Sulaeman, E. Suswardji, and Nuraeni, “Jurnal Manajemen Vol.09 No.2 Januari 2012 631,” vol. 09, no. 2, pp. 631–656, 2012.
- R. S. Pressman and B. R. Maxim, Software engineering, no. 8. 2014.
- I. Pulido-Calvo and M. M. Portela, “Application of neural approaches to one-step daily flow forecasting in Portuguese watersheds,” J. Hydrol., vol. 332, no. 1–2, pp. 1–15, 2007.
- R. Caballero and T. Go, “An Approach to Multi-Criteria Decision Problems Under Severe Uncertainty,” J. MultiCriteria Decis. Anal., vol. 2, no. October 2009, pp. 29–48, 2013.
- W. Xiuquan, S. Xiaoliu, and T. Zhongfu, “Building a web-based decision support system for sustainable development of energy, economy and environment,” 2009 Int. Conf. Signal Process. Syst. ICSPS 2009, May 15, 2009 - May 17, no. 3, pp. 81–84, 2009.
- S. Happy and Y. Nainggolan, “Menggunakan metode Analytic Hierarchy Process ( studi kasus : Prodi Manajemen Informatika Politeknik Telkom ) Sistem Pendukung Pengambilan Keputusan Pemilihan Mata Kuliah Pilihan ( studi kasus : Prodi Manajemen Informatika Politeknik Telkom ),” 2011.
- A. N. Munawaroh, “Peramalan Jumlah Penumpang Pada Pt. Angkasa Pura I (Persero) Kantor Cabang Bandar Udara Internasional Adisutjipto Yogyakarta Dengan Metode Winter’S Exponential Smoothing Dan Seasonal Arima Skripsi,” Universitas Negeri Yogyakarta, 2013.
- I. Braune, A. Pinkwart, and M. Reeg, “Application of multi-criteria analysis for the evaluation of sustainable energy systems - A review of recent literature,” in Dubrovnic Conference on Sustainable Development of Energy, Water and Environment Systems, 2009.
- A. Udo Richard, Franz, Decision-making support systems : Theory & practice. 2012.
- J. Patalas-Maliszewska and T. Krupa, “The Multicriteria Selection Methodology of the Decision Support System,” Found. Manag., vol. 2, no. 2, p. 51, 2010.
- F. S. Ardina Ariani, Leon Andretti Abdillah, “Sistem pendukung keputusan kelayakan tki ke luar negeri menggunakan fmadm,” Fak. Ilmu Komput. Univ. Bina Darma, pp. 336–343, 2011.
- E. Turban, J. E. Aronson, and T.-P. Liang, decision support systems and intelligent systems, 7th ed. prentice-hall, 2007.
- A. P. Desvina, “Penerapan metode box-jenkins untuk memprediksi jumlah mahasiswa universitas islam negeri suska riau,” SiTekIn, vol. 12, no. 1, pp. 80–89, 2014.
- J. P. Brans and Y. De Smet, “PROMETHEE methods,” Int. Ser. Oper. Res. Manag. Sci., vol. 233, pp. 187–219, 2016.
- S. Roman, Access Database Design & Programming, 3rd Edition, no. January. 2002.
- Turban, “Historical Overview of Decision Support Systems (DSS),” Encycl. Inf. Sci. Technol. Second Ed., pp. 1753–1755, 1995
