Depression Detection: Unveiling Mental Health Insights with Twitter Data and BERT Models

Author: Rohini Kancharapu, Sri Nagesh Ayyagari
Journal: International Journal of Education and Management Engineering @ijeme
Article in issue: 4 vol.14, 2024.
Free access
Social media platforms serve as avenues for individuals to express themselves and share pertinent details concerning their mental well-being through posts and comments. However, many individuals tend to overlook their mental health. This data lends itself to insightful analysis of an individual's psychological state through sentiment analysis techniques. The research explores the utilization of sentiment analysis techniques on social media data, specifically focusing on mental health discussions. Data gathered from platforms like Twitter is preprocessed and then used to train various Transformer models including DistilBERT, Albert, and a hybrid BERT-CNN model. Notably, the BERT-CNN hybrid model achieved a remarkable accuracy of 95%. This outcome underscores the effectiveness of advanced model architectures in analyzing mental health-related sentiment on social media. The significance of this research lies in its potential to offer valuable insights into individuals' mental states through computational analysis of their online expressions. The study's thorough methodology, encompassing data collection, preprocessing, and model training, sets a strong precedent for future research in this domain. Additionally, the successful performance of the BERT-CNN hybrid model highlights the importance of innovative model design in achieving accurate sentiment analysis results. Overall, this research contributes to the growing body of knowledge aimed at leveraging technology for mental health awareness and support.
Self-harm, Twitter, Tweepy, Depressed Keywords, VADER, Transformer Models, Convolution Neural Network (CNN), Albert, Distilbert
Short address: https://sciup.org/15019317
IDR: 15019317 | DOI: 10.5815/ijeme.2024.04.01
Text of the scientific article Depression Detection: Unveiling Mental Health Insights with Twitter Data and BERT Models
The prevalence of depression worldwide underscores the urgent need for effective approaches to address mental health challenges. Despite advancements in technology facilitating early detection and increased public awareness, mental health issues often remain underreported and insufficiently addressed. Social media platforms offer a unique avenue for individuals to openly discuss their mental well-being, potentially providing valuable insights into their experiences. However, analyzing this vast amount of data poses significant challenges without appropriate tools and methodologies.
Existing research has highlighted the potential of sentiment analysis techniques to extract insights from social media data, including discussions related to mental health [1]. Platforms like Twitter have become hubs for individuals to express their thoughts, feelings, and experiences, including those related to depression. However, while sentiment analysis holds promise, determining the most effective approach remains a challenge. Various methods, including traditional machine learning algorithms and advanced deep learning models, have been explored, each with its strengths and limitations.
Among the existing solutions, Transformer models have emerged as powerful tools for natural language processing tasks [2]. These models, such as DistilBERT, Albert, and hybrid BERT-CNN architectures, offer sophisticated ways to capture contextual relationships and semantic representations within text data. The hybrid BERT-CNN model, in particular, combines the strengths of BERT's contextual embeddings with the efficiency of Convolutional Neural Networks (CNNs) for text classification tasks [3]. While these models have shown promising results in various domains, their effectiveness in analyzing mental health-related discussions on social media platforms like Twitter remains an area of exploration.
This study aims to address these challenges and gaps in existing research by focusing on several key objectives:
• To collect and analyze mental health-related data from Twitter using sentiment analysis techniques.
• To evaluate the performance of different Transformer models, including DistilBERT, Albert, and a hybrid BERT-CNN model, in classifying depression-related tweets.
• To assess the potential of sentiment analysis on social media data in understanding individuals' mental states and well-being.
• To identify opportunities for leveraging social media data and sentiment analysis techniques to improve mental health support systems and interventions.
2. Related Works
By addressing these objectives, the study aims to contribute to the growing body of literature on utilizing social media data for mental health assessment. Specifically, the research seeks to identify the most effective approach for analyzing depression-related discussions on Twitter and to provide insights that can inform the development of more targeted and efficient mental health interventions in the digital age.
The rise of social media platforms has completely changed how people express themselves and communicate online. Particularly Twitter has developed into a wonderful resource for current knowledge, providing perceptions into many facets of human behaviour, including mental health. More and more, researchers are using Twitter data to investigate and comprehend mental health conditions like depression. It is possible to learn a lot about people's mental health and potential depressive symptoms by examining the content and patterns of tweets. With a focus on non-AI methods, this review of the literature attempts to give an overview of the current research on Twitter data-based depression identification. This review tries to illuminate the state of the field's knowledge at the present time and pinpoint prospective directions for future research by analysing the techniques, conclusions, and limits of earlier studies.
The rise of social media platforms has revolutionized how people express themselves and communicate online. Particularly, Twitter has emerged as a valuable resource for understanding various aspects of human behavior, including mental health. Researchers increasingly leverage Twitter data to investigate and comprehend mental health conditions such as depression. Analyzing the content and patterns of tweets can provide valuable insights into people's mental health and potential depressive symptoms. This review aims to provide an overview of current research on depression identification using Twitter data, focusing on non-AI methods, and to suggest potential directions for future research by examining the techniques, conclusions, and limitations of previous studies.
Piyush Kumar et al. proposed a method to predict depression in users based on sentiment scores of their tweets. They utilized logistic regression, SVM, random forest, and XGBoost classification methods and achieved 89% detection using SVM [1]. Hatoon AlSagri and Mourad Ykhlef compared SVM, naive Bayesian, and decision tree models and found SVM to perform the best in detecting depression [2]. They utilized various R packages and the Activity and Content Trait Classification Model for classification, achieving high accuracy. Nisha P. Shetty et al. aimed to forecast depression by analyzing online behavior, employing sentiment analysis and deep learning techniques on Twitter data. Their approach yielded promising results, and they intend to expand their dataset to enhance diagnostic capabilities [3].
-
S. Behl et al. explored sentiment analysis on Twitter data for disaster relief during COVID-19 and natural hazard crises, focusing on assessing public sentiment to aid disaster response efforts [4]. H. Kour and M. K. Gupta developed a hybrid deep learning approach for depression prediction from user tweets, utilizing a feature-rich CNN and bidirectional LSTM model to improve prediction accuracy [5]. Z. Hameed and B. Garcia-Zapirain proposed a sentiment classification model using a single-layered BiLSTM architecture, demonstrating the effectiveness of the BiLSTM approach in sentiment analysis tasks [6].
Ramin Safa et al. developed a multimodal framework for predicting depression symptoms using Twitter profiles, achieving an impressive accuracy rate of 91%. Their framework can be adapted to address other mental disorders and implemented in diagnostic systems or suicide self-harm prevention tools integrated into social media platforms [7]. Chaitanya Bhargava et al. proposed a model to identify depressive tweets using linguistic variables and achieved high accuracy using a Rule-based Vader Analyzer and a hybrid CNN-LSTM model [8].
Wenbo Zheng et al. presented a graph attention model embedded with multi-modal knowledge for depression detection, focusing on leveraging graph attention models and multi-modal information to enhance depression detection from social media data [9]. M. Trotzek et al. proposed the utilization of neural networks and linguistic metadata for early detection of depression indications in text sequences [10]. Bhargava C et al. conducted research on depression detection using sentiment analysis of tweets, aiming to identify signs of depression through sentiment analysis techniques [11].
-
H. Kaur et al. proposed a sentiment analysis deep learning algorithm for analyzing COVID-19 tweets to gain insights into public sentiment during the pandemic [12]. M. Divyapushpalakshmi and R. Ramalakshmi proposed an efficient sentiment analysis approach using hybrid deep learning and optimization techniques for Twitter data, employing parts-of-speech (POS) tagging to enhance sentiment analysis performance [13].
-
2.1 Novelty of this study
-
2.2 Proposed System
M. L. Joshi and N. Kanoongo conducted a review on depression detection using emotional artificial intelligence and machine learning, examining the use of emotional AI and machine learning techniques for detecting depression and discussing their advantages and limitations [14]. N. V. Babu and E. G. M. Kanaga conducted a review on sentiment analysis in social media data for depression detection using artificial intelligence, analyzing the use of AI techniques, specifically sentiment analysis, to detect depression from social media posts and highlighting key findings and challenges in the field [15].
In summary, the literature survey covers various approaches for depression detection, sentiment analysis, and opinion monitoring using social media data. These studies explore different techniques, including deep learning, sentiment classification models, LSTM-RNN, attention mechanisms, and machine learning algorithms, to analyze textual data and identify indicators of depression or sentiment patterns related to specific events like COVID-19. Overall, these research works contribute to understanding public sentiment and mental health monitoring through social media analysis.
The uniqueness of this research lies in its emphasis on utilizing current public opinion data rather than relying on outdated repositories. By monitoring the thoughts and sentiments expressed by the public, authorities can gain valuable insights for making well-informed decisions and improving their services. To collect the necessary data, we utilized tweets from the Twitter API, leveraging developer account keys. Our approach involved a hybrid model that combines BERT and CNN models, which we compared against transformer models like Albert and DistilBERT.
The proposed frame work of this study shown in Fig.1, presents a pioneering approach in which we acquire the dataset by gathering tweets from the Twitter API, utilizing developer account keys. The primary objective is to detect signs of depression within these tweets, for which we employ the VADER algorithm. This algorithm classifies the tweets into positive, negative, or neutral categories based on their polarity scores, allowing us to identify potentially depressive content.
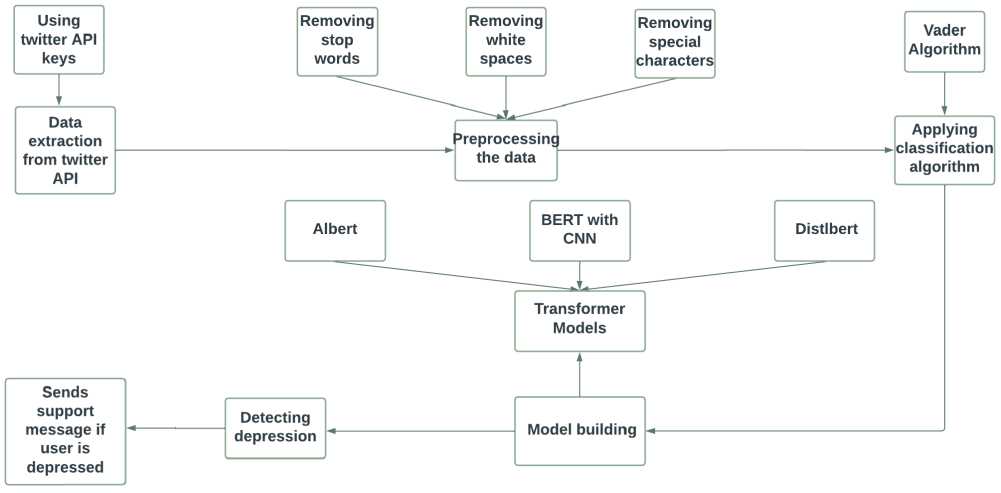
Fig.1. Proposed Framework
To construct models, we propose a novel hybrid approach that combines BERT-CNN. This hybrid model harnesses the strengths of both BERT (Bidirectional Encoder Representations from Transformers) and CNN (Convolutional Neural Network) architectures. We compare the performance of our hybrid model with other transformer models such as Albert and DistilBERT, commonly used in natural language processing tasks.
To ensure real-time data acquisition, we implement a live streaming mechanism using the tweepy package. This allows us to continuously gather and process the tweets, ensuring that we are working with the most recent data available. By adopting this comprehensive approach, integrating data collection through the Twitter API, applying the
VADER algorithm for depression detection, proposing a hybrid BERT-CNN model, and incorporating live streaming capabilities, our study offers a novel framework for analyzing mental health-related content on social media platforms.
3. Methodology
The proposed methodology plays a crucial role in facilitating the achievement of the research objectives outlined in the study. Here's how each aspect of the methodology contributes to addressing the research objectives:
-
i. Data Collection from Twitter: The use of Twitter's API to collect mental health-related data focusing on depression-related keywords directly addresses the objective of gathering relevant data from social media platforms. By specifically targeting depression-related content on Twitter, the study ensures that the collected data is aligned with the research focus.
-
ii. Preprocessing Steps: The preprocessing steps, including the removal of stop words, special characters, and unnecessary spaces, ensure that the collected data is clean and standardized, making it suitable for analysis. This step contributes to the objective of preparing the data in a format suitable for analysis, thereby enhancing the quality and consistency of the dataset.
-
iii. Model Selection: The study employs various Transformer models, including DistilBERT, Albert, and a hybrid BERT-CNN model, for analysis. Each model is chosen based on its capability to capture contextual relationships and semantic representations within text data. By utilizing a diverse set of models, the study aims to assess their performance in classifying depression-related tweets, thereby addressing the objective of evaluating different approaches for analyzing mental health-related social media data.
-
iv. Sentiment Analysis Techniques: The study leverages sentiment analysis techniques to gain insights into individuals' mental states and well-being. By analyzing the sentiment expressed in tweets, the study aims to identify indicators of depression and understand patterns related to mental health. This directly aligns with the objective of using sentiment analysis to understand individuals' mental states and well-being.
-
v. Evaluation of Model Performance: The performance of each model, including accuracy rates and classification metrics, is evaluated to determine the most effective approach for analyzing depression-related discussions on Twitter. This assessment directly contributes to the objective of comparing different Transformer models and identifying the best-performing model for the task.
Overall, the proposed methodology provides a structured approach to gathering, preprocessing, and analyzing social media data related to depression. By systematically implementing each step of the methodology, the study aims to achieve its research objectives of understanding and analyzing mental health-related discussions on Twitter, evaluating different approaches for sentiment analysis, and identifying opportunities for leveraging social media data for mental health assessment.
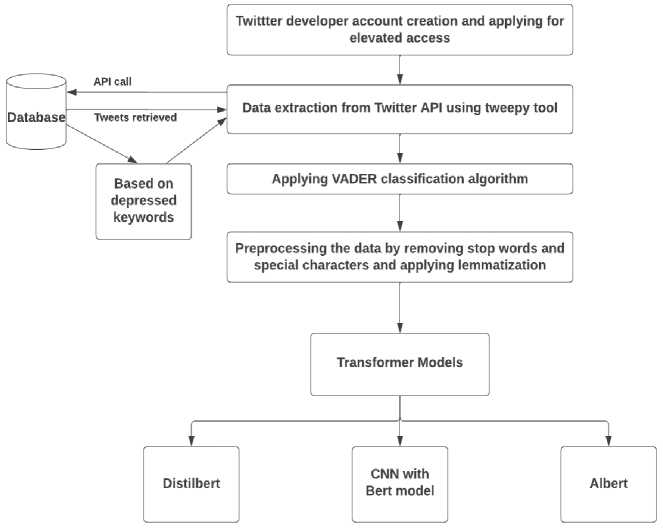
Fig. 2. Architecture Diagram
Our work can be divided into different modules in Fig. 2, which are explained as follows. Firstly, we selected the Twitter dataset as our dataset for the study. We acquired access to live tweets from Twitter API through the developer account. To create a developer account, we first created a regular Twitter account and then requested and generated access keys. These access keys were then used to extract live tweets along with their metadata, such as user name and description. Next, we preprocessed the dataset before using it in the subsequent steps. The VADER algorithm was used to label the dataset as positive, negative, or neutral based on the polarity score. We then trained the model on the cleaned and labeled dataset. The trained model was used to categorize the user's tweets as either depressed or nondepressed.
In the subsequent sections, a detailed description of each module's operation is provided. The entire procedure has been dissected into several modules, and in this section, we delve into the specifics of each one. Our initial step was to obtain a dataset, which we chose to be the Twitter dataset. To collect live tweets from the Twitter API, we required access to a developer account. A normal Twitter account had to be created before creating a developer account. We requested and generated access keys after creating the developer account, which we used to extract live tweets and other metadata such as the user's name and description. The dataset was preprocessed before being utilized in subsequent steps. The VADER algorithm was employed to label the dataset, and the cleaned and labeled dataset was utilized to train the model. We were able to divide the user's tweets into depressed and non-depressed groups using the trained model. The functionality of each module is explained in depth and the steps involved in its operation in the sections that follow.
Algorithm for Methodology
-
1. Generate access keys for Twitter API by creating a developer account and completing the questionnaire
-
a. Choose between essential access and elevated access
-
b. Request and generate API access keys:
-
i. API_KEY
-
ii. API_SECRET
-
iii. ACCESS_TOKEN
-
iv. ACCESS_TOKEN_SECRET
-
2. Extract data from Twitter API using the generated access keys
-
a. Use tweepy tool for extraction
-
b. Extract tweets related to depression using search terms
-
c. Extract tweet-related information such as username, user description, TweetID, favourite count, retweet count, etc.
-
3. Preprocess the extracted tweets by cleaning the data
-
a. Remove stop words and special characters using NLTK.
-
b. Use regular expressions to clean the data.
-
4. Label the cleaned tweets using the VADER algorithm.
-
a. Utilize the VADER algorithm to compute the polarity of sentiment.
-
b. Classify tweets into positive, negative, or neutral categories according to their sentiment polarity.
-
5. Train the model using the cleaned and labelled dataset
-
a. Leverage machine learning models to classify tweets as either depressed or non-depressed using a labeled dataset.
-
6. Employ the trained model to categorize a user's tweets as either depressed or non-depressed.
-
a. Utilize the trained machine learning models from step 5 to classify a user's tweets as either depressed or non-depressed.
Step 1: Generating access keys for Twitter
In order to gain access to the Twitter API, the initial step involves creating a developer account specifically for Twitter API. This process entails providing detailed information about the purpose behind accessing the Twitter API and outlining the specific research details. Access to the Twitter API is essential for extracting tweets from the platform. There are two types of access provided by Twitter developer account: essential access and elevated access. Essential access is given when we register for a developer account, whereas elevated access requires us to complete a questionnaire. This questionnaire includes questions about the intended use of the data. We start with essential access, and after Twitter approves our request, we can upgrade to elevated access, which provides more privileges. Once we receive the acceptance email, we can generate and use the access keys. The following generated keys are used to extract tweet data.
-
i. API_KEY
-
ii. API_SECRET
-
iii. ACCESS_TOKEN
-
iv. ACCESS_TOKEN_SECRET
Step 2: Data Extraction
After obtaining the keys, we used tweepy, a tool for extracting data from Twitter API. We extracted approximately 40,000 tweets and their associated information. To ensure that only relevant data was extracted, we used depression-related search terms provided by Jonathan Scour [17] on ResearchGate. In addition to tweets, other attributes such as username, user description, TweetID, favorite count, retweet count, etc. were also extracted.
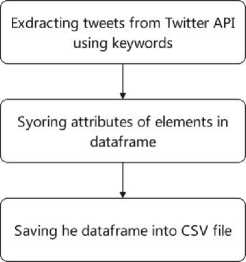
Fig.3. Data Extraction
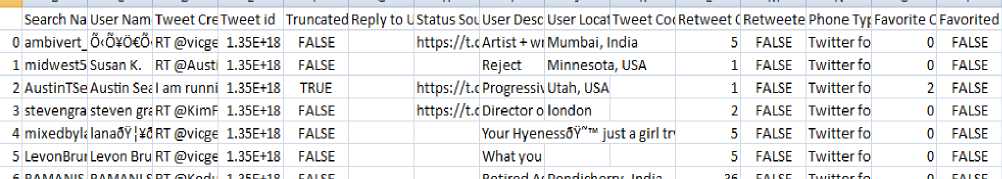
Fig. 4. Sample Dataset extracted from twitter API
Step 3: Preprocessing the Tweets
Preprocessing plays a vital role in handling datasets by eliminating unnecessary data, extracting essential features, and reducing the overall data volume for processing. This critical step involves cleaning the data, removing special characters and stop words from the tweets. To accomplish this, we leveraged NLTK, a widely adopted Python toolkit designed for working with human language data. NLTK offers comprehensive text processing libraries for tasks such as categorization, tokenization, stemming, tagging, parsing, and semantic reasoning. It also provides convenient wrappers for other text processing libraries.
For removing stop words and special characters, we utilized NLTK's extensive resources, including a list of stopwords available in 16 different languages. This allowed us to effectively remove irrelevant stop words from the tweets. Additionally, regular expressions were employed to eliminate any special characters present in the text, further refining the dataset.
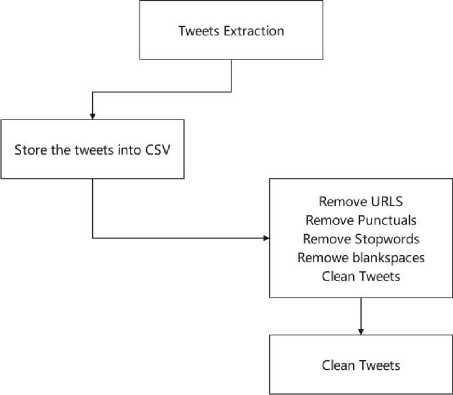
Fig.5. Data Preprocessing
Step 4: Labeling Data for Classification of Tweets Using VADER algorithm
The process of labeling tweets involves the utilization of the VADER algorithm, commonly known as Valence Aware Dictionary and Sentiment Reasoner. By employing this algorithm, every tweet is evaluated for its sentiment and subsequently categorized as neutral, negative, or positive. Emotions are classified using a compound score that spans from -1, representing a highly negative emotion possibly linked to depressive symptoms, to +1, indicating a notably positive emotion unrelated to any depressive symptoms. The tweets used for labeling are obtained from the Twitter API through the TweepyV2 library. Prior to labeling, the tweets undergo preprocessing using NLTK. This involves the removal of special characters and stop words. NLTK, a comprehensive Python package, offers an array of text processing tools, including libraries for categorization, tokenization, stemming, tagging, parsing, and semantic reasoning. It also provides access to over 50 corpora and lexical resources such as WordNet. The preprocessing step plays a crucial role in reducing unnecessary data and extracting essential features. By eliminating special characters and stop words, the preprocessing stage helps to streamline the dataset, ultimately reducing the amount of data that needs to be processed.
, Sentiment score
Normalized scare = .—(1)
^Sentiment scor e2+x
, Compouncisentimentscore
Overall sentiment score = . , =—(2)
^Compound sentiment score ^ +K
Tweets are categorized into different sentiments based on their compound scores obtained from the VADER algorithm. When the compound score reaches 0.5 or higher, it signifies a positive sentiment, while a score ranging from -0.5 to 0.5 indicates a neutral opinion. Conversely, a compound score of -0.5 or below is indicative of a negative sentiment.
Step5: Model Building
DistilBERT
DistilBERT is a modified version of BERT that optimizes the training process by reducing the size and increasing the speed while maintaining as much performance as possible. It uses a similar architecture to BERT, but only has six encoder blocks, initialized by selecting every other encoder block from the BERT model. It does not have the same pooling and token-type embedding features as BERT and is trained only using masked language modeling. Triple loss functions are used to train DistilBERT, and it uses a student-teacher learning relationship with BERT.
To load the model, the ClassificationModel() is used from the Hugging Face library, with the model name specified as 'distilbert', the model name as 'distilbert-base-cased', and the number of labels as 3. The argument use_cuda=True is specified to use the GPU if available, reprocess_input_data is set to true to preprocess the input data again even if it already exists in cache, use_cached_eval_features is set to false to recompute features at every evaluation step, overwrite_output_dir is set to true to overwrite existing saved model in the same directory, and num_train_epochs is set to 5. The training dataset is utilized to train the model using the fit() function.
Algorithm for DistilBERT
Input: preprocessed data labelled using VADER
Output: DistilBERT fine-tuned model trained with the preprocessed data
-
1. Load the DistilBERT pre-trained model using SimpleTransformersDistilbertModel.
-
2. Prepare the data for classification by converting text inputs and labels to the required format for SimpleTransformers.
-
3. The data is divided into training and validation sets.
-
4. Specify the hyperparameters for model training, which include determining the number of epochs, setting the learning rate, and defining the batch size.
-
5. Instantiate DistilbertClassificationModel with the desired hyperparameters.
-
6. Train the model using the train set with DistilbertClassificationModel.train_model().
-
7. Assess the model's performance on the validation set using the eval_model() function from DistilbertClassificationModel.
-
9. Save the model using DistilbertClassificationModel.save_model().
-
10. Use the saved model for prediction on new inputs with DistilbertClassificationModel.predict().
ALBERT
A Lite BERT, also known as ALBERT, is a technique used for self-supervised language representation learning. Both DistilBERT and Albert were introduced around the same time and share similar objectives. Albert, like DistilBERT, reduces the size of the BERT model by significantly reducing the number of parameters, resulting in faster training times (1.7 times faster). However, unlike DistilBERT, Albert does not compromise on performance. While DistilBERT exhibits a slight trade-off in performance, Albert overcomes this challenge.
The difference in performance can be attributed to the fundamental structural dissimilarity between the DistilBERT and Albert experiments. DistilBERT is trained using a method that involves BERT acting as its instructor during the training and distillation processes. In contrast, Albert is trained right from the beginning, similar to BERT. By implementing these parameter-reduction strategies, Albert achieves comparable outcomes to the smaller model architecture without sacrificing performance.
-
• Factorized Embedding Parameterization - is a technique that involves dividing the embedding matrix into two separate parts. This division ensures that the hidden layer and embedding dimensions have different sizes. By employing this approach, the hidden layer size can be effectively increased without modifying the embedding dimension.
-
• Cross-layer parameter sharing - Each of BERT and Alberta has 12 encoder blocks. These encoder blocks in ALBERT share all parameters. As a result, the parameter size is cut in half and the model's regularisation is increased by 12 times.
-
• Alberta removes dropout layers ALBERT just like BERT is trained on larger corpus data and can be fined tuned to a specific task like classification, summarization, question and answers etc. This model can be imported from the transformer package by hugging face for a specific task.
Algorithm for ALBERT
Input: preprocessed data labelled using VADER
Output: ALBERT fine-tuned model trained with the preprocessed data
-
1. Load the ALBERT pre-trained model using SimpleTransformersAlbertModel.
-
2. Prepare the data for classification by converting text inputs and labels to the required format for SimpleTransformers.
-
3. The data is divided into training and validation sets.
-
4. Specify the hyperparameters for model training, which include determining the number of epochs, setting the learning rate, and defining the batch size.
-
5. Instantiate AlbertClassificationModel with the desired hyperparameters.
-
6. Train the model using the train set with AlbertClassificationModel.train_model().
-
7. Evaluate the model performance on the validation set with AlbertClassificationModel.eval_model().
-
9. Save the model using AlbertClassificationModel.save_model().
-
10. Use the saved model for prediction on new inputs with AlbertClassificationModel.predict().
Hybrid model of BERT-CNN
CNN
CNN stands for Convolutional Neural Network and was first developed for image processing. However, it has also been used in NLP tasks where a one-dimensional array represents the text. CNNs are often used for sentence classification tasks where the goal is to classify a sentence into predetermined categories while considering its n-grams, words or sequence of words, and characters or sequence of characters.
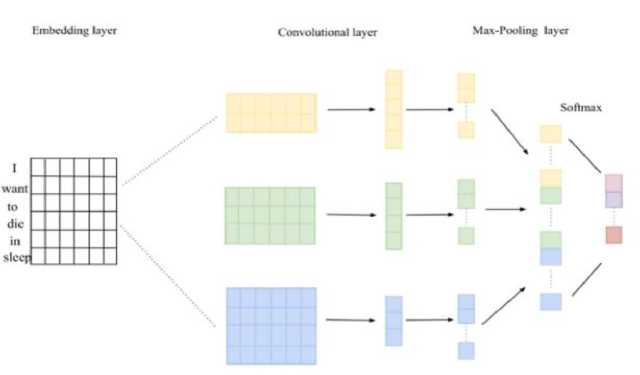
Fig.6. CNN Architecture
Convolution and pooling are the two main procedures in CNNs and are used as feature extractors. In the convolution layer, a sliding window of size k is selected as the kernel, and it slides over the input sequence while applying the same convolution filter, which is a dot-product between the embedding vectors in a particular window and a weight vector. In the pooling layer, a two-dimensional vector is created by pooling the vectors produced by many convolution windows, and the maximum or average value in the resulting vector is taken. The goal of the pooling layer is to capture all the important elements of the sentence or document.
BERT
-
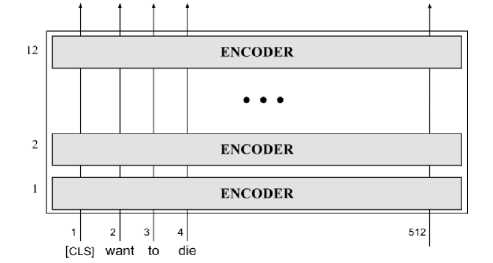
Fig.7. Internal structure of BERT
BERT, short for Bidirectional Encoder Representations from Transformers, is a transformative model that builds upon the original encoder-decoder transformer architecture, which is illustrated in Figure 7. It leverages self-supervised training techniques such as masked language modeling and next sentence prediction to acquire and generate contextual word representations. BERT's architecture consists of stacking 12 encoder blocks derived from the original transformer framework. To adapt BERT for various tasks like question answering, summarization, and sequence classification, additional linear layers are incorporated atop the stacked encoders. However, it's important to recognize that the core, unalterable element of BERT lies in the output generated by the stacked bi-directional encoders. These encoder blocks provide BERT with its inherent power, and by tailoring or introducing a specific combination of layers, BERT becomes capable of addressing a wide range of tasks.
Algorithm for BERT+CNN
Input: data labelled using VADER
Output: Hybrid model of BERT and CNN trained with the preprocessed data
-
1. Split the data into train and validation sets.
-
2. Preprocess the data to convert into BERT input format.
-
a. Load the BERT preprocess model.
-
b. Convert the raw text data using the preprocess model into tokenized BERT input format.
-
3. Load the pre-trained BERT model and train with preprocessed data from step 2.
-
4. The CNN architecture is defined by utilizing the BERT output embeddings as the input.
-
a. Define two convolutional layers one with 32 filters and kernel size 2 and another with 64 filters and kernel size 3.
-
b. Define a globalmax pooling layer.
-
c. Define a dense layer with relu activation layer.
-
d. Define a dropout layer.
-
e. Define a dense layer with softmax activation for classifier layer.
-
5. Train the CNN model using the BERT embeddings of the training dataset for the designated number of epochs.
-
6. Assess the performance of the trained model by evaluating it on the validation data and reporting the corresponding performance metrics.
-
7. Upon successful training and validation, the model is primed for making predictions on fresh text data. To achieve this, the input text is processed through the BERT tokenizer and then fed into the trained Hybrid model, enabling accurate predictions to be generated.
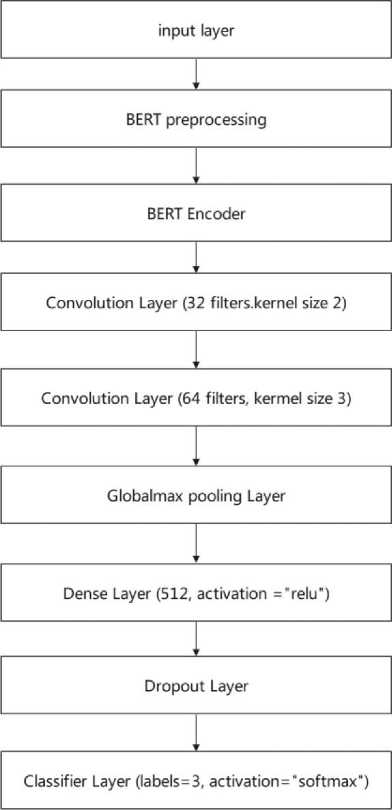
Fig.8. Hybrid BERT-CNN Architecture
4. Results
An implementation of hybrid BERT-CNN model includes BERT as the encoder layer within the CNN architecture. The Figure 8 illustrates the layout of the model, starting with an input layer that takes the raw text input data. The next layer is the BERT preprocessing layer, where the input text is tokenized and padded with special tokens to ensure a fixed input length, then encoded into numerical values using BERT's vocabulary. During training, a random token in the sentence is masked using the special [MASK] token to improve the model's ability to handle missing or unknown words.
The BERT preprocessing layer processes the input and generates a 512-dimensional vector representation. To enhance the model, we incorporated two convolutional layers. The first layer applies 32 filters with a kernel size of 2, and the second layer applies 64 filters with a kernel size of 3 to the output of the previous layer. Subsequently, a global max pooling layer is applied, followed by a fully connected dense layer with 512 units that performs a linear transformation on the input. To mitigate overfitting, we included a dropout layer. Finally, the classifier is implemented as a dense layer, which employs a softmax activation function on the preceding layer's output to produce class probabilities. We have trained our collected data with ALBERT, DISTILBERT and hybrid model of CNN_BERT, we have achieved 95% accuracy with the hybrid model of CNN_BERT, and the hybrid model achieved more accuracy than the ALBERT and DISTLBERT.
The experimental process involves collecting a dataset of depression-related tweets from Twitter using its API, preprocessing the data to clean and standardize it, selecting and training different Transformer models like DistilBERT, Albert, and a hybrid BERT-CNN model, and evaluating their performance in classifying depression-related tweets. The models will be tested on separate datasets, and their accuracy, precision, recall, and F1-score will be measured to determine their effectiveness. The results will be compared and analyzed to identify the most effective approach for analyzing mental health-related discussions on Twitter, providing insights into leveraging social media data for mental health assessment.
An accuracy graph with epochs provides a visual representation of how the accuracy of a model changes during the training process. The model's iterations across the training dataset are represented by the number of training epochs on the x-axis. The model's accuracy on a different validation or test dataset is represented on the y-axis, and this accuracy is typically expressed as a percentage. By examining the accuracy graph, we can track the progress of the model's performance over time. At the beginning of training, when the model is still learning and making random predictions, the accuracy may be initially low. However, as the model continues to train, the accuracy graph allows us to observe improvements and stability in the model's accuracy. Figure 9 illustrates the changes in accuracy throughout the training process. However, as the training progresses, the model gradually learns patterns and features in the data, leading to an improvement in accuracy. The accuracy graph can help us understand the behavior of the model during training. It can reveal important information such as the rate of improvement, convergence, or potential issues like overfitting or underfitting. A desired outcome is for the accuracy to increase steadily or plateau at a high value, indicating that the model has learned the underlying patterns and is performing well.
Monitoring the accuracy graph can guide decisions on when to stop training (e.g., if accuracy plateaus or starts to decrease) or adjust hyperparameters to optimize the model's performance. It provides valuable insights into the learning progress and helps assess the effectiveness of the model for the given task.
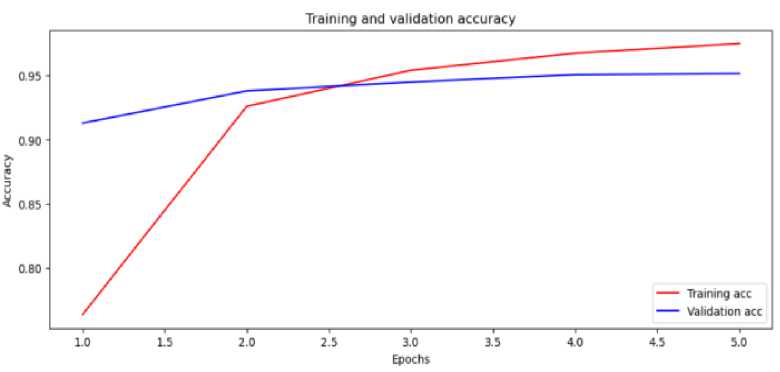
Fig.9. Accuracy graph for BERT-CNN hybrid model
A loss graph with epochs is a visual representation of how the loss of a model changes over the course of training. The loss function quantifies the discrepancy between the predicted outputs of the model and the true values in the training data. The model's convergence and its capacity to recognise underlying patterns in the data are revealed by the loss graph, which is shown in Figure 10. The number of training epochs, shown on the graph's x-axis as the number of iterations the model underwent through the training dataset. The loss function's value, which is normally a scalar measurement, is represented on the y-axis in contrast. By analysing the loss graph, we can determine how well the model is minimising the difference between expected and actual outputs. A decreasing loss value over epochs suggests that the model is gradually learning and adjusting its parameters to better fit the data. Ultimately, the loss graph helps us evaluate the model's learning process and its ability to capture meaningful patterns in the given dataset. During the initial epochs of training, the loss value is usually high as the model makes random or incorrect predictions. As the training progresses, the model adjusts its parameters to minimize the loss and improve its predictions. Consequently, the loss tends to decrease.
The loss graph provides insights into the learning process of the model. Ideally, we want the loss to decrease steadily or plateau at a low value, indicating that the model is effectively learning and capturing the patterns in the data. However, if the loss decreases too quickly or fluctuates excessively, it may indicate overfitting, where the model becomes too specialized to the training data and fails to generalize well to unseen data. Alternatively, if the loss shows little improvement or fails to decrease significantly, it may suggest underfitting, where the model struggles to capture crucial patterns within the data. By closely monitoring the loss graph, we can make informed decisions about the optimal number of training epochs. This allows us to identify when to halt the training process to avoid overfitting, where the model becomes too specialized to the training data and fails to generalize well to new, unseen data. Additionally, the loss graph aids in fine-tuning the model's hyperparameters, enabling us to optimize its performance by selecting the most effective combination of parameters. Overall, the loss graph serves as a valuable tool in guiding the training process and ensuring that the model achieves optimal performance on the given task. It provides valuable insights into the learning dynamics of the model and aids in assessing its convergence and overall effectiveness.
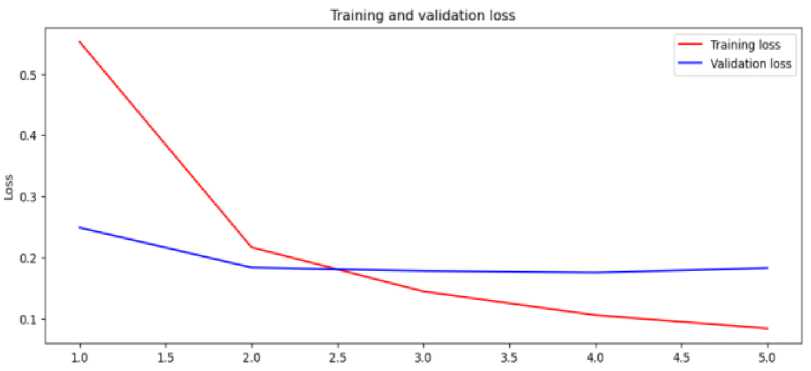
Fig.10. Loss graphs for BERT-CNN hybrid model
Both accuracy and loss graphs are important tools for evaluating the performance of a learning model. They can help identify issues such as over fitting, under fitting, and convergence problems, and guide the selection of the best hyper parameters for the model. The confusion matrix is a popular tool used in classification tasks, including depression detection on Twitter posts, to evaluate the performance of a machine learning model. It provides a tabular representation of the predicted labels against the actual labels. Here is an example of how to indicate a confusion matrix shown in Table 1.
Table 1. Confusion Matrix
|
Predicted Negative |
Predicted Positive |
|
|
Actual Negative |
True Negative (TN) |
False Positive (FP) |
|
Actual Positive |
False Negative (FN) |
True Positive (TP) |
In the context of depression detection on Twitter posts, the confusion matrix can help assess the model's ability to correctly classify posts as either positive (indicating depression) or negative (indicating non-depression). The elements of the confusion matrix are defined as follows:
True Positive (TP): The model correctly predicts a post as positive (indicating depression).
True Negative (TN): The model correctly predicts a post as negative (indicating non-depression).
False Positive (FP): The model incorrectly predicts a post as positive when it is actually negative (indicating a false alarm).
False Negative (FN): The model incorrectly predicts a post as negative when it is actually positive (indicating a missed detection).
The confusion matrix allows for the calculation of various evaluation metrics such as accuracy, precision, recall, and F1-score, which provide insights into the model's performance. Gaining insights into the strengths and limitations of a depression detection system that relies on analyzing tweets is a valuable resource. A comprehensive overview of the performance metrics achieved by the models employed in this study can be found in Table 2.
. N и mber of correct ly с I ass f ie clins tances
Accuracy=-------------------------
Totalnumberofinstances
TP
Precisian =
TP+FP
TP
Recall =-----
TP+FN
2*Precision*Recall
F1 — Score =-----------
Precision+Recall
The CNN-BERT hybrid model achieved the highest accuracy of 95%, with corresponding high scores for F1 -Score, Precision, and Recall. This indicates the model's ability to accurately detect and classify depression-related tweets. ALBERT and DistillBERT also showed respectable performance, with 85% accuracy and consistent scores across the evaluation metrics.
Table 2. Performance Metrics of the Utilized Algorithms
|
Algorithms |
Accuracy |
F1-Score |
Precision |
Recall |
|
CNN-BERT Hybrid model* |
95% |
96% |
96% |
96% |
|
ALBERT |
85% |
85% |
85% |
85% |
|
DistillBERT |
85% |
86% |
86% |
86% |
5. Future Work
In forthcoming research, exploration of potential enhancements to the depression detection approach is planned. Initially, consideration will be given to utilizing hybrid models, amalgamating diverse methodologies to leverage the strengths of each model. This strategic approach aims to augment the performance and precision of the system in identifying depression. Additionally, a pivotal aspect of the future work involves the development of a chatbot capable of engaging with users and formulating distinct user profiles based on their expressions and thoughts. This tool will facilitate prompt and seamless assistance and intervention in individuals' mental health circumstances. Furthermore, future endeavors encompass the incorporation of popular social media platforms like Facebook and Instagram, alongside Twitter, as supplementary data sources. This expansion will deepen insight into an individual's mental state, thereby enhancing the accuracy and dependability of the depression detection system. The importance of fostering a robust support network for individuals grappling with depression is also stressed. As part of a comprehensive strategy, dissemination of uplifting messages to the friends and family of those experiencing depression is intended. This initiative seeks to raise awareness about depression, foster a supportive atmosphere, and streamline the identification and treatment of the condition during its nascent stages. Moreover, integration of genetic algorithms into the model training process is on the agenda to further refine the system. By leveraging this optimization technique, the most pertinent features for depression detection can be identified, resulting in an overall enhancement in performance. This amalgamation of genetic algorithms will enable fine-tuning of the system and ensure its efficacy in accurately discerning and addressing depression.
6. Conclusion
In conclusion, our research represents a significant advancement in the field of mental health monitoring, particularly in the context of depression detection using social media data. Through the analysis of a substantial dataset comprising 149,000 depression-related tweets, we successfully identified posts indicative of depression, totaling 45,706 instances. Leveraging machine learning and deep learning models, we developed a predictive function capable of monitoring depression and predicting the likelihood of self-harm, enabling timely interventions and online consultations with mental health professionals, especially on platforms like Twitter. Our study underscores the importance of harnessing social media for mental health monitoring and demonstrates the potential of advanced models in processing and analyzing user-generated content. By employing state-of-the-art techniques, we extracted valuable insights from extensive data, making notable contributions to depression monitoring. Moving forward, our focus will be on refining and optimizing our depression monitoring system, enhancing its accuracy and effectiveness through the incorporation of additional features and data sources. Moreover, we aim to explore avenues beyond social media for mental health support, tapping into other technological advancements and diverse data sources. Through our ongoing efforts, we aspire to have a positive impact on global well-being by leveraging technology to advance mental health monitoring and intervention.
References Depression Detection: Unveiling Mental Health Insights with Twitter Data and BERT Models
- R. Chatterjee, R. K. Gupta, and B. Gupta, “Depression detection from social media posts using multinomial naive theorem,” in IOP Conference Series: Materials Science and Engineering, Jan. 2021, vol. 1022, no. 1. doi: 10.1088/1757- 899X/1022/1 /012095.
- G. Alorini, D. B. Rawat, and D. Alorini, “LSTM-RNN Based Sentiment Analysis to Monitor COVID-19 Opinions using Social Media Data,” in IEEE International Conference on Communications, Jun. 2021. doi: 10.1109/ICC42927.2021.9500897.
- M. E. Basiri, S. Nemati, M. Abdar, E. Cambria, and U. R. Acharya, “ABCDM: An Attention-based Bidirectional CNN-RNN Deep Model for sentiment analysis,” Future Generation Computer Systems, vol. 115, pp. 279–294, Feb. 2021, doi:10.1016/j.future.2020.08.005.
- S. Behl, A. Rao, S. Aggarwal, S. Chadha, and H. S. Pannu, “Twitter for disaster relief through sentiment analysis for COVID-19 and natural hazard crises,” International Journal of Disaster Risk Reduction, vol. 55, Mar. 2021, doi: 10.1016/j.ijdrr.2021.102101.
- H. Kour and M. K. Gupta, “An hybrid deep learning approach for depression prediction from user tweets using feature-rich CNN and bi- directional LSTM,” Multimed Tools Appl, vol. 81, no. 17, pp. 23649– 23685, Jul. 2022, doi: 10.1007/s11042-022-12648-y.
- Z.Hameed and B. Garcia-Zapirain, “Sentiment Classification Using a Single-LayeredBiLSTM Model,” IEEE Access, vol. 8, pp. 73992–74001, 2020, doi:10.1109/ACCESS.2020.2988550.
- H.S. Alsagri and M. Ykhlef, “Machine learning-based approach for depression detection in twitter using content and activity features,” IEICE Trans Inf Syst, vol. E103D, no. 8, pp. 1825–1832, Aug. 2020, doi:10.1587/transinf.2020EDP7023.
- N. P. Shetty, B. Muniyal, A. Anand, S. Kumar, and S. Prabhu, “Predicting depression using deep learning and ensemble algorithms on raw twitter data,” International Journal of Electrical and Computer Engineering, vol. 10, no. 4, pp. 3751–3756, 2020, doi: 10.11591/ijece.v10i4.pp3751-3756.
- WenboZheng , Lan Yan, Chao Gou ,Fei-Yue Wang,“ Graph Attention Model Embedded With Multi-modal Knowledge For Depression Detection ”,Institute of Electrical and Electronics Engineers, IEEE Computer Society, IEEE Circuits and Systems Society, IEEE Communications Society, and IEEE Signal Processing Society, 2020 IEEE International Conference on Multimedia and Expo (ICME) : 06-10 July 2020,London, UK.
- M.Trotzek, S. Koitka, and C. M. Friedrich, “Utilizing Neural Networks and Linguistic Metadata for Early Detection of Depression Indications in Text Sequences,” IEEE Trans Knowl Data Eng, vol. 32, no. 3, pp. 588–601, Mar. 2020, doi: 10.1109/TKDE.2018.2885515.
- Bhargava C, Poornima S, Mahur S, PushpalathaM.Depression Detection Using Sentiment Analysis of Tweets. Vol. 12, Turkish Journal of Computer and Mathematics Education. 2021.
- H. Kaur, S. UlAhsaan, B. Alankar, and V. Chang, “A Proposed Sentiment Analysis Deep Learning Algorithm for Analyzing COVID-19 Tweets”, doi: 10.1007/s10796-021- 10135-7/Published.
- P. P. A., “Performance Evaluation and Comparison using Deep Learning Techniques in Sentiment Analysis,” Journal of Soft Computing Paradigm, vol. 3, no. 2, pp. 123–134, Jul. 2021, doi: 10.36548/jscp.2021.2.006.
- M. Divyapushpalakshmi and R. Ramalakshmi, “An efficient sentimental analysis using hybrid deep learning and optimization technique for Twitter using parts of speech (POS) tagging,” Int J Speech Technol, vol. 24, no. 2, pp. 329–339, Jun. 2021, doi: 10.1007/s10772-021- 09801-7
- M. L. Joshi and N. Kanoongo, “Depression detection using emotional artificial intelligence and machine learning: A closer review,” Mater Today Proc, vol. 58, pp. 217– 226, Jan. 2022, doi: 10.1016/j.matpr.2022.01.467.
- N. V. Babu and E. G. M. Kanaga, “Sentiment Analysis in Social Media Data for Depression Detection Using Artificial Intelligence: A Review,” SN ComputSci,, vol. 3, no. 1, Jan. 2022, doi: 10.1007/s42979-021-00958-1.
- https://www.researchgate.net/figure/Keywords-and-phrases-search-terms_tbl2_282633445
