Design and Development of a Web-Based Information System for Palm Oil Plantations: A Case Study of PT Kaltim Utama Plantation I

Author: Asep Nurhuda, Agus Ganda Permana, Reza Andrea, Aulia Khoirunnita
Journal: International Journal of Education and Management Engineering @ijeme
Article in issue: 2 vol.16, 2026.
Free access
This research aims to develop and assess an information system for managing daily operations in the palm oil plantation industry, specifically for PT Kaltim Utama Plantation I. As a crucial part of Indonesia's economy, the palm oil sector faces numerous operational challenges, such as tracking activities, monitoring resources, and generating accurate reports. The designed system focuses on enhancing processes like spraying, land clearing, fertilizing, and harvesting. The study utilizes the System Development Life Cycle (SDLC) methodology, following the waterfall model, which includes the stages of analysis, design, implementation, testing, and maintenance. In the analysis phase, system requirements were identified to meet operational demands. The design phase involved creating workflows and data structures to represent plantation operations. The outcome is a web-based information system prototype that streamlines management processes, centralizes data, and improves reporting precision. The system is aimed at simplifying information retrieval, increasing operational efficiency, and aiding decision-making. The implementation is expected to address operational inefficiencies at PT Kaltim Utama Plantation I by reducing manual processes. Additionally, the system includes data visualization tools to quickly evaluate plantation performance and offers scalable features for future growth.
Information System, System Design, Plantation Management, Palm Oil Industry, SDLC
Short address: https://sciup.org/15020331
IDR: 15020331 | DOI: 10.5815/ijeme.2026.02.02
Text of the scientific article Design and Development of a Web-Based Information System for Palm Oil Plantations: A Case Study of PT Kaltim Utama Plantation I
-
1. Introduction
The agricultural and plantation sector plays a pivotal role in the Indonesian economy, particularly in generating significant foreign exchange earnings. According to official data, palm oil exports in 2022 were valued at approximately USD 28.7 billion, establishing Indonesia as the largest exporter of palm oil globally [1]. This underscores the sector's critical contribution to the nation's economic development. Furthermore, Indonesia's production of crude palm oil reached approximately 48.8 million metric tons in the same year, reaffirming its position as the world's leading producer [2].
-
2. Theoretical Foundation
As the oil palm plantation sector expands, it faces challenges requiring effective management strategies. Plantation management is crucial for sustainable development in a dynamic environment, with key considerations including the complexity of environmental factors, intricate agricultural structures, and the integration of technology into operations [3,4]. The application of information technology (IT) in managing palm oil plantations can help companies optimize production processes and increase efficiency. A web-based information system enables real-time monitoring of field activities, essential for extensive plantation areas in remote locations [5,6,7]. These systems facilitate accurate and integrated data collection, simplifying analysis and planning for future operations [8].
Integrated systems, such as those assessing regional investment potential, demonstrate how data analytics and IT enhance decision-making in plantation management [9]. The implementation of IT systems has also significantlyimproved operational workflows in palm oil plantations [10,11]. For instance, PT Kaltim Utama Plantation I, managing a 69,071 hectare plantation area in East Kalimantan. Emphasizes sustainability and corporate social responsibility. Frameworks like the Roundtable on Sustainable Palm Oil (RSPO), which establish standards for sustainable production, address significant sustainability challenges in the industry [12]. Additionally, intelligent transport systems (ITS) and other advanced decision-making tools have further optimized logistics and operations in plantation management [13].
Climate change and deforestation pose critical challenges for plantation management [14]. The unpredictability of rainfall patterns due to climate change necessitates advanced weather forecasting technologies and agronomic practices [15]. IT solutions, such as certainty factor algorithms for diagnosing oil palm diseases, offer practical approaches to address these challenges. By leveraging historical data and expert knowledge, these algorithms assess disease risks, enabling timely interventions [16]. Combined with real-time data analysis, such tools contribute to long-term sustainability by reducing losses and promoting proactive management practices [17].
Education and knowledge-sharing are vital for overcoming challenges in the plantation sector. Problem-projectbased learning methods have enhanced understanding of technical applications and can be adapted for plantation contexts [18]. Implementing report recording systems and analytical tools underscores the importance of structured data management in agricultural operations [19]. Regulatory frameworks, such as legal aid for marginalized communities, provide insights into aligning plantation operations with broader governance standards [20].
The development and implementation of web-based information systems are integral to achieving sustainable growth in the plantation sector. These systems streamline planning, control, and reporting activities while supporting strategic planning and sustainability goals [21,22]. Web-based systems enhance transparency and operational efficiency through the integration of modern technology into everyday practices [23,24]. Companies like PT Kaltim Utama Plantation I exemplify the role of these systems in enhancing transparency and efficiency in regions like Riau and Jambi [24].
The aim of this research is to design a web-based information system that facilitates employees at oil palm plantation companies in planning, controlling, and reporting daily activities, particularly in plantation areas. This system is expected to enhance operational efficiency, support data-driven decision-making, and provide transparency for stakeholders regarding work results and daily activities in the field.
-
A. Data and Information
There are numerous perspectives and debates regarding data, information, and their interrelationships. Data is described as symbols representing objects, events, or the surrounding environment [25]. By itself, data holds no value until it is processed into a usable form. Information, on the other hand, provides answers to questions such as who, what, when, and how much. Information systems are designed to generate, store, retrieve, and process data. Information is derived from data, which consists of symbols and signals that can be stored and interpreted. These symbols may take the form of text, numbers, diagrams, or images, while signals might include sensory elements like sound, smell, or taste. Information is essentially a message with relevant meaning or input for making decisions and taking actions [26]. It provides explanations and answers to questions starting with who, why, where, when, and how much [27].
-
B. System
A system can be characterized as a set of interconnected components working together to achieve specific outcomes. Systems consist of integrated elements that share a common goal [28].
C. Information Systems
3. Method3.1. Use Case
An information system refers to a structured arrangement of people, data, processes, and technology that interact to collect, process, store, and provide information needed by an organization [28]. Such systems are designed to manage information through activities like capturing, transmitting, storing, retrieving, manipulating, and displaying it [29]. They incorporate various forms of technology, such as computers, software, databases, communication networks, and the internet. These technologies perform specific tasks and enable interactions with different stakeholders within the organization. Additionally, information systems facilitate data collection, storage, retrieval, and processing, often in a sequential manner. Statistical and arithmetic operations are also commonly performed [30].
At present, the organization employs a manual reporting system, relying on assistants and supervisors to record data manually before forwarding it to administrators for documentation. To improve efficiency, a newly designed system should support functions such as documenting spraying activities and associated materials, recording fertilization results, capturing harvest data, managing inventory of tools and materials, and generating reports for wages and production outcomes.
Currently, the company operates a manual reporting system and does not utilize computerized solutions. All data recording is performed manually by assistants and foremen before being submitted to the administrator for final documentation. In designing this information system, several functions are required, such as recording the results of spraying work along with the materials used, documenting the items needed for swipe work, and recording the results of fertilization work along with associated materials. Additionally, the system should capture harvest data from production land, report the outcomes of goods and fieldwork, manage the inventory of materials and equipment, and generate salary and wage reports.
In designing this system, the Unified Modeling Language (UML) was used as a tool to explain the system's functional requirements model. This modeling was carried out using use case diagrams and activity diagrams. UML provides a standardized way to visualize the interactions between system components, ensuring clarity in design and implementation. The use case diagram explains how the relationships and roles occur between the actors involved in the system, consisting of actors, use cases, and the relationships between them. Meanwhile, the activity diagram is a technique for describing procedural logic and workflows, allowing each user to carry out activities on the system efficiently.
The use case diagram shown in Fig. 1. illustrates the interaction between three primary actors such as admin, assistant, and supervisor, and their roles in the web-based information system.
-
1. Admin is responsible for managing the entire system, overseeing report reviews, inventory management, and ensuring operational efficiency.
-
2. Assistant performs field tasks such as spraying, pruning, fertilizing, and harvesting, while accurately recording operational data into the system.
-
3. Supervisor supervises tasks performed by Assistants, validates the recorded data for accuracy, and submits comprehensive reports to the admin for review.
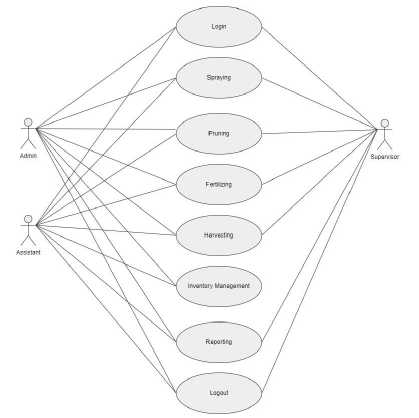
Fig. 1. Use Case Diagram
The diagram outlines eight core functions critical to effective workflow management:
-
1. Login provides secure access to role-specific functionalities, ensuring data protection and accountability.
-
2. Spraying enables assistants to log schedules and details of spraying activities, while supervisors monitor execution to ensure compliance with standards.
-
3. Pruning records pruning operations aimed at maintaining crop health. Supervisors validate the accuracy and quality of these records.
-
4. Fertilizing tracks fertilizer application, ensuring proper alignment with plantation requirements. Supervisors verify the data to maintain optimal crop growth.
-
5. Harvesting logs harvest details, such as dates, yields, and distribution plans, validated by supervisors for admin analysis and planning.
-
6. Inventory management allows admins and supervisors to oversee resource availability, such as tools and harvested products, ensuring balanced stock levels.
-
7. Reporting compiles operational and resource usage data into detailed reports, aiding Admins in strategic decision-making.
-
8. Logout ensures system security by requiring users to log out after task completion, preventing unauthorized access.
-
3.2. Spraying Activity Diagram
The spraying activity diagram shown in Fig. 2. illustrates workflow of the spraying process, highlighting interactions between the assistant and the system to ensure effective task execution and data management.
-
1. The assistant initiates the process by selecting the spraying button on the system interface. This action prompts the system to display a form for recording relevant details, including pesticide types, quantities, and target areas.
-
2. The assistant inputs the necessary data into the form, ensuring accurate documentation of spraying activities to maintain consistency in operational records.
-
3. Upon completing the data entry, the assistant submits the information by pressing the submit button.
-
4. The system performs data validation to ensure the completeness and accuracy of the entries. If any errors or incomplete data are detected, the system alerts the assistant to make corrections, thereby maintaining data integrity.
-
5. Once validated, the system securely saves the spraying data into the database. This step ensures the information is accessible for monitoring, reporting, and decision-making by supervisors and admins.
-
6. The process concludes when the spraying data is successfully saved, enabling the assistant to proceed with other tasks or exit the system.
-
3.3. Clearing Activity Diagram
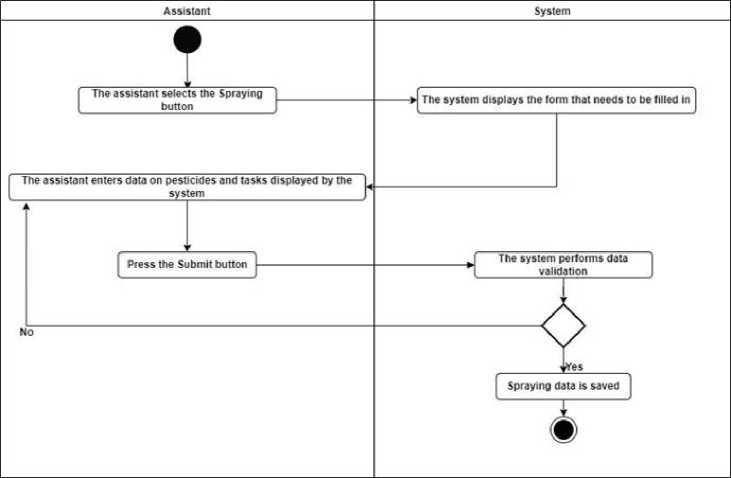
Fig. 2. Spraying Activity Diagram
The clearing activity diagram shown in Fig. 3. illustrates the workflow of an automated process for managing spraying data within a system. This process highlights the interaction between the assistant and the system, ensuring that all entered data is valid and complete.
-
1. The process begins with the assistant selecting the clearing button on the system interface, which initiates the activity of entering spraying-related data.
-
2. The assistant fills in the form with relevant information based on the provided instructions. The data typically includes specific details about pesticides and defined tasks, ensuring accurate and comprehensive recordkeeping.
-
3. After completing the form, the assistant presses the submit button to send the data to the system for validation.
-
4. The system validates the submitted data to ensure that all fields are properly filled and the input format is correct. This validation serves as a quality control measure to prevent errors or incomplete records.
-
5. If the data is invalid, the system notifies the assistant to revise any incorrect or incomplete entries. If the data is valid, the spraying data is recorded into the system and considered ready for further use.
-
6. After successful validation, the verified data is stored in the database. This marks the end of the clearing activity, ensuring that the information is accessible for operational and analytical purposes.
-
3.4. Fertilization Activity Diagram

Fig. 3. Clearing Activity Diagram
The fertilization activity diagram shown in Fig. 4. illustrates the systematic workflow for managing fertilizer application within the system. This process demonstrates the integration of automation and validation to ensure the accuracy and reliability of recorded data, thereby supporting effective and sustainable agricultural practices.
-
1. The process begins when the assistant selects the fertilization button in the system interface. This action triggers the system to initialize the necessary resources for data input.
-
2. The system displays a digital form designed for recording essential details, such as fertilizer type, dosage, application methods, and specific tasks.
-
3. The assistant inputs all required information into the form, ensuring accuracy in critical data points, including fertilizer type, dosage amount, and target application areas.
-
4. Once the form is completed, the assistant presses the submit button, prompting the system to validate the data automatically.
-
5. The system performs a comprehensive validation of the submitted data, checking for completeness, correctness, and compliance with predefined standards such as dosage limits and proper field identification.
-
6. If errors or inconsistencies are detected, the system provides feedback, enabling the assistant to make corrections and resubmit the data. Validated data is saved directly into the database.
-
7. After successful validation, the system stores the verified data in its database. This marks the conclusion of the fertilization process, with the saved data becoming part of the system's records for subsequent analysis, reporting, and decision-making
-
3.5. Harvesting Activity Diagram
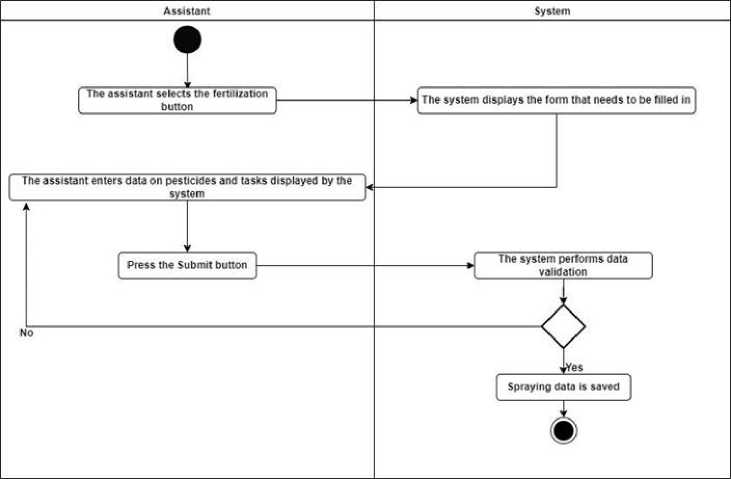
Fig. 4. Fertilization Activity Diagram
The harvesting activity diagram shown in Fig. 5. illustrates the workflow for managing harvesting activities. This process supports productivity analysis, equipment efficiency monitoring, and payroll alignment with harvest outcomes. By streamlining data management and validation, it plays a critical role in optimizing field operations and enhancing agricultural efficiency.
-
1. The assistant begins by selecting the Harvesting button on the system interface. This action prompts the system to prepare the necessary resources and digital forms for data input.
-
2. The system displays a digital form with designated fields for critical harvesting data. These fields include crop type, harvested quantity, assigned worker tasks, and harvesting methods.
-
3. The assistant fills out the form, ensuring the accurate entry of essential details such as crop identification, total quantity harvested, and specific task assignments for workers.
-
4. Upon completing the form, the assistant presses the Submit button. This action transitions the workflow to the system's automated validation phase.
-
5. The system performs a comprehensive review of the submitted data, checking for completeness, accuracy, and compliance with predefined rules. For example, the system verifies that the harvested quantity aligns with expected ranges and that all required fields are correctly filled.
-
6. If any issues or inconsistencies are identified, the system provides immediate feedback, pinpointing specific errors for correction. The assistant revises the data and resubmits the form to ensure compliance.
-
7. Once validated, the data is securely stored in the system's database. This stored information becomes a reliable source for future analysis, generating reports, and supporting strategic decision-making in agricultural operations.
-
8. The workflow concludes with a confirmation message indicating that the harvesting data has been successfully saved. This final step ensures the availability of accurate records for traceability, performance evaluations, and audits.
-
3.6. Activity Report Diagram

Fig. 5. Harvesting Activity Diagram
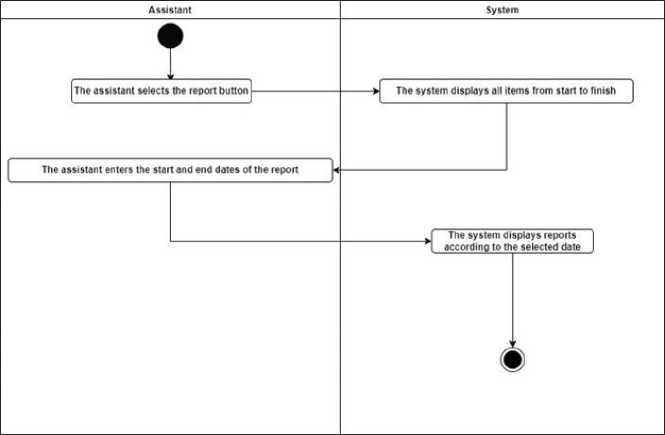
The activity report diagram in Fig. 6. illustrates the workflow for generating reports within the system. This process enables efficient retrieval and review of activity records based on specific date ranges, facilitating data accessibility for analysis and decision-making.
1. The process begins when the assistant selects the report button on the system interface, prompting the system to display options for report generation.
2. The system presents a comprehensive list of recorded activities, covering all logged data from the system's inception to the current date.
3. The assistant specifies the desired date range by entering the start and end dates, allowing the system to filter records accordingly.
4. Based on the selected date range, the system retrieves the relevant data from its database and generates a report tailored to the specified period.
5. The system displays the generated report, summarizing activities within the chosen date range. This summary may include metrics, performance data, and other logged operational details.
6. The process concludes with the assistant reviewing the report. The system ensures that the report is available for further analysis, export, or record-keeping.
 4. Result and Discussion
Fig. 6. Activity Report Diagram
To be able to access the system, first all users log in by entering their username and password correctly and the system will display the home page as the main display. On the main page, users can select menus based on their functions, as illustrated in Fig. 7. In this menu there is also an employee menu as an additional menu for inputting and managing employee data. There is also a location menu for managing existing plantation locations.
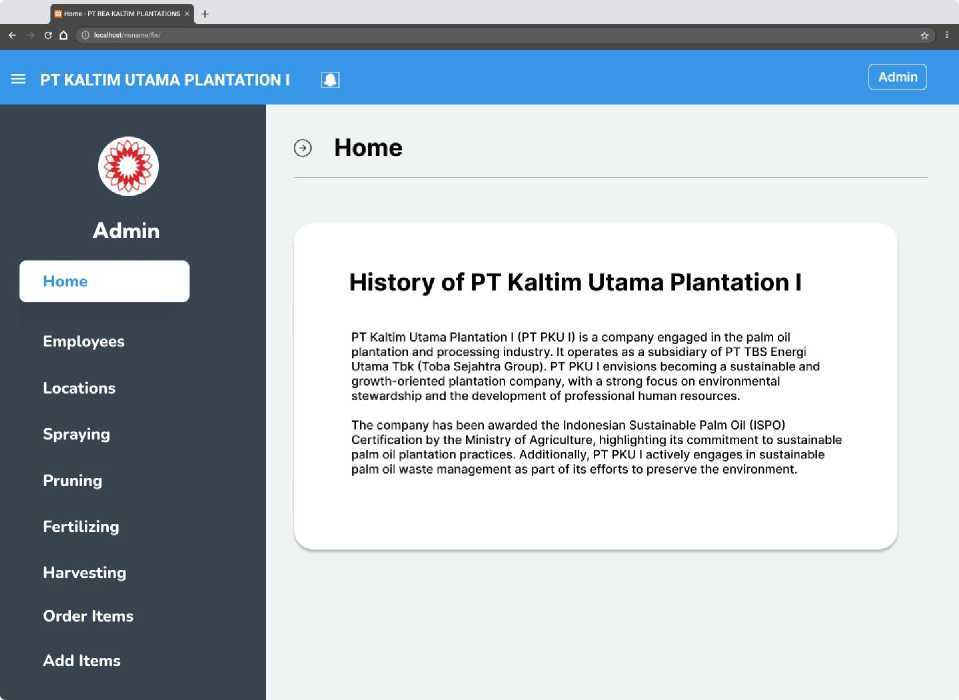
Fig. 7. Home Page
In the home menu, there is also a spraying menu, as seen in Fig. 8. The Spraying Page is designed to facilitate the efficient management of pesticide spraying activities, by streamlining the processes of recording, updating, and analyzing spraying data. Assistants can input detailed information about the spraying activity, which includes:
-
1) Date of Spraying: Ensures precise time tracking for historical analysis and monitoring.
-
2) Work Location: Standardizes data categorization by operational areas through a predefined dropdown list.
-
3) Employee Name: Enhances accountability and minimizes input errors by selecting from a dropdown menu.
-
4) Pesticide Used: Accurately tracks the type of pesticide applied, chosen from a predefined system list.
-
5) Plant Maintenance Activity: Contextualizes operations by specifying associated tasks such as weed control or pest eradication.
-
6) Dosage: Monitors pesticide quantities to ensure cost-effective and efficient resource management.
These functionalities enable comprehensive tracking and analysis of pesticide usage, efficient resource allocation, and detailed performance monitoring. By organizing data systematically, the system supports informed decision-making on pest and weed control strategies, cost optimization, and employee performance evaluation.
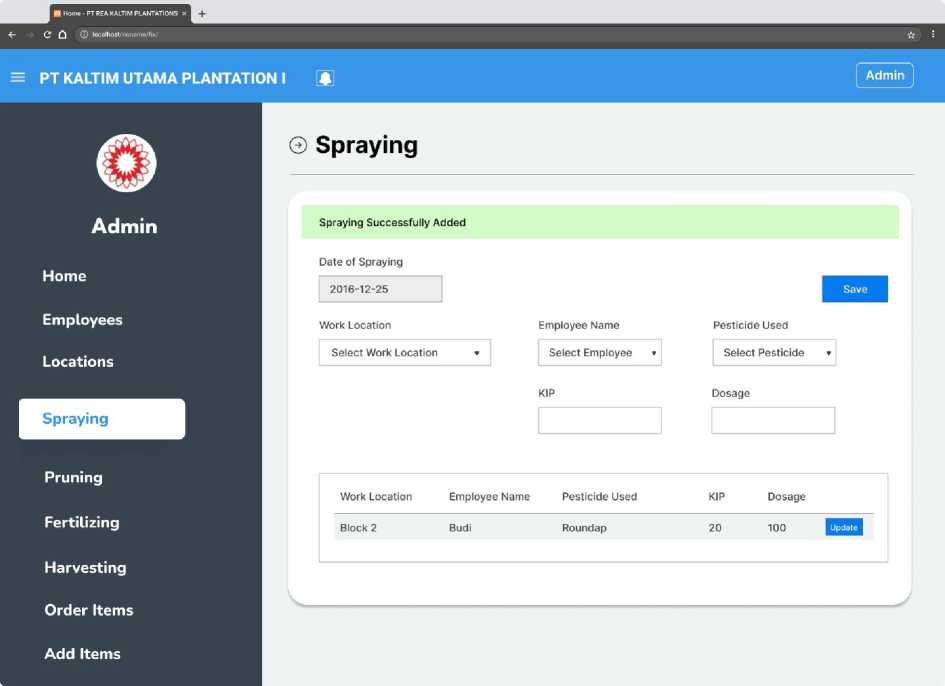
Fig. 8. Spraying Page
After spraying the weeds, the next step is clearing the plantation area of weeds and cleaning the stalks of oil palm trees. The clearing menu, as illustrated in Fig. 9., enables efficient input and management of clearing work data.
-
1) Start and End of Pruning: Records the start and end dates of pruning activities, facilitating task duration tracking and scheduling.
-
2) Work Location: Allows selection of the specific pruning location from a dropdown menu, ensuring accurate data categorization by operational area.
-
3) Employee Name: Enables selection of the responsible employee from a predefined list, minimizing input errors and promoting accountability.
-
4) Machete: Tracks the tools or equipment used during pruning, supporting resource monitoring and maintenance planning.
-
5) Total Work: Total area or scope of pruning tasks, providing measurable indicators for work assessment.
The Clearing Menu enhances plantation management by systematically recording pruning activities for future reference and analysis. It supports monitoring of tools, employee performance, and work areas, ensuring efficient resource allocation. Additionally, it enables managers to track employee contributions and verify task completion, fostering accountability and informed decision-making to improve productivity.
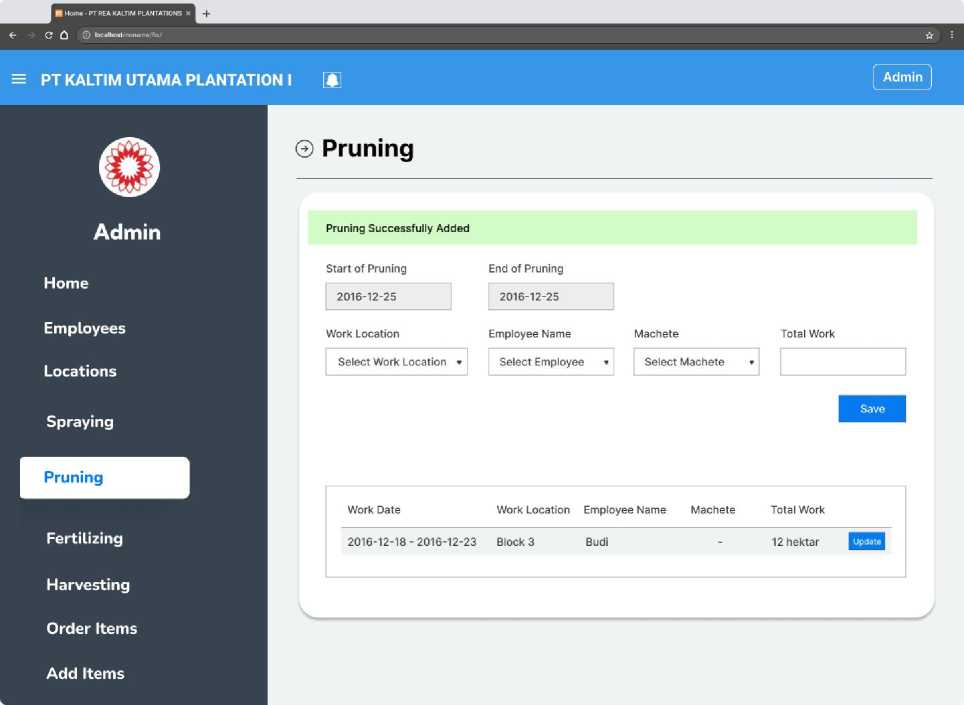
Fig. 9. Pruning Page
-
1) Fertilization Date: Date of the fertilization activity.
-
2) Work Location: Specific location within the plantation.
-
3) Employee Name: Name of the employee performing the task.
-
4) Fertilizer Type: Type of fertilizer used.
-
5) Dosage: Amount of fertilizer applied per unit of work.
-
6) Total Work: User-entered data reflecting the total area or volume covered.
The Fertilizing Page, as illustrated in Fig. 10., is an integral component of a plantation management system designed to document fertilization activities manually. This includes recording employee details, fertilizer types, and dosages applied.
After filling out the fields, once the fields are completed, users click save to store the entry. The data is displayed in a summary table, showing key details such as location, employee name, fertilizer type, dosage, and total work completed.
This page enhances record-keeping efficiency by providing a structured format for tracking daily fertilization activities. The data aids supervisors and managers in reviewing employee performance, monitoring fertilizer usage, and planning future activities tailored to specific location needs.
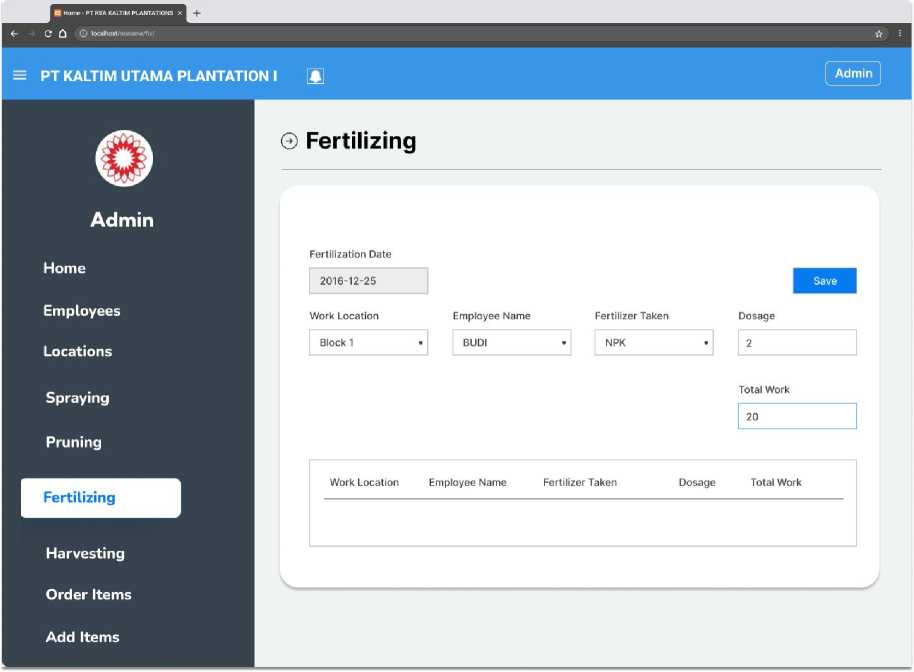
Fig. 10. Fertilizing Page
The harvesting page, as illustrated in Fig. 11., offers a structured interface that enables users to log essential data, ensuring comprehensive tracking of all key aspects of the harvesting process. This functionality is crucial for maintaining accurate operational records and improving plantation management.
-
1) Harvest Date: Specifies the date on which the harvesting activity is conducted.
-
2) Work Location: Refers to the specific plantation block or area where harvesting occurs, selectable from a dropdown menu.
-
3) Number of Employees: Indicates the total workforce involved in the harvesting operation.
-
4) Tool: Represents the type of tool or equipment utilized during the process, also selected via a dropdown menu.
-
5) Quantity: Denotes the amount of produce harvested, measured in predefined units.
-
6) Tonnage and Bunches: These fields allow users to input the total harvested weight and additional operational notes, such as transportation details.
This page plays a pivotal role in facilitating the documentation of harvesting activities, ensuring that key information is consistently recorded for future reference. By capturing data on employee involvement, equipment usage, and output volume, it enables supervisors to monitor real-time operations efficiently.
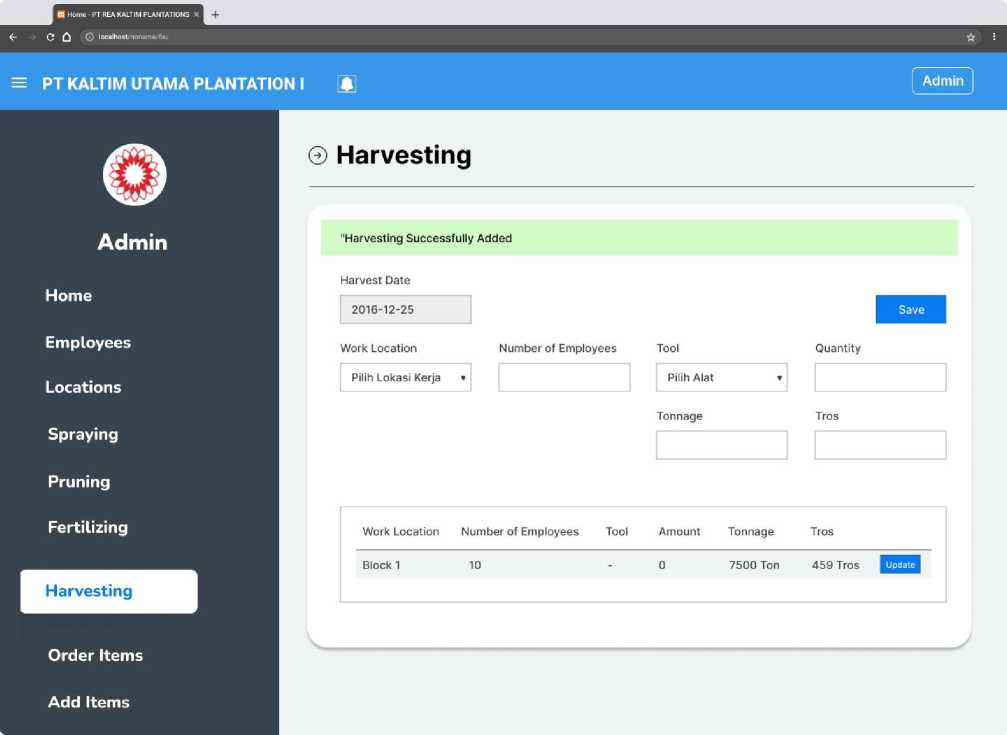
Fig. 11. Harvesting Page
After all the data has been entered into the system, a report can be generated to display activities related to spraying, clearing, fertilization, and harvesting. To view the spraying results, users can access the Work Report menu under the Spraying submenu, as shown in Fig. 12.
This menu presents a detailed report of all spraying activities conducted over a specified period. Users can filter the report by selecting a time range using the start date and end date fields. This feature enables customized data display, allowing users to focus on activities performed within the chosen timeframe.
-
1) No: Sequential number for each record.
-
2) Employee name: The name of the worker involved in the activity.
-
3) Material: The type of chemical used.
-
4) Used units: The quantity of material applied.
-
5) Work results: The total area covered in hectares.
-
6) Location: The specific work location.
-
7) Wages: The amount paid for the completed activity.
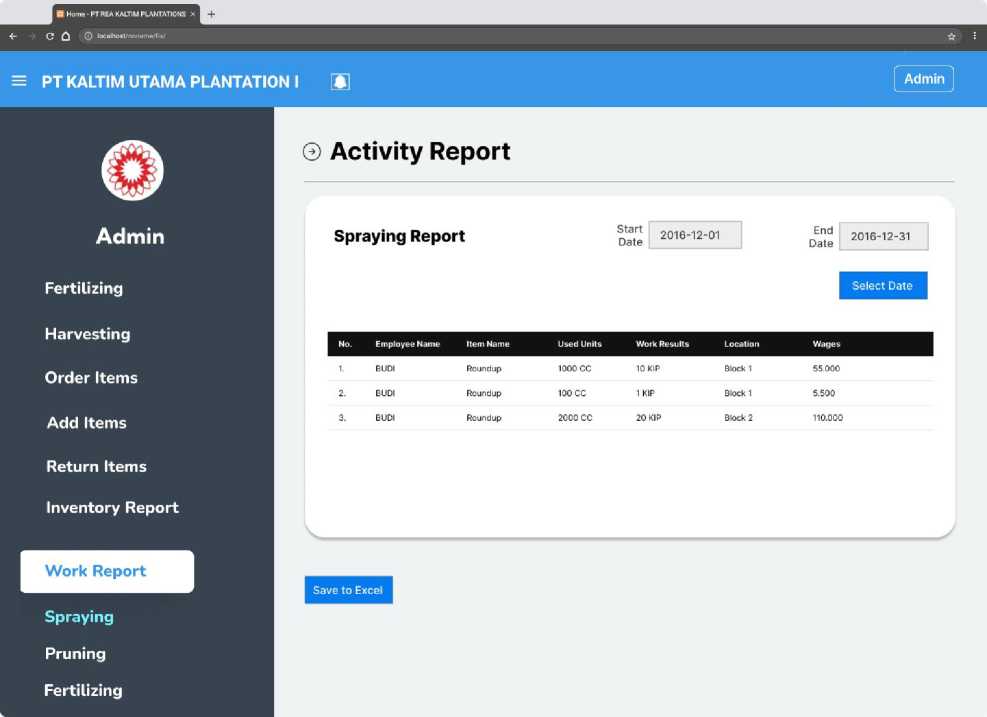
Fig. 12. Spraying Work Report Page
The work report pruning page, illustrated in Fig. 13., is an integral part of the activity management system at PT Kaltim Utama Plantation I. It is designed to present pruning activity reports in a clear and structured format. The table on this page includes the following fields:
-
1) No: Sequential number for each record.
-
2) Employee name: The name of the worker involved in pruning activities.
-
3) Item name: The tool used during pruning.
-
4) Used units: The quantity of tools utilized.
-
5) Work results: The output of pruning activities, such as the area covered in hectares.
-
6) Location: The specific work location.
-
7) Wages: The wages earned by the worker for the activity.
Additionally, a save to excel button is provided, enabling users to download the report in excel format for convenient storage and sharing.
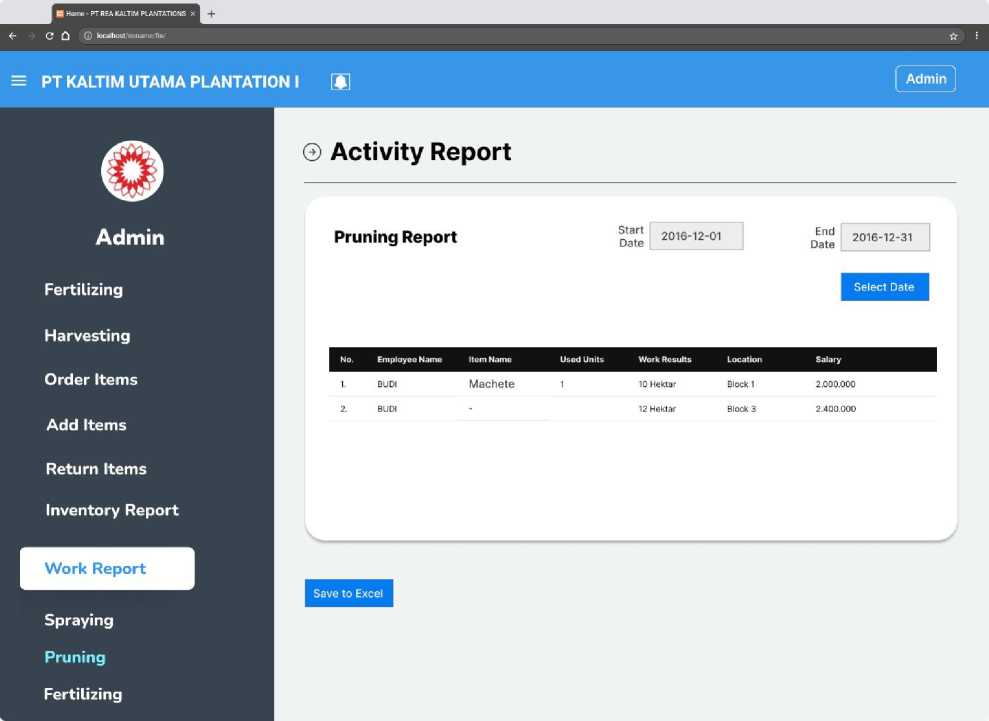
Fig. 13. Work Report Pruning Page
The harvesting work report menu, as shown in Fig. 14., provides detailed information about harvesting activities. This page enables users to generate reports based on specific date ranges. Users can select a time period to access comprehensive data, including the number of employees involved, harvested items, used units, crop yields, locations, and salaries paid.
-
1) No: Sequence number of the data entry.
-
2) Total employees: The number of workers involved in the harvesting activity.
-
3) Item name: The name of the harvested item.
-
4) Used unit: The unit measurement used for the harvested item.
-
5) Tros: This term refers to the number of fresh fruit bunches (FFB) obtained from the production area. Fresh fruit bunches are clusters of oil palm fruit that are still attached to the stalk and are ready to be processed.
-
6) Tonnage: The weight of the harvested crops in tons.
-
7) Location: The specific geographical location of the harvest.
-
8) Salary: The total wages paid for the harvesting activity.
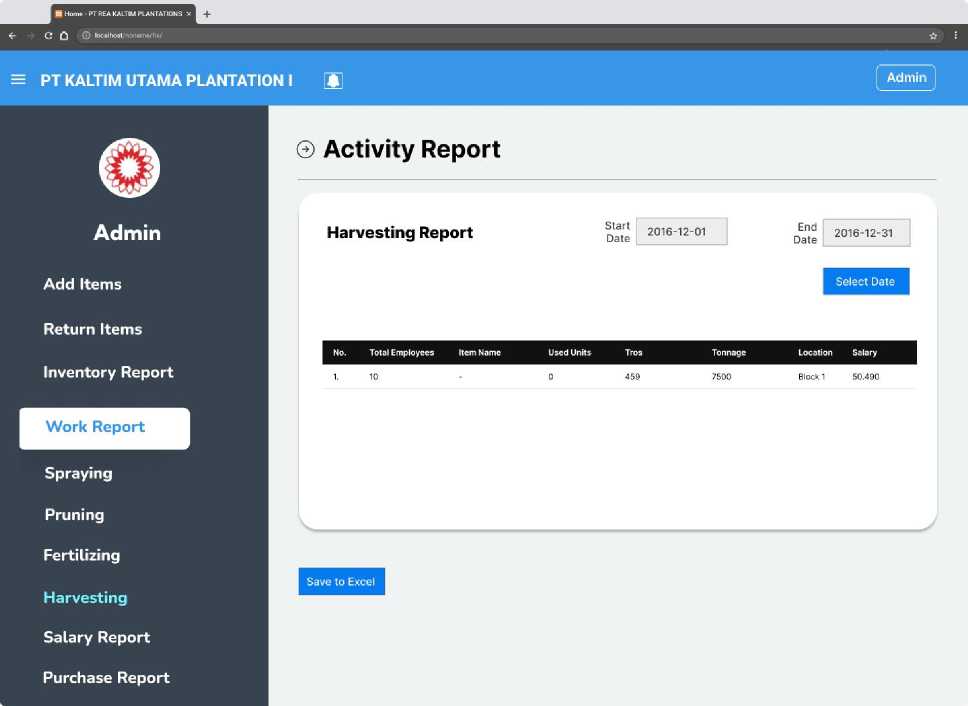
Fig. 14. Harvesting Work Report Page
The system provides functionality for managing workers' payroll reports, calculated based on their work results. The Salary Reports Menu, as shown in Fig. 15., simplifies salary management and documentation. With date filters and an export feature, the menu ensures that salary reports are well-organized and easily accessible for analysis or sharing.
The salary data is categorized based on specific work activities to provide clear and structured information. Categories include Spraying Salary, which details salary data related to spraying activities, and Pruning Salary, which outlines salary information for pruning tasks. These categories align payroll reports with the type of work performed, making it easier to monitor and evaluate workers' contributions.
-
1) Employee name: The name of the worker.
-
2) Farm name: The plantation where the activity was conducted.
-
3) Used area: The area covered during the work.
-
4) Work results: The output of the activity.
-
5) Location: The specific location where the activity took place.
-
6) Salary: The amount earned by the worker for the activity.
-
7) Subtotal: The total salary calculated for each activity category.
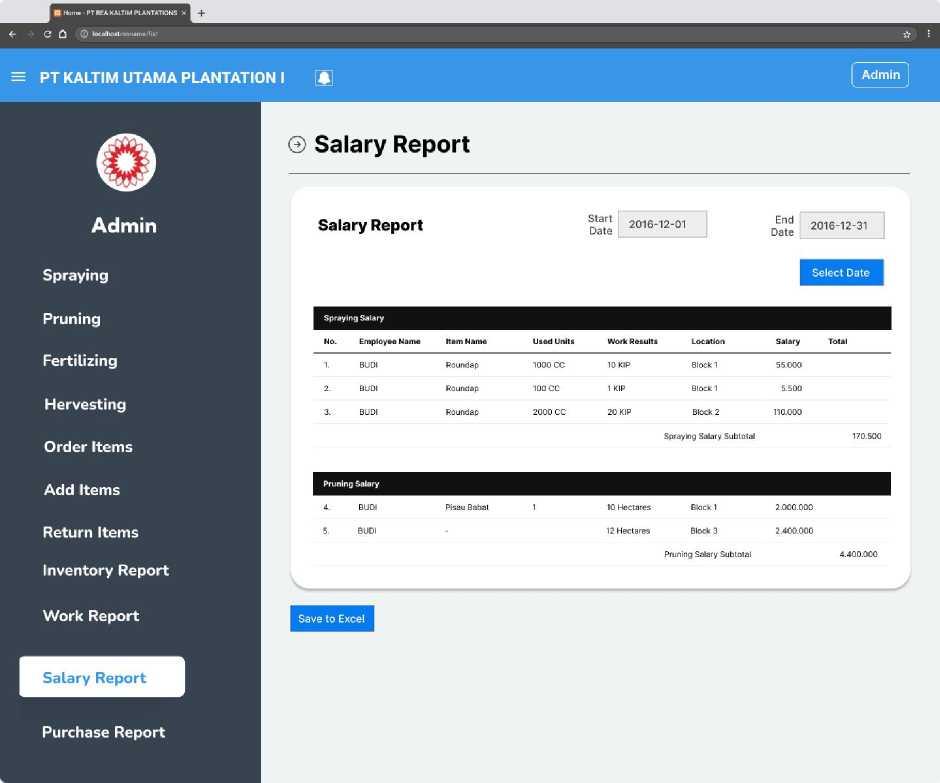
Fig. 15. Salary Report
The system designed for managing field activities in plantations, such as spraying, fertilizing, clearing, and harvesting, has been developed to simplify user data management with automated reporting features. If the system has been tested at PT Kaltim Utama Plantation I, testing results indicate that the system reduces reporting time from an average of two hours per report to just 30 minutes. The system also enables automatic generation of reports in excel format, replacing the previous manual process. Users, including administrators and field assistants, provided positive feedback regarding the ease of navigation, particularly in the data input and reporting features. Field supervisors found that the system facilitates daily activity tracking and enhances operational efficiency.
If the system has not been tested, the main reason is the limited research timeframe and field conditions that require additional preparation. Therefore, conducting trials within PT Kaltim Utama Plantation I involving end-users such as administrators, assistants, and supervisors is recommended. These trials are expected to provide insights into the system's performance and identify areas requiring further refinement.
This research also encountered several limitations. The limited development timeline caused the system to not fully address all operational needs in the plantation. Budget constraints restricted the integration of advanced features such as predictive analytics or IoT sensor integration for real-time field monitoring. The current system is only available in a web-based version, requiring internet connectivity, which poses a challenge for users working in areas with low connectivity.
Table 1. Alpha Test
|
No |
Question |
Answer |
Explanation |
Calculation |
|
1 |
What role is responsible for overseeing the entire system and ensuring operational efficiency in the information system at PT Kaltim Utama Plantation I? |
Admin |
The Admin is responsible for managing the entire system, overseeing report reviews, inventory management, and ensuring operational efficiency. |
Admin ensures the system is properly managed, leading to increased operational efficiency. |
|
2 |
Which activity does the assistant log after selecting the 'Spraying' button in the system? |
Spraying activity including pesticide types, quantities, and target areas. |
After selecting the 'Spraying' button, the assistant enters relevant details such as pesticide types, quantities, and target areas. |
Assistant logs detailed data which helps in accurate spraying operation tracking. |
|
3 |
How does the system ensure data integrity when spraying data is entered by the assistant? |
The system validates the entered data for completeness and accuracy, alerting the assistant if any errors are detected. |
If errors or incomplete data are detected, the system alerts the assistant to make corrections. |
The system alerts for errors, maintaining high data integrity by reducing errors in field data. |
|
4 |
What is the purpose of the 'Inventory Management' function in the system? |
To oversee the availability of resources, such as tools and harvested products, ensuring balanced stock levels. |
This function allows admins and supervisors to monitor resource availability, ensuring smooth operations. |
The Inventory Management function ensures resources are balanced, avoiding overstocking or shortages. |
|
5 |
In the Harvesting activity, which key details must be recorded? |
Harvest date, work location, number of employees, tool used, quantity harvested, tonnage, and bunches. |
These details are critical to monitoring harvesting operations, ensuring data completeness. |
The system tracks all key harvesting details, providing precise data for monitoring productivity. |
|
6 |
What does the 'Reporting' function allow users to do? |
It compiles operational and resource usage data into detailed reports, aiding admins in strategic decisionmaking. |
The report function compiles data on activities such as spraying, clearing, and harvesting for evaluation. |
Reporting function helps admins make informed decisions by analyzing complete operational data. |
|
7 |
How does the system handle 'Fertilizing' activities? |
It records details like fertilization date, work location, employee name, fertilizer type, dosage, and total work performed. |
This information is necessary for tracking fertilizer usage, monitoring employee performance, and resource allocation. |
Fertilizing activity is accurately recorded, improving resource allocation and employee performance monitoring. |
|
8 |
What benefit does the 'Activity Report' feature provide for field workers? |
It enables the review of all activities based on a specific date range, supporting analysis and decisionmaking. |
This feature is essential for evaluating field activity performance and making adjustments to improve operations. |
The Activity Report feature allows for precise performance evaluation and operational adjustments. |
|
9 |
Which of the following is NOT included in the Fertilizing Activity Diagram? |
Harvesting quantity. |
The fertilizing activity diagram only tracks details related to fertilization, not harvesting quantity. |
Harvesting quantity is excluded, making the fertilizing diagram focused on specific fertilization tasks. |
|
10 |
What is the primary function of the 'Salary Reports' menu in the system? |
To generate salary reports based on work results, categorized by activity type (spraying, pruning, harvesting). |
The Salary Report provides a structured and detailed breakdown of wages paid based on employee activities. |
Salary Reports ensure accurate wage calculations based on field activity, improving payroll management. |
Table 1 show, that each feature in the developed information system has a positive impact on operational efficiency at PT Kaltim Utama Plantation I. Features like the "Admin" role ensure better system management, thus enhancing overall operational efficiency. Data validation systems in "Spraying" and "Fertilizing" activities help maintain data integrity by detecting and correcting errors, reducing the likelihood of input mistakes. The "Inventory Management" feature helps maintain balanced stock levels, preventing overstocking or shortages of resources. The "Activity Report" feature allows for more accurate performance evaluation, supporting better decision-making. All these features contribute to more efficient management, greater transparency in plantation operations, and ultimately improved productivity and reporting accuracy.
5. Conclusion
This study resulted in an information system designed to manage field activity data, such as spraying, fertilizing, clearing, and harvesting, as well as inventory data for materials and equipment at PT Kaltim Utama Plantation I. The system has the potential for immediate implementation, particularly in improving operational efficiency and data accuracy. By implementing this system, the company is expected to save reporting time and reduce the risk of manual data entry errors.
Further development into other platforms, such as Android-based mobile applications, should be prioritized to enhance field user accessibility, especially for those working in areas with limited internet connectivity. Although the system has not been extensively tested, initial user feedback suggests significant potential for broader application. Early users found the system easy to use and well-suited to operational needs.
For future developments, the system should include more advanced data analytics features, such as productivity analysis by location and time period. Additionally, large-scale testing is needed to ensure system performance under various field conditions. These steps are expected to improve the system's effectiveness and ensure its viability for supporting sustainable palm oil plantation management.
