Development and application of modern geographic information systems for monitoring the environmental status of objects

Author: Khaustov I.A., Rylev S.S., Kovaleva E.N.
Journal: Вестник Воронежского государственного университета инженерных технологий @vestnik-vsuet
Section: Экономика и управление
Article in issue: 4 (82), 2019.
Free access
The article presents the results of the application of geographic information systems for environmental auditing, which allows you to monitor the ecological situation on the objects, food and chemical industries and to ensure environmental safety of natural and industrial areas. The authors propose a mathematical model that performs monitoring of environmental objects. The computational experiment is performed in Matlab for classifying the soil measurement conditions. The results of the analysis and the electronic cartograms constructed on their basis are used to predict the location of the points exceeding the parasitological indices in the soil. The assessment of the condition of the soil in different districts of the Voronezh city is made with the help of the created neural networks. The results are compared with the same indicators, measured in 2017. Data is taken from the information Bulletin «Evaluation of the influence of environmental factors on the health of the population of the Voronezh region on indicators of socio-hygienic monitoring»...
Environmental audit, geographic information systems, neural network modeling, software and hardware, cartography
Short address: https://sciup.org/140248269
IDR: 140248269 | UDC: 210 | DOI: 10.20914/2310-1202-2019-4-263-267
Разработка и применение современных геоинформационных систем для мониторинга экологического состояния объектов
Представлены результаты применения геоинформационных систем для проведения экологического аудита, который позволяет осуществлять мониторинг экологической обстановки на объектах пищевой и химической промышленности и обеспечивать экологическую безопасность рассматриваемой природной и промышленной территории. Предложена математическая модель, выполняющая контроль состояния объектов окружающей среды. Для классификации результатов измерения параметров состояния почвы проведен вычислительный эксперимент, выполненный в среде Matlab. Результаты выполненного анализа и построенные на их основе электронные картограммы использованы для прогнозирования расположения точек с превышением паразитологических показателей в почве. С помощью созданной нейронной сети произведена оценка состояния почвы в различных районах города Воронежа и проведено сравнение результатов с аналогичными показателями, измеренными в 2017 г. Данные взяты из информационного бюллетеня «Оценка влияния факторов среды обитания на здоровье населения Воронежской области по показателям социально-гигиенического мониторинга»...
Text of the brief report Development and application of modern geographic information systems for monitoring the environmental status of objects
The geoinformation method of studying the environmental situation involves the analysis of the entire spectrum of available information in relation to a specific geographical point or object. Spatial geoinformation includes geographical information about the study area, objects located on it and occurring natural and anthropogenic phenomena [1]. Geoinformation assumes the monitoring data of these objects and phenomena distributed over time.
This is an open access article distributed under the terms of the Creative Commons Attribution 4.0 International License
Khaustov I.A.. et al. Proceedings of VSUET, 2019, vol. 81, no. It is necessary for creating models and predicting the implementation of a particular scenario of changing environmental conditions. Non-spatial geoinformation consists of regulatory documentation, general data specific to the class of objects under consideration, phenomena, etc. Environmental audit through the geoinformation method of research solves the following tasks [2]:
-
• monitoring the ecological situation of natural and man-made emergencies, assessing man-made environmental impacts and their consequences, ensuring the environmental safety of the territory in question (from local to global level);
-
• territorial and sectoral planning and management of the placement of industrial, transport, agricultural, energy facilities;
-
• control of living conditions of the population, health care and recreation;
-
• mapping (integrated and industry-specific): creating thematic maps and atlases, updating maps, quick mapping;
-
• integration and interaction of information resources.
Thus, environmental audit using geographic information systems (GIS) performs two functions: informing about objects and the state of the environment and modeling. As a result of the environmental audit study using GIS, managerial decisions are made whose purpose is to stabilize and improve the environmental situation in the territory under consideration.
Materials and methods
The results of environmental studies are operational data of three types: ascertaining (measured parameters characterizing the ecological situation at the time of the survey), evaluative (results of processing measurements and deriving from them an assessment of the environmental situation), forecasting (predicting the development of the ecological situation for a certain period of time). mainly dynamic models based on the creation of digital maps are applied through GIS [3]. Any modern GIS contains a set of tools for analyzing spatial attribute information. GIS queries can be set both with a simple mouse click on the object, and with the help of advanced analytical tools. Along with the tools of the standard Structured Query Language (SQL), the analytical capabilities of GIS give the user powerful and customizable tools for processing and managing information [4]. To build maps, we used MapInfo products:
MapInfo Professional – a fully functional geographic information system;
MapBasic – a programming environment for MapInfo Professional;
MapInfo SpatialWare – spatial information management technology in SQL Server / Informix database;
MapInfo MapX – application developer library;
MapXtreme – Mapping application development software for Intranet or the Internet.
In addition to the functions traditional for a DBMS, MapInfo Professional GIS allows collecting, storing, and displaying, editing and processing cartographic data stored in a database, taking into account the spatial relationships of objects [5].
Data sources are:
Exchange vector formats for CAD and geographic information systems: AutoCAD (DXF, DWG), raster maps in GIF, JPEG, TIFF, PCX, BMP, PSD formats. We also display data obtained using GPS devices.
Excel and text files, in which, in addition to attribute information, the coordinates of point objects can be stored.
MapInfo GIS can act as a «map client» when working with such well-known DBMSs as Oracle and DB2, because it supports an effective mechanism for interacting with them through the ODBC protocol. Moreover, access to data from Oracle DBMS is also possible through the internal interface (OCI) of this database. In one session, data of different formats can be used simultaneously.
The built-in SQL query language, thanks to geographical expansion, allows organizing selections taking into account the spatial relationships of objects, such as remoteness, nesting, overlap, intersections, area of objects, etc. Database queries can be saved as templates for future use [6]. MapInfo has the ability to search and map objects to a map by coordinates, address, or index system, which we used to: represent data such as a map and a list. In the Maps window, tools for editing and creating cartographic objects, scaling, changing projections and other functions of working with the map are available [7]. Attributive information associated with cartographic objects is stored in the form of tables, data from which can be represented in the form of graphs and diagrams of various types [8]. The Legends window displays the legend of objects on the map and thematic layers. The Report window provides tools for scaling, prototyping, as well as saving templates for multi-sheet maps. Working with MapInfo, you can generate and print reports with map fragments, lists, charts, and labels. MapInfo uses standard operating system drivers for printing.
Geoinformational ecological modeling of the state of the environment on the basis of GIS allowed us to get answers to the questions: «How would the ecological situation be if there weren’t any economic activity in the territory under consideration?» and «How will the situation change when this object is added to the study area?», «Does this compensate for the anthropogenic pressure on the environment or will a synergistic effect manifest itself?»
Systematic control of the level of pollution of the surface layer of atmospheric air is carried out at 5 control points, the quality of drinking water – at 18 control points, soil – at 21 control points [9].
Results
According to microbiological indicators (bacteria of the Escherichia coli group and Enterococcus index), the soil did not meet the standards at 14 monitoring points out of 21, and for parasitological indicators at 2 monitoring points (Figure 1).
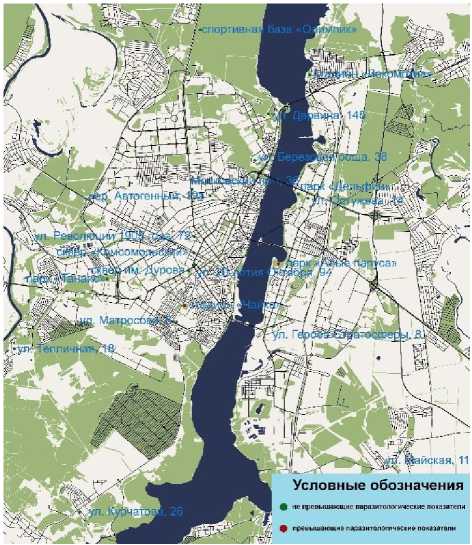
Figure 1. Monitoring points of control with excess of standards of parasitological indicators in the soil (according to data for 2017)
To classify the results of soil measurements, a computational experiment was performed in the Matlab environment (Figure 2).
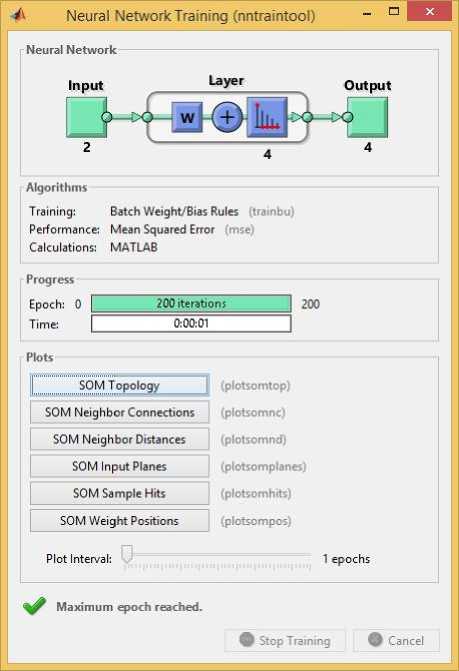
Figure 2. Neural network training
The assessment of the condition of the soil in different districts of the Voronezh city was made with the help of the created neural networks.
Using a neural network, software and hardware, the state of the soil was classified in various areas of the city of Voronezh according to 2017.
Then, the average daily maximum permissible concentration of excess in atmospheric air was recorded for 5 of the 14 controlled substances (nitrogen dioxide, sulfur dioxide, carbon monoxide, phenol, formaldehyde).
Data was taken from the information Bulletin «Evaluation of the influence of environmental factors on the health of the population of the Voronezh region on indicators of socio-hygienic monitoring». Information was prepared by the Office of Rospotrebnadzor in the Voronezh region. A study cited in the article was conducted at the Department of information and control systems of the Voronezh state.
A mathematical model is proposed that performs an environmental audit of environmental objects.
Figure 3 shows the result of predicting the location of points with excess parasitological parameters in the soil.
Obviously, a similar method of environmental audit using geoinformation research and cartography can be used at various enterprises in the food and chemical industries to monitor indicators of the emission of harmful substances into water, air and soil, as well as by controlling services of state bodies for monitoring the environmental condition of the region [10].
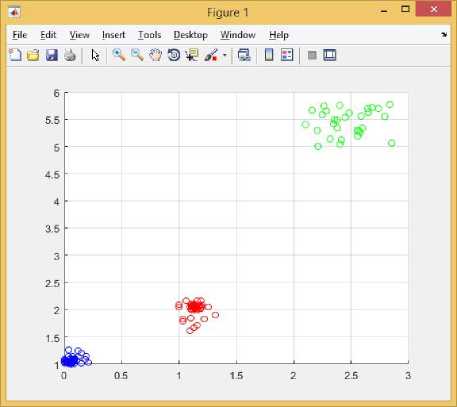
Figure 3. Classification of a sample by a neural network by indicators
Сonclusions
The results of the analysis and electronic cartograms can be used to justify and implement environmental management decisions.
Thus, the GIS performs two functions: informing about the state of the environment and modeling the current state of objects with the help of cartography.
As a result of informational electronic audit using GIS, managerial decisions are made, the purpose of which is to stabilize and improve the environmental situation in the territory under consideration.
GIS MapInfo offers great opportunities for developers of geographic information software. Using modern methods of interaction between Windows applications you can integrate the MapInfo Maps window into programs written in Delphi, Visual Basic, C ++, PowerBuilder, etc. Using MapInfo and the MapBasic development environment everyone can create specific applications for solving specific application problems [11].
Since the system «environment – sources of anthropogenic load» is constantly changing, GIS displays the dynamics of toxic stress growth, as well as measures to improve the state of the environmental situation.
It is advisable to use the proposed concept in organizations operating in the field of environmental monitoring, audit and management decisions to minimize and eliminate technological impacts [12].
This approach can also be used as part of the overall quality management system at enterprises to solve the following tasks: forecasting the impact of anthropogenic activities on the environment and timely changes in the technological cycle, equipment modernization in order to prevent the deterioration of the state of negative responses from the natural and tecnogenic complex.
References Development and application of modern geographic information systems for monitoring the environmental status of objects
- Журкин И.Г., Шайтура С.В. Геоинформационные системы. М.: "КУДИЦ-ПРЕСС", 2009. 272 c.
- Лурье И.К. Геоинформационное картографирование. Методы геоинформатики и цифровой обработки космических снимков: учебник. М.: КДУ, 2008. 424 c.
- Информационные технологии и вычислительные системы: Обработка информации и анализ данных. Программная инженерия. Математическое моделирование. Прикладные аспекты информатики; под ред. С.В. Емельяноваю М.: Ленанд, 2015. 104 c.
- Остроух А.В., Николаев А.Б. Интеллектуальные информационные системы и технологии: монография. СПб.: Лань, 2019. 308 c.
- ДеМерс М.Н. Географические информационные системы. Основы: пер. с англ. М.: Дата+, 1999. 290 c.
- Информационные системы и технологии; под ред. Тельнова Ю.Ф. М.: Юнити, 2017. 544 c.
- Drosou M., Jagadish H.V., Pitoura E., Stoyanovich Ju. Diversity in Big data: A review // Big data. 2017. V. 5 № 2. P. 73-84.
- Montali M., Rivkin A. Model checking Petri nets with names using data-centric dynamic systems // Formal Aspects of Computing. 2016. V. 28 № 4. P. 615-641.
- Kurolap S.A., Klepikov O.V., Vinogradov P.M., Prozhorina T.I. Integral assessment and GIS mapping of Voronezh // Сборник материалов Международного научно-практического семинара по медицинской географии и экологии человека 13-16 августа 2015 года. Владимир. 2015. C. 18.
- Куролап С.А., Клепиков О.В., Виноградов П.М., Прожорина Т.И. и др. Геоинформационное картографирование состояния окружающей среды промышленного города (опыт практической реализации на примере города Воронежа) // Оценка и геоинформационное картографирование медико-экологической ситуации на территории города Воронежа: сборник научных статей. 2019. C. 6-54.
- Хаустов И.А., Ковалева Е.Н. Применение геоинформационных систем в логистике предприятий // Материалы LVII отчетной научной конференции преподавателей и научных сотрудников ВГУИТ за 2018 год: в 3ч. Часть 2. 2019. C. 79-80.
- Тихомиров С.Г., Авцинов И.А., Туровский Я.А., Суровцев А.С. и др. Программно-аппаратный комплекс для управления биотехнологическими системами с использованием интеллектуальных информационных технологий // Вестник Воронежского государственного университета. Серия: Системный анализ и информационные технологии. 2019. № 3. С. 158-165.
