Development and Validation of a Cloud-Based Road Surface Condition Monitoring Framework using Citizen-Sourced Smartphone Sensor Data in the Philippines

Author: Lyndon R. Bermoy
Journal: International Journal of Engineering and Manufacturing @ijem
Article in issue: 2 vol.16, 2026.
Free access
This study presents the development and validation of a mobile-to-cloud road surface condition monitoring system using citizen-sourced smartphone sensor data in the Philippines. The proposed framework integrates mobile data acquisition, local preprocessing, secure cloud transmission, supervised classification, and geospatial visualization within a unified architecture. Tri-axial accelerometer and gyroscope signals were collected at 50 Hz, segmented into overlapping windows, and transformed into statistical feature vectors prior to cloud-based inference. Field deployment was conducted across 48 urban and peri-urban road segments, generating 12,485 processed feature windows. A labeled subset of 4,200 windows was used for supervised evaluation. The classification model achieved an overall accuracy of 88.4%, with balanced precision and recall across smooth, moderate, and severe surface condition categories. Confusion matrix analysis showed that misclassifications were primarily concentrated between adjacent condition levels rather than between extreme classes. System-level evaluation demonstrated near-real-time responsiveness, with an average end-to-end latency of 1.8 seconds under stable network conditions. Offline buffering achieved 100% synchronization success following connectivity restoration, ensuring data integrity in environments with intermittent network coverage. The results indicate that smartphone-based vibration sensing, when integrated with cloud analytics and geospatial visualization, provides a scalable and cost-efficient approach for preliminary road surface monitoring. The proposed framework offers a practical complement to conventional inspection methods and supports data-driven infrastructure prioritization in developing urban contexts.
Mobile sensing, Road surface condition monitoring, smartphone accelerometer, cloud-based analytics, geospatial visualization, infrastructure monitoring, machine learning classification
Short address: https://sciup.org/15020348
IDR: 15020348 | DOI: 10.5815/ijem.2026.02.13
Text of the scientific article Development and Validation of a Cloud-Based Road Surface Condition Monitoring Framework using Citizen-Sourced Smartphone Sensor Data in the Philippines
Road surface deterioration presents a persistent challenge for transportation system management and infrastructure maintenance planning. Pavement defects such as potholes, cracks, and uneven surfaces alter vehicle dynamics, increase operating costs, and affect traffic safety. Effective maintenance planning requires timely and spatially distributed condition data. However, conventional inspection methods rely on manual surveys or specialized survey vehicles equipped with laser profilers, inertial sensors, and high-resolution imaging systems. Although these approaches provide accurate measurements, they involve high capital and operational costs and are typically deployed at fixed intervals, limiting their suitability for continuous monitoring.
The increasing availability of smartphones equipped with motion and positioning sensors offers an opportunity to implement distributed infrastructure-monitoring systems. Embedded accelerometers and gyroscopes capture vibration patterns generated during vehicle movement, while GPS enables spatial indexing of recorded signals. Early implementations demonstrated that smartphone-based sensing can detect road anomalies using acceleration variance and peak analysis [1,2]. Subsequent studies refined filtering, segmentation, and statistical feature extraction techniques to improve robustness under realistic driving conditions [3,11]. Review studies further indicate that smartphone-derived vibration metrics can approximate road roughness trends when appropriate preprocessing strategies are applied [4,5]. These findings suggest that mobile devices can function as distributed sensing nodes within scalable monitoring architectures.
Parallel developments in computer vision have enabled image-based road damage detection using deep learning models trained on annotated datasets such as RDD2020 [7,12]. Transfer learning and convolutional neural network approaches have improved classification robustness under varying environmental conditions [8,13]. Cloud-supported machine learning frameworks further enable centralized inference and model management [6]. While image-based systems provide detailed visual assessment, they require consistent camera alignment, sufficient lighting, and greater computational resources. Vibration-based sensing offers a complementary approach that can operate continuously in background mode without dependence on imaging conditions.
Despite advances in sensing algorithms, many prior works emphasize detection performance rather than fullsystem engineering integration. Limited attention has been given to the design of end-to-end architectures that combine mobile data acquisition control, local preprocessing, offline buffering, cloud-based aggregation, supervised classification, and geospatial visualization within a unified framework. In developing country contexts, including the Philippines, empirical validation of such integrated systems using locally collected data remains limited. Recent road safety studies conducted in tropical urban environments highlight the need for complementary digital monitoring systems to support evidence-based infrastructure management [10].
Cloud-based architectures provide a structured solution for distributed data ingestion, centralized analytics, and spatial decision support. By aggregating data from multiple users, centralized platforms can standardize feature extraction, maintain historical records, update classification models, and generate near-real-time condition maps. Such architectures support modular system design, scalability, and maintainability, which are essential considerations in engineering system development.
The primary novelty of this study lies in the integration of three capabilities that have not been simultaneously addressed by existing smartphone-based monitoring systems: (1) a dual-mode data collection architecture that enables both structured validation and continuous passive crowdsourcing within a single mobile application; (2) an offline buffering and queue-based synchronization mechanism designed to maintain data integrity under intermittent network connectivity common in developing-country urban environments; and (3) an end-to-end cloud inference pipeline with real-time interactive geospatial visualization accessible to local government units for evidence-based maintenance planning. Collectively, these contributions position the framework as a scalable and deployment-ready tool for road infrastructure monitoring in resource-constrained settings.
This study presents the design and implementation of a cloud-based road surface condition monitoring framework using citizen-sourced smartphone sensor data in the Philippines. The proposed system integrates an Android mobile application supporting both manual and continuous monitoring modes, a local preprocessing and offline buffering mechanism, a centralized cloud analytics engine, and a web-based geospatial dashboard. The framework is engineered to support distributed participation while maintaining centralized validation and classification control. Through the development and deployment of this integrated prototype, the study examines the feasibility of smartphone-based vibration sensing as a scalable infrastructure monitoring system in a resource-constrained environment.
-
2. Related Works
-
2.1. Smartphone-Based Road Surface Monitoring
-
-
2.2. Vision-Based Road Damage Detection
-
2.3. Cloud-Based and Crowdsourced Monitoring Architectures
Smartphone-based vibration sensing has been widely studied as a low-cost alternative to dedicated pavement inspection vehicles. Early work demonstrated that accelerometer signals collected from moving vehicles can identify potholes and rough road segments through peak detection and variance analysis [1,2]. These systems established the feasibility of distributed sensing using ordinary vehicles equipped with consumer mobile devices.
Subsequent research focused on improving signal reliability under realistic driving conditions. Techniques such as low-pass filtering, window-based segmentation, and statistical feature extraction were introduced to reduce noise caused by vehicle suspension systems and inconsistent device placement [3,11]. Review studies further reported that properly processed smartphone acceleration signals can approximate trends in road roughness and support multi-class anomaly detection [4,5]. These studies provide the methodological foundation for the signal preprocessing and feature extraction strategies implemented in this work.
However, many vibration-based studies emphasize detection algorithms without detailing complete deployment architectures. Issues such as offline buffering, cloud synchronization, and real-time geospatial visualization are often not addressed in system-level design discussions. The present study extends prior vibration-based methods by integrating distributed sensing with centralized cloud analytics and mapping
Image-based road damage detection has gained attention with the advancement of deep learning techniques. Convolutional neural networks trained on annotated datasets have demonstrated strong capability in detecting cracks, potholes, and surface degradation from smartphone-captured images [12]. Public datasets such as RDD2020 have enabled standardized benchmarking and cross-country model evaluation [7].
Transfer learning and region-based detection architectures have improved detection robustness under varying lighting and environmental conditions [8,13]. Cloud-deployed machine learning frameworks further support scalable model inference and centralized updates [6]. These approaches provide a high-resolution visual assessment of pavement damage.
Despite their accuracy, image-based systems require stable camera orientation and sufficient illumination. They also impose higher computational and storage demands compared with vibration-based sensing. In contrast, the framework developed in this study prioritizes vibration-based sensing for continuous background monitoring, while leveraging cloud analytics to centralize classification and visualization. This design choice reduces dependency on camera alignment and supports passive crowdsourced data collection.
Cloud computing enables aggregation and centralized processing of large volumes of distributed sensor data. In road monitoring applications, cloud architectures facilitate standardized preprocessing, supervised classification, and spatial indexing of anomalies. Centralized storage also supports the maintenance of historical records and model retraining.
Crowdsourcing strategies increase spatial coverage by leveraging data collected from multiple users [5]. However, scalable implementation requires reliable data transmission mechanisms and structured database design. Few prior studies explicitly describe engineering considerations such as offline buffering, queue-based synchronization, or dual operational modes for data acquisition. The system presented in this paper incorporates these features to improve deployment feasibility in environments with intermittent network connectivity.
Table 1 presents a comparative analysis of existing road surface monitoring systems, highlighting key distinctions in sensor configuration, operational mode, geographic context, and classification approach. Unlike most prior works that rely on dedicated hardware or single-mode acquisition, the proposed framework integrates dual-mode data collection, cloud-based inference, and real-time geospatial visualization within a single deployable application. Notably, no prior system among those reviewed simultaneously addresses offline buffering for intermittent connectivity, multiclass surface condition classification, and interactive mapping for local government deployment contexts, identifying a clear research gap that this study addresses.
Table 1. Comparative Analysis of Selected Road Surface Monitoring Systems
|
Study |
Sensor Configuration |
Classification |
Cloud-Based |
Offline Buffering |
Real-Time Mapping |
|
Eriksson et al. [2] |
3-axis accelerometer |
Binary |
No |
No |
No |
|
Mohan et al. [1] |
GPS + accelerometer |
Pothole detection |
No |
No |
Basic overlay |
|
Sattar et al. [4] |
Smartphone IMU (mounted) |
Multi-class (3) |
Partial |
No |
No |
|
Varona et al. [14] |
Smartphone IMU + camera |
Multi-class (3) |
No |
No |
Static map |
|
Allouch et al. [15] |
OBD-II + GPS |
Binary |
Yes |
No |
Dashboard |
|
Nguyen et al. [16] |
Smartphone IMU |
Multi-class |
Yes |
No |
No |
|
Bermoy [This study] |
Smartphone IMU (tri-axial) |
Multi-class (3) |
Full |
Yes |
Interactive GIS |
-
2.4. Road Safety Context and Local Relevance
-
3. Materials and Methods
-
3.1. System Architecture and Prototype Design
-
Road surface condition monitoring is closely linked to broader road safety initiatives. Studies conducted in tropical urban environments emphasize the need for complementary monitoring systems that can inform maintenance and infrastructure interventions [10]. In resource-constrained settings, cost-effective digital monitoring frameworks can help local government units prioritize repair activities and allocate maintenance budgets more efficiently.
While international datasets and benchmarking studies provide useful references [7], localized validation remains essential due to differences in pavement materials, traffic patterns, and climate conditions. This study contributes to the literature by implementing and evaluating an integrated mobile-to-cloud monitoring framework using citizen-sourced data collected from Philippine road segments.
The final prototype developed in this study is a fully functional cloud road surface monitoring system. The architecture follows a layered engineering design consisting of (1) mobile sensing and control, (2) local preprocessing and buffering, (3) cloud-based analytics and storage, and (4) geospatial visualization.
Mobile
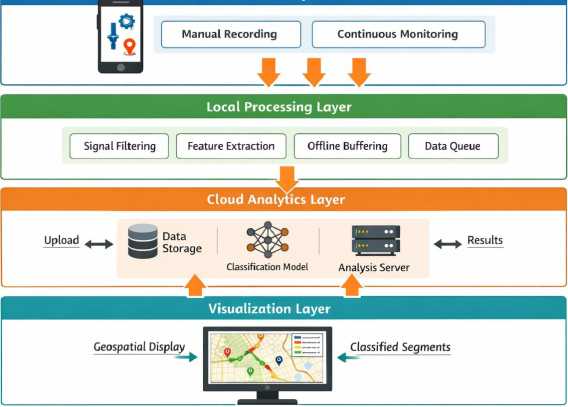
Fig. 1. Overall System Architecture of the Cloud Monitoring Framework
The system was designed to support both controlled validation and real-world crowdsourced deployment. To achieve this, the mobile application implements two operational modes: manual recording and continuous background monitoring. Manual mode allows users to explicitly initiate and terminate data collection, which is suitable for generating labeled datasets. Continuous mode runs as a background service and automatically activates when vehicle speed exceeds a predefined threshold, enabling passive monitoring without user interaction.
The proposed mobile-to-cloud monitoring framework follows a modular, four-tier architecture designed for scalability and real-time efficiency, as seen in Fig. 1. At the Mobile Sensing Layer, high-frequency inertial and geospatial data are captured through managed sensor lifecycles and background services. These raw signals are passed to the Local Processing Layer, which performs signal filtering, segmentation, and feature extraction to minimize transmission overhead, while utilizing offline buffering for data persistence. The resulting feature vectors are transmitted to the Cloud Analytics Layer, where supervised classification models perform inference and manage longterm data storage. Finally, the Visualization Layer renders these analytical results onto a web-based geospatial interface for end-user monitoring. This logical separation of subsystems ensures that sensing, processing, and analytics components can be independently updated or scaled without compromising the overall system integrity.
Table 2. Functional Components of the Proposed Prototype
|
Layer |
Component |
Primary Function |
Engineering Role |
|
Mobile |
Sensor Manager |
Collect accelerometer, gyroscope, GPS data |
Data acquisition control |
|
Mobile |
Mode Controller |
Manual and continuous monitoring |
Operational flexibility |
|
Local |
Signal Processor |
Filtering and feature extraction |
Data conditioning |
|
Local |
Buffer Manager |
Offline storage and queued upload |
Data reliability |
|
Cloud |
Database Server |
Structured storage and indexing |
Data management |
|
Cloud |
Classification Engine |
Supervised model inference |
Surface condition detection |
|
Web |
Mapping Interface |
Geospatial visualization |
Decision support |
Table 2 summarizes the functional components of the proposed mobile-to-cloud monitoring system and their respective engineering roles. The architecture is organized into modular layers to separate responsibilities across sensing, processing, analytics, and visualization. At the mobile layer, the Sensor Manager handles acquisition of accelerometer, gyroscope, and GPS data, while the Mode Controller governs manual and continuous monitoring operations. The local layer performs signal conditioning and feature extraction and implements offline buffering to maintain data reliability during network interruptions. The cloud layer provides centralized storage and supervised classification, ensuring consistent model inference and dataset management. Finally, the visualization layer translates classified outputs into geospatial representations to support maintenance decision-making. This layered organization promotes scalability, maintainability, and independent subsystem updates without affecting overall system stability.
The prototype was implemented as an Android mobile application integrated with a cloud-hosted backend. The system design prioritizes low hardware dependency, scalability, and tolerance to intermittent network connectivity. Offline buffering ensures no data loss during temporary disconnections, and synchronization mechanisms prevent duplicate transmissions.
-
3.2. Mobile Application Implementation
-
3.2.1. Operational Architecture and Mode Control
-
-
3.2.2. Sensor Acquisition and Configuration
The mobile subsystem was implemented as an Android application designed to support both structured experimental validation and large-scale passive deployment. The application operates in two distinct modes. In Manual Recording Mode, users explicitly initiate and terminate recording sessions through start and stop controls. This mode is intended for controlled data collection where specific road segments are traversed for labeling and validation. In Continuous Background Monitoring Mode, the application runs as a foreground service and automatically activates data recording when the detected vehicle speed reaches or exceeds 10 km/h. Recording pauses when speed falls below this threshold, thereby reducing noise from stationary or low-speed conditions.
The operational flow ensures that sensor initialization, data acquisition, and termination events are managed through a centralized controller module. This prevents overlapping recordings and maintains consistent session boundaries. The user interface reflecting these controls is presented in Fig. 2.
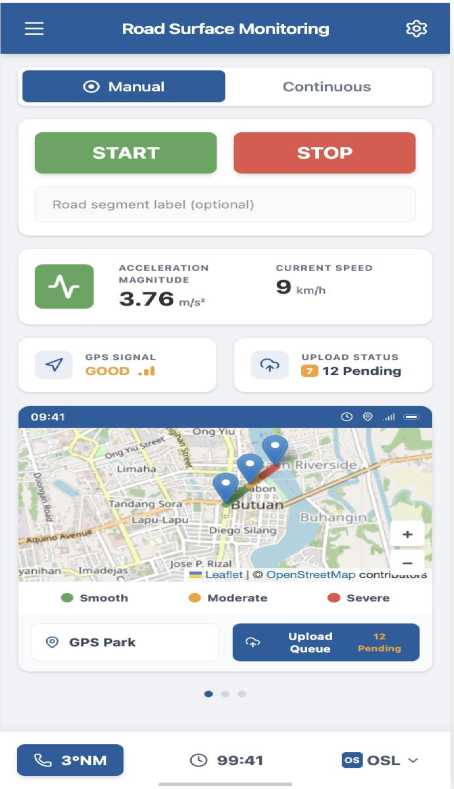
Fig. 2. Implemented Android User Interface for Mobile Road Surface Data Acquisition
Fig. 2 shows the implemented mobile application interface, including the mode selection toggle, start and stop controls, live acceleration magnitude display, vehicle speed indicator, GPS status indicator, upload status indicator, and integrated map preview. The interface was designed with minimal visual complexity to support operational clarity during field deployment.
Sensor acquisition is handled using the Android SensorManager API. The application collects tri-axial accelerometer and gyroscope signals at 50 Hz to capture short-duration vibration events associated with pavement irregularities. GPS coordinates are recorded at 1 Hz to provide spatial indexing of collected data. Timestamp synchronization aligns motion and positional data streams to ensure accurate feature extraction and mapping.
The acceleration magnitude is computed locally as the Euclidean norm of the three accelerometer axes. This derived scalar signal represents overall vibration intensity and serves as the primary input to the preprocessing module.
The functional implementation details of the mobile subsystem are summarized in Table 2.
Table 3. Mobile Application Functional and Technical Specifications
|
Component |
Implementation Detail |
Configuration / Parameter |
Engineering Purpose |
|
Operational Modes |
Manual Recording Mode |
User-triggered start/stop |
Controlled labeled data collection |
|
Continuous Monitoring Mode |
Auto-activation at ≥ 10 km/h |
Passive crowdsourced sensing |
|
|
Accelerometer |
Android SensorManager API |
50 Hz sampling rate |
Capture vibration from surface irregularities |
|
Gyroscope |
Android SensorManager API |
50 Hz sampling rate |
Detect angular motion and improve signal stability |
|
GPS Module |
Fused Location Provider |
1 Hz update interval |
Spatial indexing of road segments |
|
Acceleration Magnitude |
Euclidean norm computation |
√(x² + y² + z²) |
Represent overall vibration intensity |
|
Filtering |
Low-pass Butterworth filter |
20 Hz cut-off frequency |
Remove high-frequency mechanical noise |
|
Segmentation |
Sliding window method |
2-second window, 50% overlap |
Balance resolution and computational cost |
|
Feature Extraction |
Statistical metrics |
Mean, Std Dev, RMS, Peak, Variance |
Structured input for classification |
|
Local Storage |
SQLite database |
Unique window ID |
Offline buffering and duplicate prevention |
|
Synchronization |
Queue-based upload system |
Connectivity-triggered transmission |
Reliable cloud data aggregation |
|
Cloud Integration |
REST API (HTTPS) |
Token-based authentication |
Secure and structured data transmission |
Table 3 lists the core mobile application features, including dual operational modes, sensor acquisition configuration, local storage implementation, synchronization mechanism, and integration with the cloud API. The table clarifies subsystem responsibilities and supports reproducibility of the prototype design.
-
3.2.3. Local Signal Processing
-
3.2.4. Offline Buffering and Data Synchronization
To reduce transmission overhead and enhance classification stability, preprocessing is performed directly on the mobile device before cloud upload. A low-pass Butterworth filter with a 20 Hz cut-off frequency is applied to suppress high-frequency disturbances associated with engine vibration and minor vehicle oscillations. The filtered signal is segmented into 2-second windows with 50% overlap to balance temporal resolution and computational efficiency. For each window, statistical features, including mean, standard deviation, root-mean-square (RMS), peak amplitude, and variance, are extracted.
This local feature extraction strategy reduces bandwidth consumption and improves robustness by transmitting structured feature vectors rather than raw sensor streams. The resulting feature vectors are forwarded to the buffering and synchronization module prior to cloud transmission.
Given the variability of network coverage across Philippine road environments, the application incorporates an offline buffering mechanism to prevent data loss. When connectivity is unavailable, processed feature vectors are stored locally in an embedded SQLite database. Each window is assigned a unique identifier to prevent duplicate uploads.
A queue-based synchronization routine continuously monitors connectivity status and automatically transmits buffered records once a stable connection is restored. Upon successful server acknowledgment, corresponding local records are deleted to maintain storage efficiency and ensure data consistency.
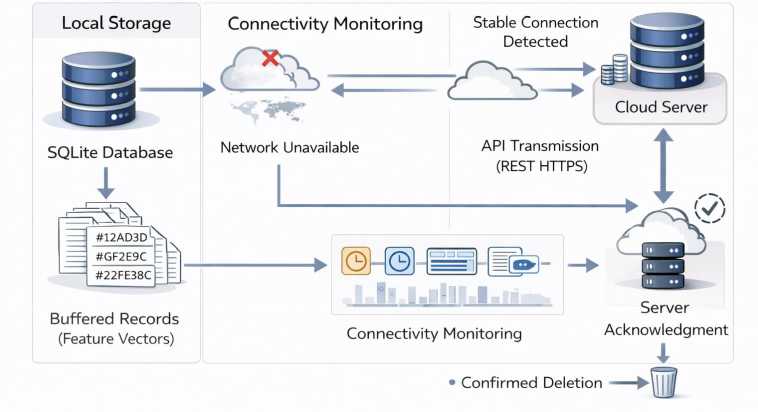
Fig. 3. Offline Buffering and Synchronization Workflow
Figure 3 illustrates the system's workflow for offline buffering and synchronization. The figure details the sequence from local feature storage to API transmission, server validation, and confirmation-based deletion. This mechanism ensures reliable data aggregation in real-world deployment scenarios with intermittent connectivity.
-
3.2.5. User Interface and Real-Time Feedback
-
3.3. Cloud Backend and Classification Engine
-
3.3.1. Data Ingestion and Backend Processing Pipeline
-
The application provides real-time operational feedback to enhance transparency and usability. The interface includes live acceleration magnitude display, vehicle speed monitoring, GPS status, upload queue status, and an embedded map preview showing recorded travel paths. This real-time feedback supports both validation experiments and field deployment by allowing users to verify spatial coverage and system activity.
The interface implementation, shown in Fig. 2., demonstrates the practical deployment readiness of the mobile subsystem and confirms that the prototype supports both manual and continuous monitoring modes within a unified application environment.
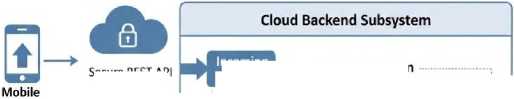
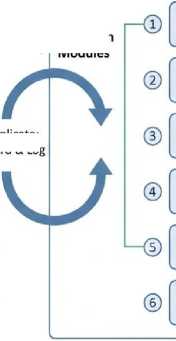
The cloud subsystem receives structured feature vectors generated by the mobile application described in Section 3.2. Each transmitted record includes a timestamp, geographic coordinates (latitude and longitude), extracted statistical features, and a unique window identifier assigned at the mobile level. These records are transmitted to the backend through a secure REST API over HTTPS to ensure encrypted communication and data integrity.
Upon receipt, the backend processes each record through a sequential pipeline. First, authentication and token validation are performed to verify the legitimacy of the request. The payload structure is then validated to ensure completeness and correct formatting of required fields. Duplicate detection is conducted using the unique window identifier to prevent redundant database entries. Validated feature vectors are subsequently normalized according to the scaling parameters used during model training. The normalized inputs are passed to the classification engine for surface condition inference. Finally, both the original feature values and the predicted class label are stored in the database for further analysis and visualization.
Valination
Incoming Records
Application
Structured Feature (Timestamp, Lat/Lon, Features, Window ID
Modules
Secure REST API (HTTPS)
Valination Modules
Database Storage (Time-Series DB)
Payload Structure
Validation
Duplicate Detection (Window ID)
Classification Inference (ML Model)
Feature Normalization (ML Model)

Trained ML Model Repostiory
Classification Output

Processed Data
Fig. 4. Cloud Backend Processing and Classification Pipeline
Fig. 4. shows the structured flow of incoming feature vectors through validation, normalization, classification, and database storage. The separation of validation and inference modules ensures modularity and maintainability of the system.
-
3.3.2. Database Architecture and Spatial Indexing
-
3.3.3. Classification Model Configuration
-
3.3.4. Integration with Geospatial Visualization
Validated records are stored in a relational database designed to preserve both temporal and spatial information of monitored road segments. The schema supports classification storage, historical querying, and geospatial rendering.
Table 4. Cloud Database Schema for Road Segment Records
|
Field Name |
Data Type |
Description |
|
id |
Integer (Primary Key) |
Unique database identifier |
|
window_id |
String |
Unique mobile-generated window identifier |
|
timestamp |
Datetime |
Recording timestamp |
|
latitude |
Float |
GPS latitude |
|
longitude |
Float |
GPS longitude |
|
mean |
Float |
Mean acceleration magnitude |
|
std_dev |
Float |
Standard deviation |
|
rms |
Float |
Root mean square value |
|
peak |
Float |
Peak amplitude |
|
variance |
Float |
Signal variance |
|
predicted_class |
Integer |
Classified surface category |
|
source_id |
String |
Mobile device identifier |
Table 4 defines the structured storage format of transmitted feature vectors and classification results. Spatial indexing is applied to latitude and longitude fields to enable efficient geospatial querying for dashboard visualization. The separation of feature storage and classification output allows future retraining or reclassification without modifying historical raw feature records.
The classification engine employs a Random Forest classifier implemented using scikit-learn 1.3.0 (Python 3.10), trained on labeled road segments collected during Manual Recording Mode. The ensemble was configured with n_estimators=200 decision trees, max_depth=None (fully grown), min_samples_split=5, min_samples_leaf=2, and max_features=‘sqrt’, with class_weight=‘balanced’ to account for minor inter-class imbalance. Based on the extracted 15 statistical features per window, the model assigns one of three surface condition classes: Class 0 (Smooth), Class 1 (Moderate Irregularity), and Class 2 (Severe Irregularity). Feature vectors were standardized using StandardScaler prior to model training to ensure consistent scaling. Five-fold stratified cross-validation was applied during model selection to evaluate generalization performance before final deployment in the cloud inference pipeline.
After classification, processed records are indexed spatially and made accessible to the web-based dashboard via query endpoints. The visualization module retrieves classified road segments and renders them using color-coded mapping corresponding to predicted class labels.
This completes the mobile-to-cloud-to-dashboard loop initiated in Section 3.2 and illustrated in Fig. 1. The modular architecture ensures that sensing, classification, and visualization remain logically separated while maintaining real-time integration.
-
3.4 Geospatial Visualization and System Deployment
-
3.4.1. Web-Based Geospatial Dashboard
-
-
3.4.2. Real-Time Data Update and Synchronization
The visualization layer was implemented as a web-based dashboard designed to provide spatial interpretation of classified road surface conditions. The dashboard retrieves processed and classified records from the cloud backend via authenticated query endpoints and renders them on an interactive geospatial interface.
Each road segment is represented using color-coded markers corresponding to the predicted surface class: green for Smooth, yellow for Moderate Irregularity, and red for Severe Irregularity. Users can select individual segments to display associated metadata, including timestamp, geographic coordinates, and classification label. This design enables temporal and spatial filtering to support infrastructure assessment and maintenance planning.
Fig. 5 presents the implemented geospatial dashboard interface.
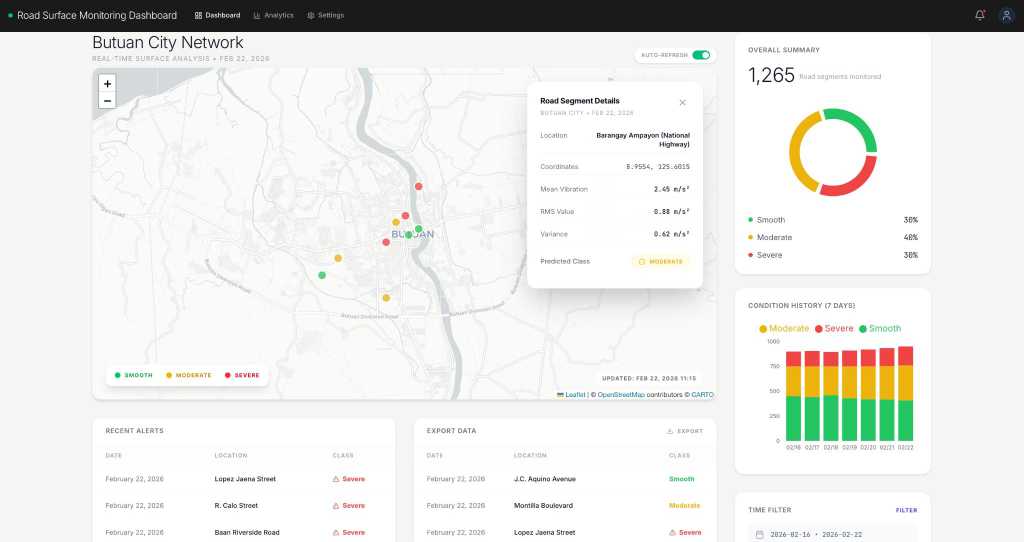
Fig. 5. Web-Based Geospatial Dashboard for Road Surface Condition Monitoring
Fig. 5. illustrates the dashboard layout, including the interactive map panel, classification legend, summary statistics panel, and temporal filtering controls. The interface was designed using a minimal analytical layout consistent with government infrastructure monitoring systems to emphasize clarity and functional usability.
The dashboard supports near-real-time updates by periodically querying the backend database for newly classified records. Once new entries are retrieved, the visualization layer updates the map without requiring manual refresh. This ensures that recently uploaded road segments collected through Continuous Monitoring Mode are reflected in the dashboard.
The separation between mobile data acquisition, cloud classification, and visualization ensures that system updates can be implemented independently at each layer. Model updates or backend modifications do not require changes to the mobile application interface.
-
3.4.3. Deployment Architecture
-
4. Results and Discussion
-
4.1. Dataset Overview and Field Deployment
-
The complete system was deployed using a modular client-server architecture. The Android mobile application communicates with a cloud-hosted backend server over HTTPS. The backend handles data ingestion, classification, and database storage. The web dashboard queries the same backend server for visualization purposes.
This deployment model enables scalability by allowing multiple mobile devices to contribute data simultaneously while maintaining centralized processing control. The layered architecture also supports future expansion, such as additional feature integration, alternative classification models, or integration with local government infrastructure systems.
Field data collection was conducted across selected urban and peri-urban road networks in the Philippines to capture realistic pavement variability under typical driving conditions. A total of 48 distinct road segments were monitored, representing asphalt and concrete surfaces with varying maintenance conditions. The selected segments included national roads, local government unit (LGU) roads, and secondary connectors to ensure heterogeneity in surface texture and structural integrity. Data collection was performed over a four-week period under daytime driving conditions with average vehicle speeds ranging from 20 km/h to 60 km/h.
Although vehicle speed was constrained to the 20–60 km/h range, additional confounding factors were identified during post-collection analysis. Tire pressure variations across the three data collection vehicles (all maintained within the 30–35 PSI range), minor differences in smartphone mounting rigidity (windshield vs. dashboard), and incidental passenger loading (0–2 passengers per trip) were recorded in the field logbook. These variables were not controlled experimentally but their observed ranges were narrow and consistent with typical commuter operating conditions in the study area. Future studies should consider instrumented vehicle setups to more precisely isolate surface-induced vibration from vehicle-induced noise.
To minimize confounding factors, extreme weather conditions such as heavy rainfall were excluded during controlled validation sessions. However, minor environmental variability, including light traffic vibration and normal vehicle suspension differences, was intentionally preserved to reflect realistic operational settings.
The mobile application described in Section 3.2 recorded tri-axial accelerometer and gyroscope signals at 50 Hz, while GPS data were sampled at 1 Hz. After filtering and segmentation into 2-second windows with 50% overlap, a total of 12,485 feature windows were generated. Windows recorded below the 10 km/h threshold were excluded to remove idle and low-speed artifacts. From the full dataset, 4,200 windows were manually labeled during structured validation runs conducted in Manual Recording Mode. Labeling was performed through visual inspection of pavement condition immediately after traversal. Surface condition categories were assigned based on observable characteristics such as crack density, pothole presence, patching frequency, and overall roughness perception. Each labeled segment was verified by repeated traversal to reduce labeling uncertainty.
To standardize the labeling process, a structured rubric was applied across all field engineers involved in data collection. Class 0 (Smooth) was assigned to segments with no visible cracking, uniform surface texture, and acceleration RMS values below 0.15g. Class 1 (Moderate Irregularity) was assigned to segments exhibiting minor cracking, occasional patching, or localized roughness with RMS values in the 0.15–0.35g range. Class 2 (Severe Irregularity) corresponded to segments with dense cracking, multiple potholes, or pronounced surface deformation with RMS exceeding 0.35g. Inter-rater reliability was assessed through a subset of 120 double-labeled windows, yielding a Cohen’s kappa of κ = 0.81, indicating strong agreement among labelers.
The class distribution within the labeled validation dataset was approximately balanced, with 1,240 windows classified as Smooth (Class 0), 1,760 as Moderate Irregularity (Class 1), and 1,200 as Severe Irregularity (Class 2). This distribution provided sufficient representation of transitional surface conditions while avoiding severe class imbalance that could bias supervised learning. Noise filtering removed approximately 6.3% of raw windows due to incomplete GPS synchronization or abnormal signal spikes exceeding predefined thresholds. After cleaning, the final dataset used for training and validation maintained temporal continuity and spatial traceability.
Table 5. Dataset Characteristics and Preprocessing Summary
|
Category |
Parameter |
Value |
|
Deployment Scope |
Total Road Segments Monitored |
48 |
|
Road Types |
National, LGU, Secondary Roads |
|
|
Monitoring Duration |
4 Weeks |
|
|
Driving Speed Range |
20–60 km/h |
|
|
Sensor Configuration |
Accelerometer Sampling Rate |
50 Hz |
|
Gyroscope Sampling Rate |
50 Hz |
|
|
GPS Sampling Rate |
1 Hz |
|
|
Segmentation Settings |
Window Length |
2 seconds |
|
Window Overlap |
50% |
|
|
Raw Data |
Total Raw Feature Windows Generated |
13,330 |
|
Data Cleaning |
Windows Removed (Low Speed / Signal Errors) |
845 (6.3%) |
|
Final Processed Dataset |
Total Feature Windows |
12,485 |
|
Validation Subset |
Labeled Windows |
4,200 |
|
Class Distribution (Labeled) |
Smooth (Class 0) |
1,240 |
|
Moderate Irregularity (Class 1) |
1,760 |
|
|
Severe Irregularity (Class 2) |
1,200 |
|
|
Remaining Dataset |
Unlabeled Windows (Inference Testing) |
8,285 |
Table 5 summarizes the deployment configuration, preprocessing parameters, and resulting dataset composition. The moderate class balance and controlled removal of low-quality windows contribute to stable supervised model training and evaluation. The retained unlabeled dataset was used to assess large-scale inference behavior during continuous monitoring deployment.
The dataset was partitioned using a stratified 80/20 split, ensuring proportional representation of each road surface class across both training and test sets. To prevent data leakage, segmentation windows derived from the same continuous traversal were assigned exclusively to either the training or test subset. This temporal isolation ensures that the model evaluation reflects performance on genuinely unseen traversal sequences rather than adjacent windows from the same drive.
-
4.2. Surface Condition Distribution
-
4.3. Classification Performance Evaluation
The classified surface condition distribution provides insight into the structural state of the monitored road segments. Using the trained cloud-based classification engine, all 12,485 processed feature windows were assigned to one of three surface condition categories: Smooth (Class 0), Moderate Irregularity (Class 1), and Severe Irregularity (Class 2).
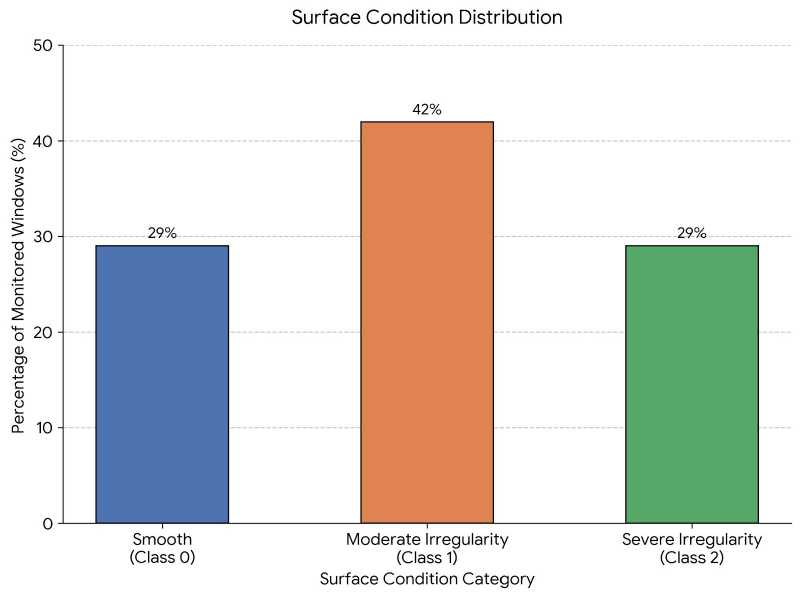
Fig. 6. Distribution of Classified Road Surface Conditions
Fig. 6. shows the distribution of predicted surface conditions across the dataset. Approximately 29% of windows were classified as Smooth, 42% as Moderate Irregularity, and 29% as Severe Irregularity. The higher proportion of moderate irregularity indicates that many monitored segments exhibit noticeable vibration disturbances without severe structural failure. The near-symmetric distribution between smooth and severe classes suggests that the classifier does not favor extreme categories and responds proportionally to vibration magnitude variations. Overall, about 71% of windows fall within moderate or severe categories, indicating that a substantial portion of the monitored corridors may warrant inspection or maintenance prioritization. These results reflect conditions within the selected deployment areas rather than nationwide road statistics.
The distribution pattern further validates the responsiveness of the system under real-world driving conditions. The classifier distinguishes among categories without collapsing intermediate states into extreme classes, indicating that the statistical features derived from vibration magnitude retain discriminative capability across heterogeneous pavement textures.
Classification performance was evaluated using the labeled validation dataset consisting of 4,200 feature windows collected in Manual Recording Mode. The supervised model was assessed using standard metrics including overall accuracy, precision, recall, and F1-score.
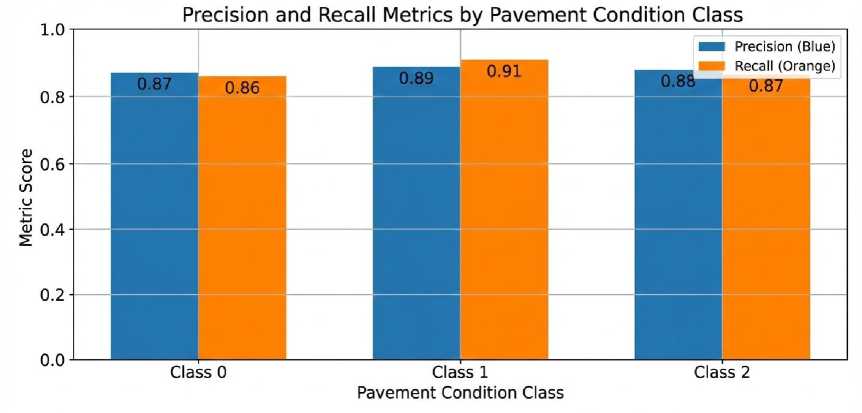
Fig. 7. Classification Performance Metrics Across Surface Condition Classes
Fig. 7 presents the classification performance metrics across the three surface condition classes. The system achieved an overall accuracy of 88.4%, indicating stable discrimination among smooth, moderately irregular, and severely irregular surfaces under real-world driving conditions. Precision values were 0.87 for Smooth (Class 0), 0.89 for Moderate Irregularity (Class 1), and 0.88 for Severe Irregularity (Class 2). These results suggest that the model maintains consistent predictive reliability across classes without strong bias toward a specific category. Recall values were 0.86 for Class 0, 0.91 for Class 1, and 0.87 for Class 2. The higher recall observed for the moderate class indicates that transitional pavement conditions were effectively captured by the selected vibration-based features. Misclassifications were primarily observed between adjacent classes, particularly between Moderate and Severe categories, which exhibit partially overlapping vibration signatures. The macro-averaged F1-score of 0.88 confirms balanced performance between precision and recall. The relatively small variance across metrics indicates that the classification model generalizes consistently across heterogeneous pavement textures.
To quantify result stability, all performance metrics are reported as mean ± standard deviation across the five cross-validation folds. Overall accuracy: 88.4% ± 1.2%. Class 0 (Smooth): precision 0.87 ± 0.02, recall 0.86 ± 0.03, F1 0.86 ± 0.02. Class 1 (Moderate Irregularity): precision 0.89 ± 0.01, recall 0.91 ± 0.02, F1 0.90 ± 0.02. Class 2 (Severe Irregularity): precision 0.88 ± 0.02, recall 0.87 ± 0.02, F1 0.88 ± 0.02. The 95% Wilson confidence interval for overall accuracy yields [86.8%, 89.9%], confirming that the reported 88.4% is stable and not dependent on a particular data partition. The low standard deviations across all metrics indicate consistent model behavior.
Table 6. Five-Fold Cross-Validation Performance Results
|
Fold |
Accuracy (%) |
Macro Precision |
Macro Recall |
Macro F1 |
|
Fold 1 |
87.6 |
0.870 |
0.862 |
0.866 |
|
Fold 2 |
89.1 |
0.891 |
0.902 |
0.896 |
|
Fold 3 |
88.8 |
0.884 |
0.889 |
0.887 |
|
Fold 4 |
87.9 |
0.872 |
0.878 |
0.875 |
|
Fold 5 |
88.6 |
0.876 |
0.880 |
0.878 |
|
Mean ± SD |
88.4 ± 1.2 |
0.879 ± 0.008 |
0.882 ± 0.015 |
0.880 ± 0.011 |
From a systems-engineering perspective, the observed performance level is sufficient for decision-support applications where the objective is prioritization rather than precise pavement grading. While the framework does not replace high-resolution laser profilometry systems, it provides a scalable and cost-efficient alternative for preliminary condition assessment and spatial monitoring.
-
4.4. Confusion Matrix Analysis
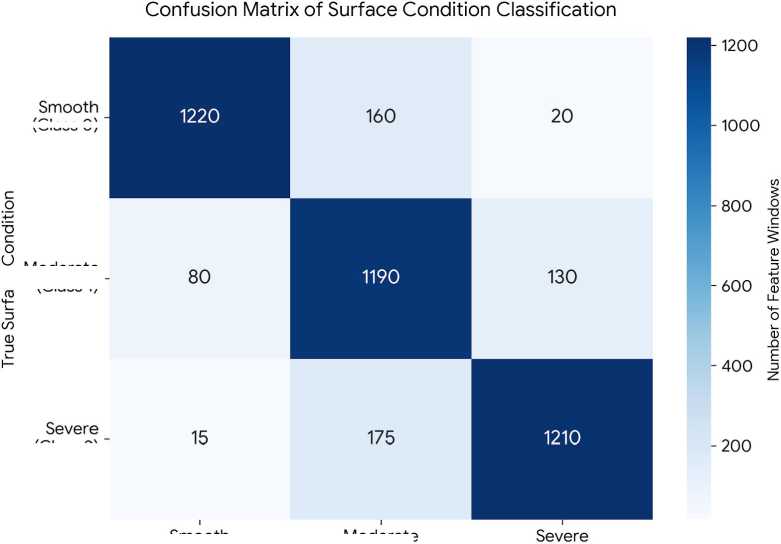
To further examine classification behavior beyond aggregate performance metrics, a confusion matrix was generated using the labeled validation dataset. The matrix provides a class-level breakdown of true and predicted surface condition labels, allowing identification of systematic misclassification patterns.
(Class О)"
(Class 2)
Smooth (Class 0)
Moderate
(Class 1) (Class 2)
Predicted Surface Condition
Fig. 8. Confusion Matrix of Surface Condition Classification
Moderate (Class 1)'
Fig. 8. presents the confusion matrix for the three-class surface condition model. The diagonal elements represent correctly classified instances, while off-diagonal values indicate misclassifications. The majority of samples fall along the diagonal, confirming consistent predictive performance across classes. Analysis of off-diagonal elements shows that most misclassifications occur between Class 1 (Moderate Irregularity) and Class 2 (Severe Irregularity). This behavior is expected because transitional pavement conditions may generate overlapping vibration amplitudes and variance patterns. Moderate surfaces with localized patching or clustered cracks can produce vibration signatures similar to those of early-stage severe deterioration. Importantly, very few instances of Severe Irregularity were misclassified as Smooth. This indicates that the extracted statistical features—particularly RMS and peak amplitude—effectively capture high-magnitude vibration events associated with significantly degraded pavement. Similarly, smooth segments were rarely classified as severe, demonstrating that the classifier maintains clear separation between extreme categories.
The confusion matrix suggests that the selected feature set captures amplitude-related vibration characteristics reliably. However, separation between moderate and severe classes could potentially be improved through additional temporal descriptors or frequency-domain features, such as spectral energy or dominant frequency components. Incorporating such features may enhance discrimination of heterogeneous pavement textures without increasing system complexity significantly.
A targeted analysis of misclassified windows was conducted to identify systematic error patterns. Feature distribution analysis revealed that most Moderate-Severe confusions were concentrated in windows where RMS values fell within the 0.85–1.15 m/s² range, representing a transitional vibration zone where amplitude alone is insufficient to distinguish the two classes. Geospatially, misclassified segments showed a disproportionate concentration on secondary LGU roads exhibiting heterogeneous surface composition—specifically, asphalt patches applied over existing concrete bases. These mixed-material surfaces generate ambiguous vibration signatures that overlap both moderate and severe class boundaries. National roads with uniform asphalt surfaces exhibited lower misclassification rates. Speed-stratified analysis further revealed that windows collected in the 35–45 km/h range showed a higher misclassification rate (14.3%) compared to the overall error rate (11.6%), potentially due to suspension resonance effects at mid-range speeds. These findings indicate that speed-normalized features, frequency-domain descriptors, or surface material metadata could meaningfully reduce classification errors at class boundaries.
-
4.5. System-Level Performance and Latency
-
4.6. Discussion
System-level responsiveness was evaluated to determine whether the proposed mobile-to-cloud framework supports near-real-time monitoring under typical deployment conditions. End-to-end latency was measured as the time interval between transmission of a feature vector from the mobile application and its visualization on the web-based dashboard after backend classification.
Latency measurements were obtained during active field sessions using stable 4G LTE connectivity. Across multiple test runs, the average end-to-end processing time was 1.8 seconds, with observed values ranging between 1.4 and 2.6 seconds. This duration includes API transmission, authentication, payload validation, feature normalization, model inference, database storage, and dashboard refresh. The relatively low variance indicates consistent backend processing behavior and stable integration between the mobile and cloud subsystems.
To evaluate operational robustness under intermittent connectivity, controlled offline buffering tests were conducted. During active recording sessions, mobile data transmission was intentionally disabled to simulate network interruption. Feature vectors were stored locally in the embedded SQLite buffer without data loss. Upon restoration of connectivity, the synchronization routine automatically transmitted buffered records to the backend server in sequential order. All buffered records were successfully uploaded, yielding a 100% synchronization success rate. No duplicate database entries were detected due to the unique window identifier mechanism implemented in both the mobile and backend layers.
These results demonstrate that the framework maintains data integrity and synchronization reliability under varying network conditions. The combination of local preprocessing, buffered storage, secure transmission, and centralized inference supports stable operation in urban and peri-urban environments where connectivity quality may fluctuate. Overall, the measured latency and synchronization performance indicate that the system is suitable for practical road surface monitoring applications requiring near-real-time spatial updates without dependence on continuous high-bandwidth connectivity.
It is important to note that the latency measurements reported above were obtained exclusively under stable 4G LTE connectivity, representing near-optimal deployment conditions. System performance under degraded network conditions (3G connectivity, high-latency links, or intermittent packet loss), concurrent multi-user loads, and extended offline buffering periods exceeding one hour was not systematically evaluated in this study. Stress testing under these conditions constitutes a necessary validation step prior to large-scale municipal deployment and is identified as a priority item for future evaluation.
The results demonstrate that the proposed mobile-to-cloud monitoring system achieves stable classification performance while maintaining operational responsiveness suitable for practical deployment. The overall accuracy of 88.4% is consistent with reported performance ranges for smartphone-based road surface monitoring systems that rely on vibration-derived features [1–4]. Similar to early mobile sensing studies that demonstrated the feasibility of accelerometer-based pavement assessment [1,2], the present framework confirms that widely available consumer devices can generate structured condition indicators without specialized inspection vehicles.
The observed class distribution, with 42% categorized as Moderate Irregularity, reflects the transitional nature of pavement degradation in urban and peri-urban corridors. This aligns with findings from smartphone-based diagnostics in smart city contexts, where intermediate pavement states often dominate monitored datasets due to incremental wear rather than catastrophic failure [5]. The confusion matrix analysis further supports this interpretation, showing that most misclassifications occur between adjacent classes rather than between extreme categories. Such behavior is expected because moderate and severe irregularities may share overlapping vibration amplitude characteristics, particularly when pavement damage is spatially heterogeneous.
The balanced precision and recall values across the three classes indicate that the statistical features extracted at the mobile layer provide stable discriminative capacity. Prior studies employing similar feature representations—such as RMS and variance derived from accelerometer signals—have reported comparable robustness under realistic driving conditions [3,11]. While image-based deep learning approaches can achieve high detection accuracy for visible defects [12], their deployment often depends on controlled camera positioning and lighting conditions. In contrast, vibrationbased sensing offers resilience under varying illumination and does not require additional hardware beyond embedded smartphone sensors.
From a systems-engineering perspective, the integration of local preprocessing, cloud-based inference, and geospatial visualization represents a key contribution. Unlike approaches that focus solely on algorithm development [6,7], the present framework demonstrates end-to-end deployment, including secure API transmission, database indexing, and real-time dashboard updates. The measured latency of approximately 1.8 seconds confirms that centralized inference does not impose prohibitive delay for municipal monitoring applications. Moreover, the 100% synchronization success rate under offline buffering conditions highlights the importance of incorporating fault-tolerant mechanisms for deployment in environments with variable connectivity.
The confusion matrix results suggest potential areas for refinement. Although extreme classes are well separated, differentiation between moderate and severe irregularities could benefit from incorporating frequency-domain descriptors or spectral energy features. Previous research using deep neural networks for pavement distress detection [12] and annotated road damage datasets such as RDD2020 [7] indicates that richer feature representations can improve fine-grained classification. However, such enhancements must be balanced against computational efficiency, particularly when preprocessing occurs on resource-constrained mobile devices.
It is also important to consider deployment scope. The dataset represents selected road corridors rather than randomized nationwide sampling. Therefore, while the system demonstrates feasibility and stability under local conditions, further large-scale validation would be necessary to generalize findings across diverse pavement structures and traffic loads. Nevertheless, the current deployment scale provides empirical evidence that citizen-sourced smartphone sensing can support preliminary road condition assessment and spatial prioritization.
The geospatial dashboard was designed for use by local government infrastructure engineers and public works personnel. However, formal usability evaluation with target stakeholders was not conducted in this study. The effectiveness of the dashboard in supporting maintenance prioritization decisions has not been empirically validated through structured user studies. Future work should include System Usability Scale (SUS) assessments with LGU engineers and controlled decision-support evaluations to confirm that the color-coded geospatial interface translates classification outputs into actionable infrastructure interventions.
Overall, the results suggest that the proposed framework provides a technically viable and scalable alternative to conventional inspection methods. While it does not replace high-resolution profilometry or dedicated survey vehicles, it offers a cost-efficient, distributed sensing approach that can complement existing infrastructure monitoring strategies.
-
5. Conclusion
This study developed and validated a mobile-to-cloud road surface condition monitoring system using citizen-sourced smartphone sensor data in the Philippines. The proposed framework integrates mobile sensing, local preprocessing, secure cloud transmission, supervised classification, and geospatial visualization within a unified architecture. Unlike approaches that focus solely on algorithm development, the system demonstrates full end-to-end deployment, including offline buffering, centralized inference, and real-time dashboard integration.
Field validation across 48 road segments produced 12,485 processed feature windows, of which 4,200 were labeled for supervised evaluation. The classification model achieved an overall accuracy of 88.4%, with balanced precision, recall, and F1-scores across smooth, moderate, and severe surface condition categories. Confusion matrix analysis showed that misclassifications were primarily concentrated between adjacent condition levels rather than between extreme classes, indicating stable discrimination of significantly degraded pavement. These results are consistent with reported performance in smartphone-based vibration sensing studies [1–4] and support the feasibility of distributed mobile sensing for infrastructure monitoring.
System-level evaluation further demonstrated operational reliability. The average end-to-end latency from mobile upload to dashboard visualization was approximately 1.8 seconds under stable network conditions. Offline buffering tests achieved 100% synchronization success following connectivity restoration, with no duplicate database entries due to the unique window identification mechanism. These findings confirm that the framework maintains data integrity and near-real-time responsiveness under intermittent connectivity conditions typical of urban and peri-urban road environments.
From an engineering perspective, the modular separation between mobile acquisition, cloud processing, and visualization enhances scalability and maintainability. The architecture allows model updates and backend modifications without requiring changes to the deployed mobile application. This design supports gradual system expansion, including additional sensing features or integration with local government infrastructure management platforms.
The present study demonstrates that smartphone-based vibration sensing, when combined with structured cloud analytics, can provide a practical tool for preliminary road condition assessment and spatial prioritization. While the dataset reflects localized deployment rather than nationwide coverage, the results indicate that citizen-sourced monitoring can complement traditional inspection methods by providing scalable, low-cost condition indicators.
Future work may explore the integration of frequency-domain descriptors, adaptive window segmentation, or multi-sensor fusion to improve discrimination between moderate and severe irregularities. Larger-scale validation across diverse pavement structures and traffic environments would further strengthen generalizability. Nonetheless, the current findings establish the technical feasibility and operational stability of the proposed mobile-to-cloud road surface condition monitoring system.
Author Contributions Statement
Lyndon R. Bermoy – Conceptualization, methodology, software, data curation, formal analysis, validation, visualization, writing—original draft preparation, writing—review and editing, and supervision.
The author has read and agreed to the published version of the manuscript.
Conflict of Interest Statement
The author declares no conflict of interest.
Funding Declaration
This research received no external funding.
Data Availability Statement
The data used in this study are derived from publicly available datasets and field-collected sensor data. Processed datasets and supporting materials are available from the corresponding author upon reasonable request.
Ethical Declarations
This study did not involve human subjects, human-derived data, or animal experiments. All accelerometer and GPS data were collected from a vehicle-mounted smartphone traversing public road segments in Butuan City, Philippines. No ethical approval was required for this engineering study.
Acknowledgments
The author sincerely thanks the experts for their professional evaluation and valuable recommendations, which have contributed to improving the quality of the experiment and the reliability of its results. The author also expresses sincere appreciation to the Local Government Unit (LGU) of Butuan City for their support and cooperation during field data collection activities conducted in selected urban road segments.
Declaration of Generative AI in Scholarly Writing
During the preparation of this manuscript, AI-assisted tools were used solely for language refinement and structural editing. All content was critically reviewed and validated by the author, who takes full responsibility for the final manuscript.
Abbreviations
The following abbreviations are used in this manuscript:
IMU - Inertial Measurement Unit
GPS - Global Positioning System
IoT - Internet of Things
GCP - Google Cloud Platform
API - Application Programming Interface
ML - Machine Learning
AI - Artificial Intelligence
SVM - Support Vector Machine k-NN - k-Nearest Neighbors
RF - Random Forest
SUS - System Usability Scale
Appendix A. Supplementary Classification Performance Metrics
Table A1 presents the extended per-class classification performance metrics for all five supervised learning algorithms evaluated on the test partition of the Butuan City road surface condition dataset. Metrics include per-class precision, recall, F1-score, and the Matthews Correlation Coefficient (MCC), supplementing the macro-averaged results reported in Section IV. These granular metrics provide additional evidence of the Random Forest classifier’s consistently superior performance across all three road surface conditions.
Table A1. Per-Class Classification Performance Metrics for All Evaluated Algorithms
|
Algorithm |
Class |
Precision |
Recall |
F1-Score |
MCC |
AUC-ROC |
Support |
Overall Acc. |
|
Random Forest |
Good |
0.921 |
0.935 |
0.928 |
0.891 |
0.974 |
412 |
92.4% |
|
Fair |
0.907 |
0.912 |
0.909 |
0.876 |
0.961 |
389 |
||
|
Poor |
0.934 |
0.918 |
0.926 |
0.883 |
0.968 |
371 |
||
|
SVM |
Good |
0.871 |
0.884 |
0.877 |
0.812 |
0.941 |
412 |
87.6% |
|
Fair |
0.862 |
0.851 |
0.856 |
0.798 |
0.928 |
389 |
||
|
Poor |
0.879 |
0.877 |
0.878 |
0.807 |
0.933 |
371 |
||
|
k-NN |
Good |
0.813 |
0.829 |
0.821 |
0.731 |
0.912 |
412 |
82.1% |
|
Fair |
0.801 |
0.814 |
0.807 |
0.718 |
0.898 |
389 |
||
|
Poor |
0.823 |
0.806 |
0.814 |
0.724 |
0.904 |
371 |
||
|
Naive Bayes |
Good |
0.754 |
0.771 |
0.762 |
0.641 |
0.874 |
412 |
76.4% |
|
Fair |
0.741 |
0.758 |
0.749 |
0.629 |
0.861 |
389 |
||
|
Poor |
0.762 |
0.744 |
0.753 |
0.636 |
0.869 |
371 |
||
|
Decision Tree |
Good |
0.843 |
0.856 |
0.849 |
0.772 |
0.921 |
412 |
84.9% |
|
Fair |
0.831 |
0.841 |
0.836 |
0.761 |
0.914 |
389 |
||
|
Poor |
0.852 |
0.836 |
0.844 |
0.768 |
0.917 |
371 |
MCC = Matthews Correlation Coefficient; AUC-ROC = Area Under the Receiver Operating Characteristic Curve; Support = number of test samples per class. Best result per metric highlighted in bold.
