Development of Regression Models for Assessing Fire Risk of Some Indian Coals

Author: Devidas S. Nimaje, D.P. Tripathy, Santosh Kumar Nanda
Journal: International Journal of Intelligent Systems and Applications(IJISA) @ijisa
Article in issue: 2 vol.5, 2013.
Free access
Spontaneous combustion of coals leading to mine fires is a major problem in Indian coal mines that creates serious safety and mining risk. A number of experimental techniques based on petrological, thermal and oxygen avidity studies have been used for assessing the spontaneous heating liability of coals all over the world. Crossing point temperature (CPT) is one of the most common methods in India to assess the fire risk of coal so that appropriate strategies and effective action plans could be made in advance to prevent occurrence and spread of fire and hence minimize coal loss. In this paper, the spontaneous heating risks of some of the Indian coals covering few major coalfields were assessed using CPT apparatus. Statistical analysis was carried out between CPT and the proximate analysis parameters and it was found that the Mixture Surface Regression (MSR) model was more effective and gave very good residual values as compared to the polynomial and simple multiple regression models. The performance of Anderson-Darling testing was done between the prediction results of MSR model and measured value of CPT showed that the residual follows normal distribution hence justifies the suitability of model for the prediction of spontaneous heating liability of coal.
Spontaneous Combustion, Crossing Point Temperature, Proximate Analysis, Coal
Short address: https://sciup.org/15010365
IDR: 15010365
Text of the scientific article Development of Regression Models for Assessing Fire Risk of Some Indian Coals
Published Online January 2013 in MECS
Coal is the most important and abundant fossil fuel in India. It is the most dominant energy source in India's energy scenario. It meets around 55% of primary commercial energy needs in India against 29% the world over. Around 66% of India's power generation is coal based. Commercial primary energy consumption in India has grown by about 700% in the last four decades. India is the third largest coal producing country in the world after China and USA [1]. Mine fires in Indian coalfields are generally caused by spontaneous combustion of coal despite various preventive technologies have been extensively practiced. The spontaneous heating susceptibility of different coals varies over a wide range and it is important to assess their degree of proneness for taking preventive measures against the occurrence of fires to avoid loss of lives and property, sterilization of coal reserves and environmental pollution and raise concerns about safety and economic aspects of mining etc [2]. In order to find out the susceptibility risk of coals to spontaneous heating, the different experimental methods have been attempted by researchers across the world.
Crossing point temperature method is mostly adopted in India by researchers and coal companies to know the susceptibility of coal in advance. This method is also used by various researchers, scientists and academicians in other countries like Australia [3], New Zealand [4], Turkey [5], U.K. [6], Canada [7], China [8] and Czech Republic [9]. Attempt has been made to modify the crossing point temperature apparatus [10] to a certain extent without changing the conditions against which it was designed. In India, the various researchers, scientists and academicians focused on different Indian coalfields specifically North Eastern Coalfields (NEC), Bharat Coking Coal Limited (BCCL), Mahanadi Coalfields Limited (MCL), South Eastern Coalfields Limited (SECL), Northern Coalfields Limited (NCL), Singareni Collieries Company Limited (SCCL), Neyveli lignite but not made major focused on coal seams of Western coalfields limited (WCL) which is a subsidiary of Coal India Limited.
In this paper, an attempt was made by the investigators to analyze thirty two coal samples from major coalfields of India and tests were conducted to assess their fire risk based on CPT and proximate analysis using different types of regression models. The paper comprises of the following sections: sample collection and preparation, proximate analysis method, crossing point temperature method, results and analysis. Regression models were developed for assessing fire risk of some Indian coals.
-
II. Sample Collection and Preparation
Thirty two non-coking and coking coal samples were collected from various coalfields of India and were coded from sample 1 to sample 32 and are listed in Table II. Sample collection site was selected with practically no dirt bands in order to maintain uniformity, covering more or less the same area. Section wise channel (30 cm x 10 cm) samples were collected from the seams with the help of chisel and hammer, after dressing down the coal face, to avoid contamination as per IS: 436- Part I/Section I - 1964 [11] and the method (channel sampling) is shown in Figure 1. The in-situ coal samples were collected on a rexin cloth from individual sections of seams and were further broken down to a convenient size, coned and quartered at sampling sites in the mine itself or in the laboratory to get a representative sample and then were quickly transferred into an air tight containers or air tight polythene so that they were not oxidized. The collected coal samples were crushed and grounded to the required size after sieving for experimentation as per IS: 436-Part I/Section 1-1964. The prepared coal samples were kept it in an air tight container.
Seam Height
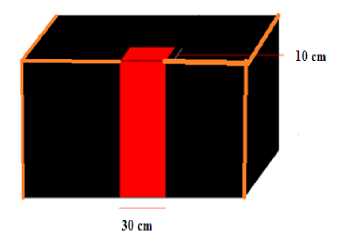
Face width
Fig. 1: Channel sampling method
-
III. Proximate Analysis Method
The parameters are most important to take the necessary advance preventive measures in a coal mine from spreading the coal fire seam wise. The four parameters viz. moisture, volatile matter, ash and fixed carbon of the collected thirty two coal samples were calculated on as received basis in a laboratory following Indian standard IS:1350 - Part I-1984 [12]. For the above said parameters of proximate analysis, it required
one gram of coal sample of -72 mesh size. The coal sample was kept it in a furnace at a temperature of 105 0 C to 110 0 C for one and half hour, the moisture percentage was calculated based on the difference in initial and final weight. The ash is also calculated on the basis of keeping the coal sample in a muffle furnace at a temperature of 850 0 C for two hour, and finds the ash percentage by difference. For determination of the volatile matter, the coal samples were kept in a muffle furnace at a temperature of 925 0 C for seven minutes and were calculated as per the Indian standard procedure. Fixed carbon was calculated after deducting moisture, ash and volatile matter from 100.
-
IV. Crossing Point Temperature Method
Crossing Point Temperature (CPT) is the lowest temperature at which the temperature of coal coincides with that of the furnace/bath as shown in Figure 2. It is also called the relative ignition temperature. The heating rate, the air flow and particle size must be optimized. The commonly used air bath CPT apparatus is shown in Figure 3 [13] and it requires the following:
-
• Amount of coal: 4 gm. of coal
-
• Size of coal: - 100 + 200 mesh BSS
-
• Heating rate: 1°C/min.
-
• Oxygen/Air flow rate: 80 ml/min.
The air bath crossing point temperature apparatus was used to determine the CPT of the collected coal samples with few modifications in the original apparatus:
-
• Rotameter is used in place of U-tube flowmeter.
-
• Oxygen is purging at 80 ml/min rate.
-
• Drying tower is used to absorb moisture in place of chemical circuit used in air flow circuit.
-
• Furnace/bath temperature controller is used in place of dimmerstat to maintain a constant heating rate 1 0 C/min.
In this method, the coal sample (4 gm.) of -100 +200 mesh BSS was heated in a reaction tube in the tubular furnace at constant 1 0 C/min heating rate; with oxygen purging through it at a predetermined rate (80 ml/min) till the coal temperature crossed the furnace or bath temperature. The heating rate was controlled by furnace/bath controller and the readings were collected at an interval of five minutes. The graph was plotted between bath and coal temperature with respect to time (Figure 2) and the CPT was found out to know the liability of coal to spontaneous heating. The fire risk ratings of thirty two coal samples were found out using Table I classification and are listed in Table III. Figure 4 represents the CPT curve of sample 1.
Table1: Fire Risk to Spontaneous Heating Liability of Coals [2]
|
CPT(0C) |
Fire risk |
|
120 to 140 |
High |
|
140 to 160 |
Medium |
|
>160 |
Low |
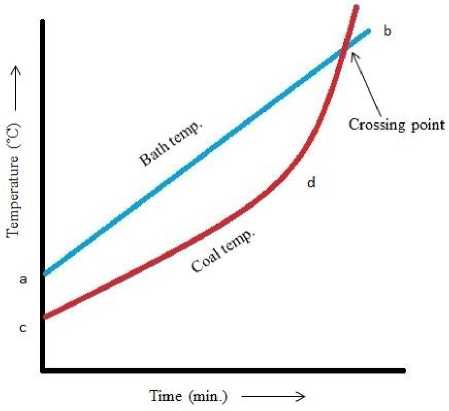
Fig 2.CPT curve under linear heating rate [10]
-
V. Results and Analysis
The results of the proximate analysis are listed in Table II and Crossing point temperature in Table III with fire risk to spontaneous heating of the collected coal samples.
Where,
a and c - Starting point under room temperature of bath and coal
b - Bath temperature d - Coal temperature
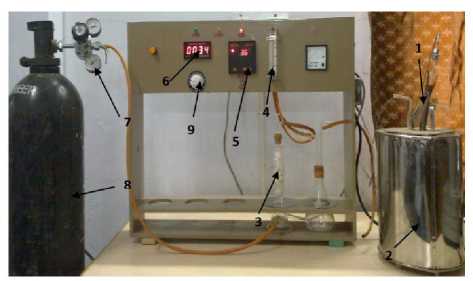
Fig 3.Crossing point temperature apparatus
Where,
-
1 - Reaction tube
-
2 - Tubular furnace
-
3 - Drying tower
-
4 - Rotameter
-
5 - Bath temperature
-
6 - Coal temperature
-
7 - Pressure gauge
-
8 - Oxygen cylinder
-
9 - Furnace temperature controller
Table 2: Proximate Analysis of Coal Samples
|
Sample |
M% |
A% |
VM% |
FC% |
|
1 |
6.03 |
14.5 |
39.97 |
39.5 |
|
2 |
4 |
22 |
37 |
37 |
|
3 |
6.5 |
16 |
35.5 |
42 |
|
4 |
3.5 |
54 |
22.5 |
20 |
|
5 |
5.5 |
16 |
34.5 |
44 |
|
6 |
6 |
17.5 |
33.5 |
43 |
|
7 |
7 |
16 |
31.5 |
45.5 |
|
8 |
11 |
13.5 |
30 |
45.5 |
|
9 |
4 |
45 |
23.5 |
27.5 |
|
10 |
4 |
40 |
26 |
30 |
|
11 |
1.40 |
51.48 |
19.3 |
27.82 |
|
12 |
4.13 |
61.48 |
28.17 |
6.2 |
|
13 |
2.80 |
13.46 |
30.19 |
53.55 |
|
14 |
2.63 |
55.5 |
20.92 |
20.95 |
|
15 |
3.89 |
16.2 |
35.55 |
44.36 |
|
16 |
0.93 |
63.3 |
19.78 |
15.99 |
|
17 |
1.36 |
65.45 |
26.49 |
6.7 |
|
18 |
7.94 |
58.47 |
28.4 |
5.19 |
|
19 |
4.03 |
38.06 |
31.21 |
26.7 |
|
20 |
4.54 |
50.33 |
29.38 |
15.75 |
|
21 |
4.39 |
52.7 |
31.16 |
11.75 |
|
22 |
4.06 |
54.12 |
30.19 |
11.63 |
|
23 |
2.36 |
55.45 |
30.98 |
11.21 |
|
24 |
2.15 |
54.44 |
29.91 |
13.50 |
|
25 |
2.53 |
56.3 |
32.86 |
8.31 |
|
26 |
8.21 |
19.3 |
44.35 |
28.14 |
|
27 |
2.13 |
25.94 |
33.42 |
38.51 |
|
28 |
2.73 |
14.46 |
35.83 |
46.98 |
|
29 |
3.76 |
25.68 |
34.13 |
36.43 |
|
30 |
3.16 |
15.28 |
35.99 |
45.57 |
|
31 |
3.66 |
37.84 |
25.88 |
32.62 |
|
32 |
1.44 |
50.86 |
18.05 |
29.65 |
A non-linear statistical relationship was made between proximate analysis parameters as the input parameters (Moisture, Ash, Volatile Matter, and Fixed Carbon) and Crossing point temperature, as the output parameter. Different multi layer regression models were tried and their residual values were determined. For getting good R2 value, statistical analyses were conducted and the following equations were obtained based on the three developed models i.e. Polynomial Regression model, Mixture Surface Regression model and Simple Multiple Regression model.
Prediction equation for: CPT (Polynomial Regression Model):
CPT = 420.057129 - 3.1992652*M - 0.19743168*M2 - 3.8858502*A + 0.023967411*A2 - 2.8288549*VM + 0.014735452*VM2-0.03941744*FC2 (1)
Where,
M - Moisture
A - Ash
VM - Volatile matter
FC - Fixed carbon
Table 3: Crossing Point Temperature (CPT) of Coal Samples
|
Sample |
CPT (0C) |
Fire risk |
|
1 |
198 |
Low |
|
2 |
189 |
Low |
|
3 |
182 |
Low |
|
4 |
210 |
Low |
|
5 |
180 |
Low |
|
6 |
169 |
Low |
|
7 |
207 |
Low |
|
8 |
155 |
Medium |
|
9 |
193 |
Low |
|
10 |
180 |
Low |
|
11 |
198 |
Low |
|
12 |
178 |
Low |
|
13 |
174 |
Low |
|
14 |
184 |
Low |
|
15 |
170 |
Low |
|
16 |
201 |
Low |
|
17 |
220 |
Low |
|
18 |
162 |
Low |
|
19 |
215 |
Low |
|
20 |
164 |
Low |
|
21 |
199 |
Low |
|
22 |
182 |
Low |
|
23 |
181 |
Low |
|
24 |
174 |
Low |
|
25 |
203 |
Low |
|
26 |
188 |
Low |
|
27 |
199 |
Low |
|
28 |
185 |
Low |
|
29 |
179 |
Low |
|
30 |
196 |
Low |
|
31 |
194 |
Low |
|
32 |
202 |
Low |
Prediction equation for CPT (Mixture Surface Regression model):
CPT=-50.414305*M+2.89881215*A+
7.67399531*VM
+2.09061834*FC+0.531449022*M*A+0.356454534*
M*VM - 0.10914531*A*VM + 0.688658679*M*FC +.
004052639*A*FC–0.10833481*VM*FC(2)
Prediction equation for CPT (Simple Multiple Regression Model):
CPT= 195.610661 - 3.2904948*M+
0.042956349*A+ 0.138566627*VM(3)
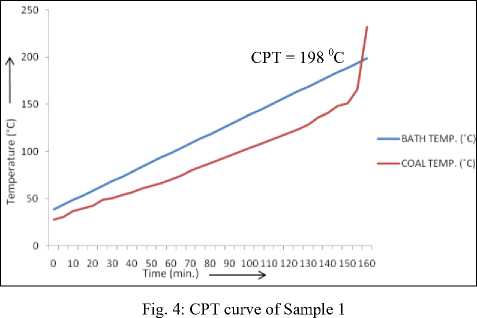
Table IV represents the analysis of the developed three multiple regression models and from the residual analysis, it was found that Mixture Surface Regression (MSR) model gives very good R 2 value (0.995731) and it will be used for solving this proposed problem. Figure 5 represents analysis of residual value with the number of data set. It was found that all the residual values are equally distributed within zero error limits. Figure 6 represents the performance of predicted values with residual values and it was found that all the residual values are equally and normally distributed and this graph highlights the prediction potential of the model [14, 15].
Case Numbers vs. Residuals
Dependent variable: CRT
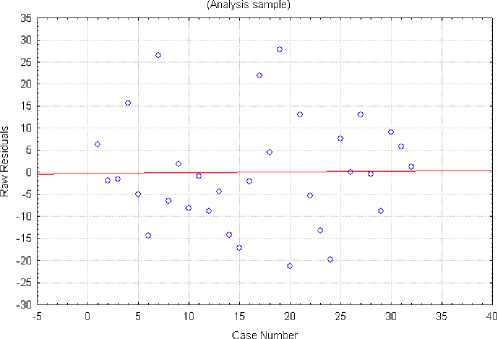
Fig. 5: Analysis of residuals with case number
Table 4: Performance of the Developed Statistical Analysis
|
Dependent Variable |
Performance of Multiple Regression Models |
||||
|
Polynomial Regression model |
Multiple R2 |
Multiple R2 |
Adjusted R2 |
Remark |
|
|
CPT |
0.572284 |
0.327509 |
0.131365 |
Not effective but good residual value |
|
|
Mixture Surface Regression model |
0.997863 |
0.995731 |
0.993790 |
Effective residual value and good to use |
|
|
Simple Multiple Regression model |
0.471246 |
0.222073 |
0.138724 |
Poor residual value |
|
P re d i cte d vs. R e si d u a I Va I u e s
Dependent variable: CPT
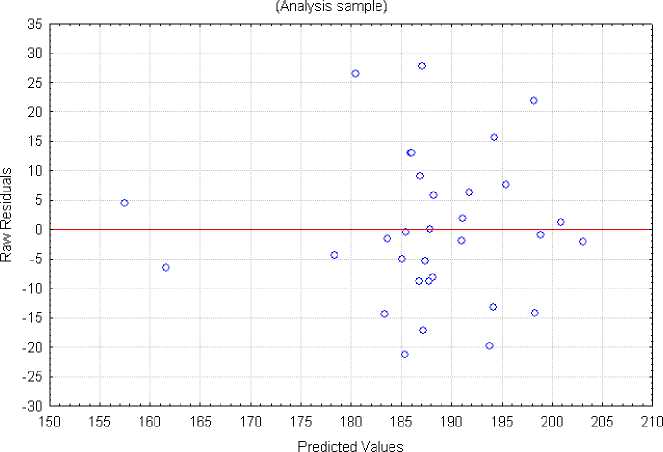
Fig. 6: Analysis of residuals with predicted values of MSR model
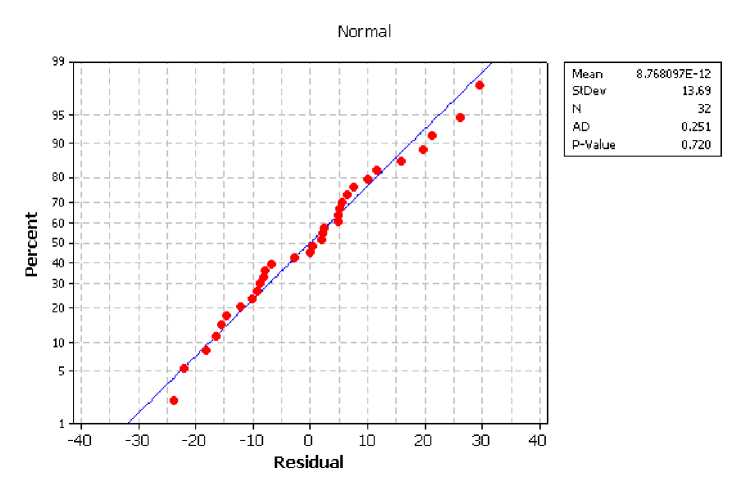
Fig. 7: Statistical performance study of MSR prediction model
Anderson-Darling (AD) testing was used for this analysis and the AD normality test results are shown in Figure 7. The test was done between the prediction results of MSR model and CPT measured value. Since p-value of the normality plots were found to be above 0.05, it signifies that residue follows normal distribution. Small percentage of error proved the suitability of above models for practical engineering applications.
-
VI. Conclusion
Statistical analysis between the CPT and the proximate analysis parameters shows that Mixture Surface Regression (MSR) model was more effective and gave very good residual values as compared to the polynomial and simple multiple regression models. Anderson-Darling testing was done between the prediction results of MSR model and measured value of CPT and it showed that the residual follows normal distribution hence justifies the suitability of the model for the prediction of spontaneous heating liability of coal.
References Development of Regression Models for Assessing Fire Risk of Some Indian Coals
- http://www.coal.nic.in/welcome.html- Coal: Choice for Indian energy.
- Tripathy D.P. and Pal B.K. Spontaneous heating susceptibility of coals-Evaluation based on experimental techniques. Journal of Mines, Metals and Fuels, Vol. 49, July 2001, pp. 236-243.
- J Beamish B.B. and Blazak D.G. Relationship between ash content and R70 self-heating rate of Callide coal. International Journal of Coal Geology, Vol. 64, 2005, pp. 126-132.
- Chen X. D. and Chong L.V. Several important issues related to the crossing-point temperature (CPT) method for measuring self-ignition kinetics of combustible solids. Process Safety and Environmental Protection, 1998, pp. 3-90.
- Kucuk A., Kadıoglu Y. and Gulaboglu M. S. A study of spontaneous combustion characteristics of Turkish lignite: particle size, moisture of coal, humidity of air. Combustion and Flame, Vol. 133, 2003, pp. 255–261.
- Nugroho Y.S., Mcintosh A.C. and Gibbs B.M. Using the crossing point method to assess the self-heating behavior of Indonesian coals. Proceedings, International symposium on combustion/the combustion institute, 1998, pp. 2981-2989.
- Ogunsola O.I. and Mikula R.J. A study of spontaneous combustion characteristics of Nigerian coals. Fuel, Vol. 70, Feb. 1991, pp. 258-261.
- Xuyao Q., Wang D., Milke J. A. and Zhong X. Crossing point temperature of coal. Mining Science and Technology (China), Vol.21, 2011, pp. 255-259.
- Zubicek Vaclav. Assessment of susceptibility of coal to spontaneous combustion in OKR. GeoScience Engineering, Vol. LIV, No.4, 2008, pp. 1-9.
- Ramlu M.A. Mine disasters and mine rescue, Oxford and IBH Publishing Co., New Delhi, 2007.
- I.S. (Indian Standard): 436 (Part I/Section I) – 1964, Method for sampling of coal and coke: sampling of coal, Manual sampling. Bureau of Indian Standards, New Delhi, pp. 3-23.
- I.S. (Indian Standard): 1350 (Part-I) – 1984, Methods of Test for Coal and Coke: Proximate Analysis. Bureau of Indian Standards, New Delhi, pp. 3-28.
- Mahadevan V. and Ramlu M. A. Fire risk rating of coal mines due to spontaneous heating. Journal of Mines, Metals and Fuels, Aug. 1985, pp. 357-362.
- Hill, T. and Lewicki, P. Statistics: Methods and Applications. StatSoft, Tusla, OK, 2007.
- Shirley Dowdy, Stanley Weardon and Daniel Chilko, Statistics for Research, John Wiley & Sons, USA, 2004.
