Digital Forensic Analysis of Tooth Wear in Prehistoric and Modern Humans

Author: Yuadi I., Koesbardiati T., Wicaksono R., Gurushankar K., Nisa’ K.
Journal: Archaeology, Ethnology & Anthropology of Eurasia @journal-aeae-en
Section: Anthropology and paleogenetics
Article in issue: 1 т.53, 2025.
Free access
In this study, we aimed to identify prehistoric and modern humans on the basis of the shape and texture of occlusal surfaces of their molars. Twelve specimens were tested (6 in each group). We used surface plot and plot profile analysis in the first experiment, and also three-dimensional (3D) surface plots, facet orientation, and roughness calculations in the second experiment, to test the deviation of the top gray or surface peak with fossa or surface valley and also bottom gray. Calculations from the three regions of interest indicate that the deviation results from prehistoric human teeth are smaller than those from modern human teeth. The calculated indices of molar surface roughness of prehistoric humans are generally lower than those of modern humans. The findings demonstrate that prehistoric human teeth were a bit more worn than modern human teeth.
Tooth wear, digital forensic, surface roughness, food ingredients, prehistoric human, modern human
Short address: https://sciup.org/145147255
IDR: 145147255 | DOI: 10.17746/1563-0110.2025.53.1.145-154
Text of the scientific article Digital Forensic Analysis of Tooth Wear in Prehistoric and Modern Humans
Teeth are a rather useful source of information in the identification of sex, age, and ethnic origin of humans (Kaifu et al., 2015; Krishan, Kanchan, Garg, 2015; Kurniawan et al., 2020). From an archaeological perspective, teeth are a valuable source owing to their durability, which often leads to them being found in good condition, because the enamel remains unchanged after the natural preservation of living organisms (Hillson, 2005: 1; Sperduti et al., 2018).
The shape of human teeth is strongly influenced by genetic factors (Berthaume, Lazzari, Guy, 2020). In addition, it can be influenced by a person’s diet, including eating habits and food production techniques
(Caglar et al., 2007). Humans who consume mainly fruits or other plant foods experience a decrease in the molar crowns; other factors are age and tooth wear (López-Torres et al., 2018). Eating habits of humans greatly affect the enamel hardness and the degree of tooth wear (Machado et al., 2022; Normando, de Almeida Santos, Abdo Quintão, 2016). For example, in Indonesia, particularly in its eastern regions, the culture of chewing betel leaves accelerates tooth wear (Murti, Koesbardiati, 2019; Permatasari, Artaria, 2015).
The type of food humans consume affects the structure or parts of their body, including the shape, size, and wear experienced by teeth (Scheid, Weis, 2012: 291), which play the key role in the digestion
There are several patterns of tooth wear experienced by humans. Nutrition is one of the main factors that influence its degree and patterns. Some previous studies stated that populations of hunter-gatherers had higher levels of dental wear than those with an agrarian economy or mixed foraging and cultivation subsistence (Molnar, 1971; Hinton, 1981; Smith, 1984; Kaifu, 1999; Larsen, 2002). The pattern of tooth wear in each human population is different, and can indicate the environmental lifestyle humans came from based on the types of food they consumed and how they chewed it. Teeth of prehistoric humans often exhibit flat molar surfaces with large cavities (Kurniawan et al., 2022), owing to consuming foods with crude fiber, such as hard-grain products (Eshed, Gopher, Hershkovitz, 2006). The diet of modern humans demonstrates the increasing number of soft and hard foods. The masticatory apparatus of modern humans has evolved and, though having the same common characteristics, is distinguished by moderate pterygoid bone, reduced alveolar process, and impacted third molars (Rose, Roblee, 2009). This is due to advanced food processing techniques (Das, Motghare, Singh, 2021; Masood, 2020).
In this study, the tooth surface analysis was carried out in order to find a new method in the scope of digital forensics. This analysis is often used to identify the level of hardness of a metal or other material. Hopefully, this method can be adapted for archaeological research.
Method
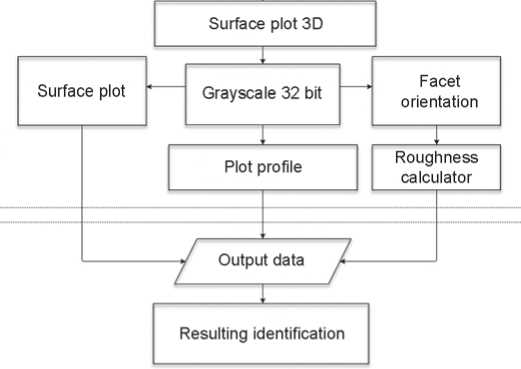
There are several stages in digital forensic analysis to determine the surface roughness of prehistoric and modern human teeth (Fig. 1). The mandibular specimen was digitalized using an X6812B smartphone with 50 MP f/1.6 (wide) and PDAF 2 MP (depth). Then, in the following stage, we used numerous plugins in Fiji (ImageJ) software to crop each molar image according to its size and start a 3D simulation. We utilized an HP Pavilion laptop with an Intel i7 processor, 8 GB RAM, and Windows 11 Pro to execute the program.
In the feature extraction stage, first, a 3D surface plot plugin was used to obtain a 3D image of the teeth by setting the grid size at 256, the smoothing scale at 25.0, the perspective at 0.0, and the lighting at 0.43. Second, a 32-bit grayscale filter was applied to the images. Third, we used surface plot and plot profile analysis to generate a histogram and visualize the level and contour of the tooth surface. Fourth, the facet orientation was conducted to increase the accuracy of the roughness calculation test, which was carried out to determine the level of surface roughness. In the last stage, the results were analyzed by observing the differences in the calculation of the deviations in the regions of interest (ROI) of each tooth (Fig. 2).
Feature extraction is a technique used to transform data into a more useful format to help identify differences in them. In this study, some features were used to identify differences in surface roughness between prehistoric and modern human molar teeth. First, a 3D surface plot was used. This method helps to create interactive plots of various types of images, where their luminance is interpreted as the height of the plot. The plot profile analysis was used to examine the surface contour of the object in a 3D model. On the basis of that image, a histogram was produced.
Second, the facet orientation plugin was used to view surface orientation results and statistics of topographic images obtained from profilometer results. The input image must be in a 32-bit format, and the user must provide the transverse distance between the pixels, expressed in the same units as the data range, which refers to the difference in height values or surface variations in the topographic image, encompassing the distance between the highest and lowest measured points on the surface. Third, the roughness calculation plugin was used, which displayed the statistical results of surface roughness
Digitalization
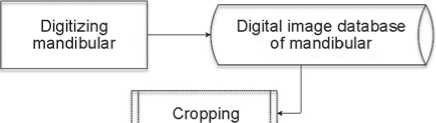
Feature extraction
Fig. 1. Framework for surface roughness test.
Identification result
ROI 1 (top gray), surface of peak
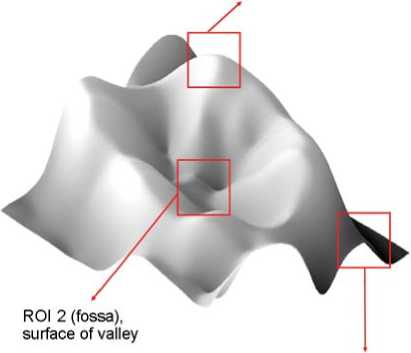
ROI 3 (bottom gray)
Fig. 2. Regions of the research.
levels based on topographic images. The roughness calculation values were as follows.
Arithmetic Average Roughness ( Ra ) is the arithmetic average of the absolute values of the surface profile’s height deviations from the mean line, regardless of their direction. The formula is below (Whitehouse, 2012: 52):
R 41О|У(Х)1*’ (1)
where L is the length of the surface profile, x is the position in the surface profile, and y(x) is a function that describes the surface deviation from the baseline at position x in the surface profile.
Quadratic Roughness ( Rq ), also known as RMS (Root Mean Square) Roughness, is the average deviation of the surface profile from the mean line. The formula is below (Ibid.: 53):
R = T Jo b'W]2^ 2.
Kurtosis of the assessed profile ( Rku ) measures the relative sharpness or flatness of the height distribution of the profile. The formula is below:
Rku ^^Jy^^- (3)
Skewness Roughness ( Rsk ) is a measure of the asymmetry of the surface profile. A positive skewness implies that the profile has more peaks than valleys, whereas a negative skewness suggests that the latter prevail. The formula is below:
l Jо . (4)
Highest Peak Roughness ( Rp ) is the vertical distance between the highest peak and the lowest valley within the assessment length. The formula is below (Ibid.):
Rp = Max x [y ( x )]. (5)
Lowest Valley Roughness of a surface profile ( Rv ) is the distance from the lowest point of the profile to the mean line. The formula is below (Ibid.):
R v = Min x [y (x )]. (6)
Total Height Roughness ( Rt ) is the vertical distance between the maximum profile peak height and the maximum profile valley depth in a surface profile. The formula is below (Ibid.):
R = Max x [У ( x )] — Min x [У ( x )]. (7)
Study materials
The dental data used in this study were provided by the Ethnography Museum at Airlangga University in Surabaya, Indonesia. Prehistoric specimens belong to 6 skeletons from Liang Bua-3 and -6 (LB-3, LB-6; Fig. 3, 4), Melolo-Urne-2 and -3 (Urne-2, Urne-3), and Sumba-2 and -F (SB-2, SB-F) in East Nusa Tenggara, Indonesia. The human remains from Liang Bua, discovered during excavations in 1965 (Murti, Suriyanto, Koesbardiati, 2013), are estimated to be 2600 years old (Oliveira et al., 2022). Archaeological finds from the above-mentioned sites include stone tools, flakes, bone fragments of bovids, pigs, porcupines, rats, fresh-water or sea mollusks, and also pottery, which suggests the lifestyle based on cultivation and foraging, characteristic of the period of transition to an agrarian economy (Atmosudiro, 1994: 126; Sukadana, 1981, 1984: 183).
Modern human teeth belong to the humans who lived in the territory of East Java during the industrial era (M-1–M-5; Fig. 5, 6) and the Majapahit era (M-6). Twelve specimens were analyzed (Table 1).
Experiment results
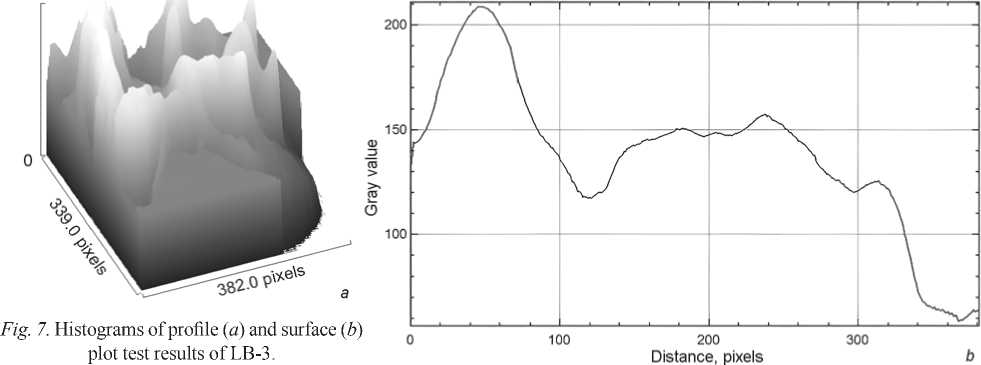
In the first experiment, prehistoric and modern human teeth were studied using the 3D plot of the molar crown, surface, and profile. The gray shades in the image show the value of the variable: the darker the color (gray value), the lower the variable value is. For each specimen, histograms were produced (Fig. 7, 8).
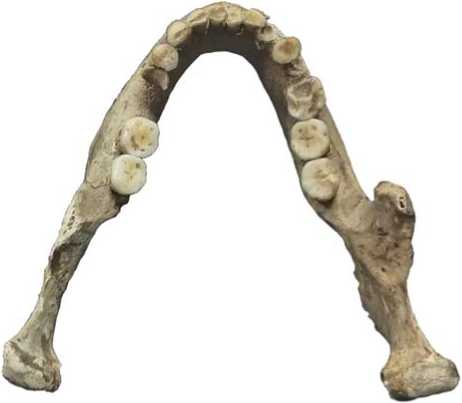
Fig. 3. Mandible of LB-3
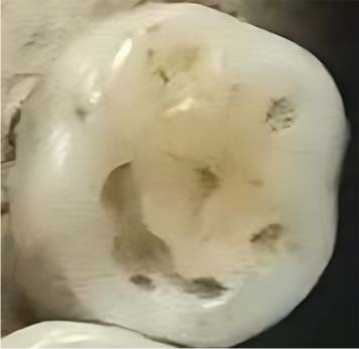
Fig. 4. Molar tooth of LB-3
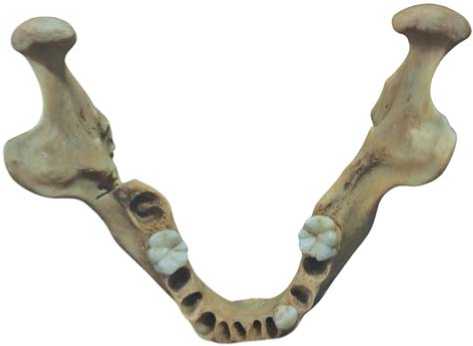
Fig. 5. Mandible of M-2
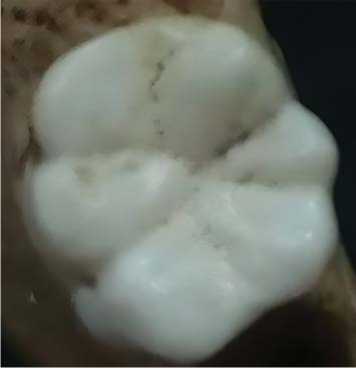
Fig. 6. Molar tooth of M-2
Table 1 . The sample of prehistoric and modern humans teeth under study
|
Specimen |
Age (year) |
Sex |
Dating |
Size (pixel) |
|
Prehistoric |
||||
|
LB-6 |
17–25 |
Female |
3390 ± 270 |
129 × 127 |
|
LB-3 |
25–35 |
Male |
to 3830 ± 120 BP |
129 × 127 |
|
SВ-2 |
25–35 |
Female |
2870 ± 60 BP |
288 × 284 |
|
SВ-F |
25–35 |
Male |
2870 ± 60 BP |
288 × 284 |
|
Urne-2 |
24–35 |
Female |
2870 ± 60 BP |
230 × 232 |
|
Urne-3 |
25–35 |
Male |
2870 ± 60 BP |
336 × 340 |
|
Modern |
||||
|
M-1 |
17–25 |
Male |
2010–2015 |
88 × 87 |
|
M-2 |
27–35 |
" |
2015 |
290 × 306 |
|
M-3 |
27–35 |
" |
2015 |
298 × 326 |
|
M-4 |
27–35 |
" |
2010–2015 |
294 × 292 |
|
M-5 |
25–35 |
Female |
1980 |
344 × 352 |
|
M-6 |
20–30 |
Male |
1529–1650 |
272 × 284 |
255.0
255.0
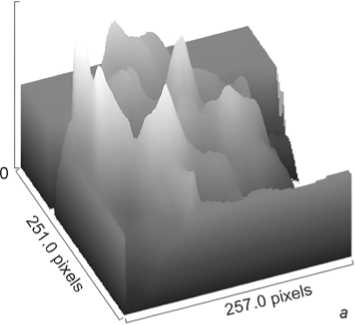
Fig. 8. Histograms of profile ( a ) and surface ( b ) plot test results of M-2.
The profile and surface plot test results provided the data characterizing the molars of modern and prehistoric humans (Tables 2, 3).
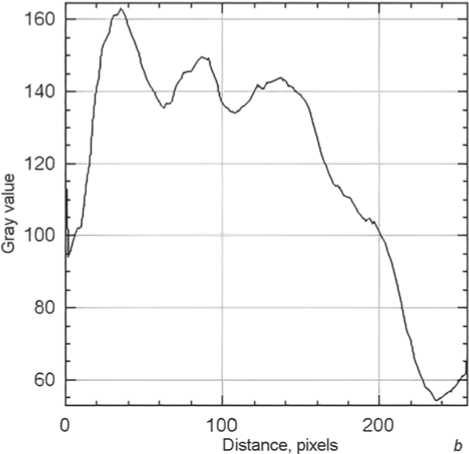
In the second experiment, the surface roughness of molars was analyzed. 3D surface plots from the first experiment were converted using the facet orientation plugin to the form of a polar plot (Fig. 9, 10). To determine the level of tooth roughness, the Rq, Ra, Rsk, Rku, Rp, Rv, and Rt parameters were used (Tables 4, 5).
Table 2 . Results of profile and surface plot analysis of prehistoric human teeth
|
Specimen |
Top gray value ( Y ) |
Bottom gray value ( Y ) |
Fossa |
Distance ( X ) |
Difference between gray values |
|
|
Top and bottom |
For peaks and valleys |
|||||
|
LB-6 |
158.90 |
29.10 |
58.70 |
316.00 |
129.80 |
100.20 |
|
LB-3 |
210.80 |
56.40 |
117.60 |
381.00 |
154.40 |
93.20 |
|
SВ-2 |
217.30 |
27.60 |
165.30 |
366.00 |
189.70 |
52.00 |
|
SВ-F |
181.40 |
124.60 |
150.16 |
428.00 |
56.80 |
31.24 |
|
Urne-2 |
201.50 |
94.10 |
150.10 |
389.00 |
107.40 |
51.40 |
|
Urne-3 |
152.40 |
101.20 |
116.66 |
367.00 |
51.20 |
35.74 |
|
Total |
1122.30 |
433.00 |
758.52 |
2247.00 |
545.70 |
363.78 |
|
Mean |
187.05 |
72.17 |
126.42 |
374.50 |
90.95 |
60.63 |
Table 3 . Results of profile and surface plot analysis of modern human teeth
|
Specimen |
Top gray value ( Y ) |
Bottom gray value ( Y ) |
Fossa |
Distance ( X ) |
Difference between gray values |
|
|
Top and bottom |
For peaks and valleys |
|||||
|
M-1 |
201.80 |
92.80 |
131.90 |
318.00 |
109.00 |
69.90 |
|
M-2 |
164.60 |
52.90 |
134.20 |
256.00 |
111.70 |
30.40 |
|
M-3 |
187.20 |
89.10 |
110.18 |
278.00 |
98.10 |
77.02 |
|
M-4 |
190.40 |
121.60 |
127.54 |
277.00 |
68.80 |
62.86 |
|
M-5 |
178.70 |
42.70 |
51.50 |
283.00 |
136.00 |
127.20 |
|
M-6 |
201.00 |
80.80 |
153.20 |
271.00 |
120.20 |
47.80 |
|
Total |
1123.70 |
479.90 |
708.52 |
1683.00 |
643.80 |
415.18 |
|
Mean |
187.28 |
79.98 |
118.09 |
280.50 |
107.30 |
69.20 |
Table 4. Summary of results of roughness calculation test of prehistoric human teeth
|
Specimen |
R q |
R a |
Rsk |
Rku |
R p |
R v |
R t |
|
LB-6 |
57.68 |
48.50 |
1.25 |
1.60 |
89.48 |
0.00 |
89.48 |
|
LB-3 |
59.08 |
50.30 |
1.24 |
1.58 |
89.48 |
0.00 |
89.48 |
|
SВ-2 |
59.00 |
50.75 |
1.21 |
1.51 |
89.32 |
0.00 |
89.32 |
|
SВ-F |
56.03 |
44.60 |
1.30 |
1.72 |
89.57 |
0.00 |
89.57 |
|
Urne-2 |
60.13 |
53.44 |
1.17 |
1.41 |
89.33 |
0.00 |
89.33 |
|
Urne-3 |
75.53 |
70.76 |
1.09 |
1.20 |
89.22 |
0.00 |
89.22 |
|
Total |
367.44 |
318.35 |
7.25 |
9.02 |
536.40 |
0.00 |
536.40 |
|
Mean |
61.24 |
53.06 |
1.21 |
1.50 |
89.40 |
0.00 |
89.40 |
Table 5. Summary of results of roughness calculation test of modern human teeth
|
Specimen |
R q |
R a |
Rsk |
Rku |
R p |
R v |
R t |
|
M-1 |
48.98 |
31.86 |
1.59 |
2.57 |
89.58 |
0.00 |
89.58 |
|
M-2 |
61.48 |
52.20 |
1.21 |
1.50 |
89.59 |
0.00 |
89.59 |
|
M-3 |
69.27 |
62.50 |
1.13 |
1.29 |
89.54 |
0.00 |
89.54 |
|
M-4 |
60.46 |
50.60 |
1.23 |
1.55 |
89.32 |
0.00 |
89.32 |
|
M-5 |
65.98 |
58.25 |
1.17 |
1.39 |
89.56 |
0.00 |
89.56 |
|
M-6 |
64.61 |
56.66 |
1.17 |
1.40 |
89.51 |
0.00 |
89.51 |
|
Total |
370.77 |
312.08 |
7.50 |
9.70 |
537.10 |
0.00 |
537.10 |
|
Mean |
61.80 |
52.01 |
1.25 |
1.62 |
89.52 |
0.00 |
89.52 |
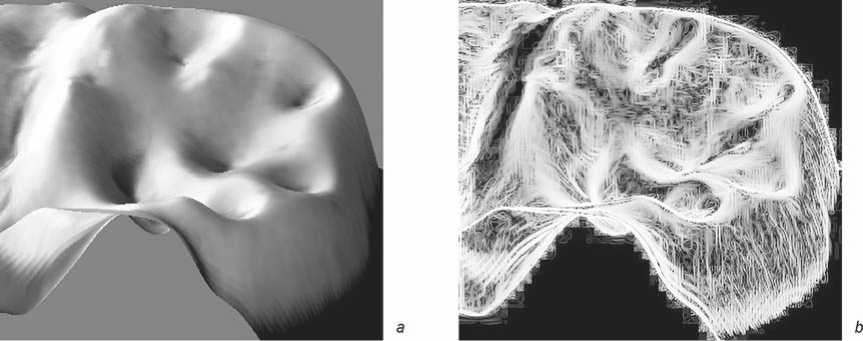
Fig. 9. Grayscale 32-bit 3D surface plot ( a ) and polar image facet orientation ( b ) of LB-3.
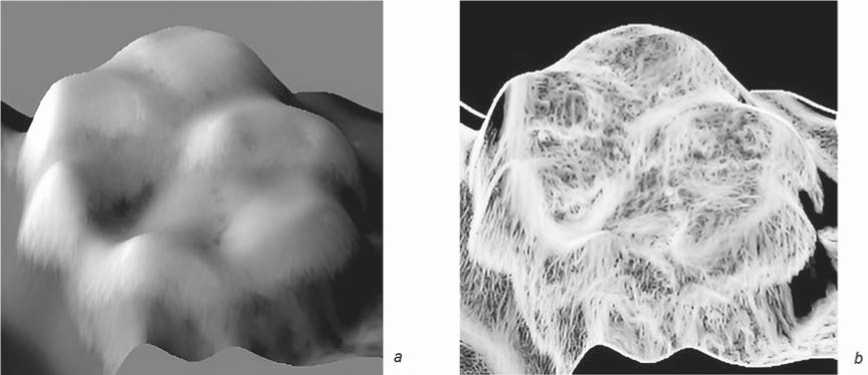
Fig. 10. Grayscale 32-bit 3D surface plot ( a ) and polar image facet orientation ( b ) of M-2.
Discussion
The examination of 3D molar surface plots has identified substantial changes in modern and prehistoric human teeth. The latter appear flatter and tend to have less deviation between the deepest fossa and the top of the crown, with an average depth of 60.63, as compared to modern humans, where the average is 69.20. The profile plot test has shown that prehistoric specimens had a more even and stable histogram pattern than modern human teeth, indicating less wear of the latter.
Although prehistoric humans’ average roughness ( Ra ) value is 1.05 m greater than that of modern humans, the quadratic roughness ( Rq ) value, which shows the same parameters as Ra , but is calculated by another method, is less (61.24 vs 61.80). Other calculations ( Rku , Rsk , Rp , and Rt ) in prehistoric humans are lower than in modern humans.
Overall, the results show that prehistoric human molars experienced relatively higher wear. Tooth wear could be caused by various factors, including environmental and socio-cultural, as well as the type of food consumed. All prehistoric humans whose teeth were examined in this study lived in the period of transition to an agrarian economy and had mixed hunting, foraging, and cultivation (horticulture) subsistence (Winterhalder, Kennett, 2006). Their diet included game meat, fresh-water or sea mollusks (with or without prior cooking), and plant products, which could have been eaten raw (Sukadana, 1981, 1984: 185; Atmosudiro, 1994: 126). In prehistoric times, this food required strong jaws, large canine teeth, and strong chewing muscles. Excessive friction resulted in tooth erosion (Das, Motghare, Singh, 2021; Masood, 2020). Furthermore, the high tooth wear shown by prehistoric humans could have been caused by the influence of abrasive materials, such as sand that got into food owing to inadequate cleaning of products or owing to the use of pottery as cooking utensils (Murti, Koesbardiati, 2019).
In contrast, modern humans have a more varied diet, and can choose between soft or hard foods, resulting in less tooth wear. The development of foodprocessing equipment, which becomes increasingly sophisticated and diverse, also influences the texture of the food consumed. However, eating habits and cultural practices can also contribute to the tooth wear. For example, in Indonesia, there is a tradition of chewing betel leaves, which causes tooth decay (Ibid.).
Conclusions
The study of forensic digital analysis of tooth wear is a promising effort to understand the history of human subsistencies and its change. By using digital image processing technology through surface roughness tests on the molars of prehistoric and modern humans, this research can differentiate the level of tooth wear. Our experiments showed that prehistoric human teeth experienced more wear than modern human teeth. The findings of this study also support the earlier conclusions as to the decrease of the level of dental wear from prehistoric to modern populations, caused by the transition to an agrarian economy. The results of this research can provide an alternative method for reconstructing the diet of individuals or populations based on tooth wear, allowing for more precise measurements through digital image processing.
Acknowledgement
This study was supported by the Airlangga University Research Center.
