“Digital Twin” of the Arctic Population in Demographic Research and Territorial Development Management

Author: Smirnov A.V.
Journal: Arctic and North @arctic-and-north
Section: Northern and arctic societies
Article in issue: 53, 2023.
Free access
The article considers “digital twins” of the population as a tool for socio-demographic research and territorial management. The experience of creating digital twins of the population and interactive websites devoted to demographic issues is systematized. A methodology for creating a digital twin of the Arctic population is proposed, based on three methodological principles: consideration of the hierarchy of territories, spatial representation of data, and combining demographic statistics with new digital data sources. The author has developed the Digital twin of the Arctic population — an interactive website (dashboard) containing detailed data on the Arctic population, including municipal and settlement levels. It includes demographic statistics, census results and data from digital platforms. The Digital twin of the Arctic population covers such issues as the size, dynamics and composition of the population, resettlement, natural and migration movement, labor and employment, transport movements, science and education, and the impact of the pandemic on demographic processes. Tools of ranking, multivariate analysis, clustering and forecasting of indicator values are implemented for researchers. From the viewpoint of state and municipal management, the main interest is the demographic profiles of regions and territories, reflecting up-to-date information about the demographic situation. Using the Digital twin of the Arctic population, the author draws conclusions about the spatial patterns of the demographic development of the Russian Arctic.
Population, demography, digital twins, dashboard, data source, governance, Arctic
Short address: https://sciup.org/148329499
IDR: 148329499 | UDC: [314.02+314.114](985)(045) | DOI: 10.37482/issn2221-2698.2023.53.260
Text of the scientific article “Digital Twin” of the Arctic Population in Demographic Research and Territorial Development Management
In the modern world, digital technologies have a great impact on all spheres of people’s lives [1, Lundgren A., Randall L., Norlén G. et al., p. 52]. Due to their high remoteness and urbanization, the Arctic territories are leaders in terms of Internet penetration and use of digital technologies [2, Smirnov A.V., p. 260]. Today, public and private information systems accumulate a huge amount of information about the population [3, Kitchin R., p. 62], which can be used in scientific research and public administration. However, with regard to the Russian Arctic, this information is scattered, fragmentary, and requires systematization and processing [4, Dmitrieva T.E.,
-
∗ © Smirnov A.V., 2023
The object of the study is the population of the Russian and global Arctic. The purpose of the article is to develop and test an interactive web application “Digital twin of the Arctic population”. The first part of the article is devoted to a review of existing experience in creating digital twins of the population and interactive websites containing detailed demographic data. The second part proposes a methodology for creating a digital twin of the Arctic population, based on three methodological principles: consideration of the hierarchy of territories, spatial representation of data, and combining demographic statistics with new digital data sources. The third part of the article is devoted to a description of the capabilities of the “Digital twin of the Arctic population” created as part of the study 1. The work draws some conclusions about the socio-demographic problems of the Russian Arctic and presents detailed demographic profiles of the Arctic territories.
Digital twins of the population and demographic dashboards
A digital twin is an evolving digital profile of the historical, current and future behavior of a physical object or process that helps optimize management efficiency 2. The term is most often applied to physical systems and processes. For example, there is a “Digital twin of Northern delivery”, developed at the Eastern Center for State Planning. This is an information system for optimizing the cost, timing and logistics of delivering vital cargo to hard-to-reach areas of the Far Eastern Federal District and the Arctic zone of the Russian Federation 3. Recently, the term “digital twin” has also been applied to social systems.
The “digital twin” of the population characterizes the population of countries, regions, cities or areas, considers the population through the prism of academic research, business or public administration using big geospatial data, spatial analysis methods, data science, artificial intelligence 4. An example of a digital twin of a population is the QUANT model developed at the Alan Turing Institute. It models urban development, including demographics, location of jobs and transport interactions in the UK [5, Batty M., Milton R.]. The model was created to support management decision-making, including during epidemics.
Technically, “digital twins” of the population are most often created in the form of interactive web applications — dashboards. The use of charts, tables, cartograms, and infographics in combination with various control elements allows analyzing data in various ways and arranging them [6, Wickham H.]. Dashboard is a working tool for specialists, allowing getting the necessary data in a convenient form. In public administration, dashboards of cities and regions are aimed at increasing the security, transparency and accountability of government activities [7, Matheus R., Janssen M., Maheshwari D.], as well as improving the quality and validity of decisions made [8, Nochta T., Wan L., Schooling J.M., Parlikad A.K.].
Some of the most detailed demographic dashboards include interactive maps of the 2021 UK Census 5. The maps allow visualization of data on demography, education, health, housing conditions and employment in England and Wales, not only at the level of districts and settlements, but also for individual statistical observation areas consisting of just a few houses. The population of almost every of the 189.000 sites ranges from 100 to 625 people, providing users with highly detailed data. The City Population website 6, created by Thomas Brinkhoff, a professor at the Institute for Applied Photogrammetry and Geoinformatics in Oldenburg, contains regularly updated dashboards about the population of cities and territories around the world.
Another area of application of demographic dashboards is demonstration of modelling and forecasting results. For example, the Austrian Wittgenstein Center for Demography and Global Human Capital has developed a dashboard 7 that allows forecasting the dynamics and educational composition of the world’s population up to 2100 under five forecast scenarios. Gender and age pyramids with details by education levels and cartograms are available [9, Lutz W., Goujon A., K.C. S., Stonawski M., Stilianakis N.].
In Russia, interactive demographic databases containing some elements of dashboards (for example, the ability to build graphs) include the Unified Interdepartmental Information and Statistical System 8 and the Demoscope Weekly website application 9. The BI-portal of Rosstat, where it is planned to publish the results of population censuses in the future, has a wider functionality 10, including the construction of maps. The project “Virtual population of Russia” 11 is an interesting project, which is a kind of digital census of the population of Russia [10, Zamyatina N.Yu., Yashun-skiy A.D.]. On the basis of the data from the profiles of users of the social network VKontakte, the authors reflected information about gender and age composition, popular names, education, migration and friendship networks in the interactive atlas at the regional and municipal levels.
Demographic dashboards were most developed during the COVID-19 pandemic, when the rapidity of information dissemination was particularly valued. In the early months of the pandemic, media attention around the world was focused on the Johns Hopkins University dashboard 12, which published data on infections and deaths by country. Subsequently, dashboards with more detailed data were developed. For example, Edward Parker from the London School of Hygiene and Tropical Medicine developed a dashboard 13 that reflects other major epidemics of the 21st century: SARS-2003, H1N1-2009, Ebola-2014. At the University of Northern Iowa, dashboards on the ArcGIS platform were developed [11, Petrov A.N., Welford M., Golosov N. et al.] on infections and deaths from coronavirus in Arctic countries and regions. In Russia, the Yandex dashboard is the most famous 14, where data is presented at the level of countries and constituent entities of the Russian Federation. In addition to infections and deaths, it published data on compliance with self-isolation in Russian cities and on the popularity of search queries related to coronavirus. Statistics on search queries about coronavirus treatment, loss of smell, or calling an ambulance can be used to predict outbreaks of infections [12, Ahmad I., Flanagan R., Staller K.].
Despite the extensive experience in creating demographic dashboards, there are no examples of sufficiently developed solutions covering various aspects of demographic development in the Arctic.
Methods and data
Three methodological principles were used to develop the “Digital twin of the Arctic population”.
Firstly, the hierarchy of territories was taken into account. The Arctic zone of the Russian Federation consists of territories of different levels: municipalities, constituent entities of the Russian Federation, macro-level (AZRF as a whole). Five constituent entities of the Russian Federation and one municipality (Evenki district) are partly included in the Arctic zone, which complicates the formation of a uniform information base. Therefore, almost all statistics were collected at the local municipal level and then aggregated to higher levels. This approach is consistent with the principles of Arctic space development. “Regional and zonal development is assembled from the “atoms” of local development. “Big” development of megaprojects and federal development routes can only be successful when relying on “small” development, on development “from below” through the efforts of local communities and entrepreneurs” [13, Zamyatina N.Yu., Pilyasov A.N., p. 17]. At the municipal level, it was possible to collect statistics on more than 50 indicators characterizing the size and composition of the population, natural and migration movements, employment and economic activity, education and quality of life.
Secondly, all data has a spatial representation. This is important because almost all aspects of life in the Arctic depend on the remoteness from the main centers of settlement. These patterns are best demonstrated by the “Atlas of population, society and economy in the Arctic” [14, Jungsberg L., Turunen E., Heleniak T. et al.]. A key role in the “Digital twin of the Arctic population”
is also given to cartographic materials: each region or district is represented by its borders on schematic maps. Settlements are shown as points with their coordinates. The Albers equal-area conic projection was used in the cartograms, centered at a point with coordinates (71°N, 107°E) in the north of the Krasnoyarsk Krai. This projection is convenient for depicting territories elongated in the latitudinal direction, like the Arctic zone. The dashboard reflects not only geographical, but also social space. In graph visualizations of migration networks, territories are closer to each other the greater the number of people who have moved between them.
Thirdly, traditional and new data sources that emerged due to digital transformation were combined — digital traces. Digital traces are understood as the results of social interaction using digital tools and spaces, as well as digital records of other culturally significant materials [15, Cesare N., Lee H., McCormick T., Spiro E., Zagheni E., p. 1980; 16, Smirnov A.V., p. 60]. They allow obtaining more detailed and timely data on demographic processes. The main sources of traditional statistical data of the “Digital twin of the Arctic population” were the Database of indicators of municipal entities of Rosstat 15 and the results of population censuses of 1939–2021. Among the new digital sources used, there were the data from the above-mentioned project “Virtual population of Russia” (migration), the ticket sales service Tutu.ru 16 (movement of people by trains and planes, the number of flight passengers restored to 100%), Yandex (morbidity, mortality, selfisolation and search queries during the pandemic), the Research data infrastructure project 17 (settlement). These data complement traditional statistics and reveal various aspects of demographic problems.
All datasets are in an organized format. The ordered or tidy data format is organized in such a way that each variable has its own column of a certain type, each observation has its own row, each value has its own cell, and each observation type has its own table [17, Wickham H., p. 10]. Columns of the same table are of equal size, but may contain missing values. Reducing data to this format provides a uniform approach to accessing data. For example, it allows representing any marker on a graph or map as a separate independent row, which simplifies the definition of color, size and other attributes of data points [18, Dabbas E.]. In our case, each row represents a combination of territory and year (for example, the urban district of Arkhangelsk in 2019). Each variable corresponds to exactly one column (population, number of births, migration growth, etc.).
The “Digital twin of the Arctic population” dashboard has client-server browser architecture. The main technologies used are shown in the diagram (Fig. 1). First of all, this is the Dash web framework in the Python programming language. Most of the graphs and cartograms were created using the Plotly software, and the migration network visualizations were created using Cy-toscape. The scikit-learn, NumPy and pandas software packages were used for clustering and fore- casting; NetworkX was used to analyze network data structures; GeoPy was used to analyze spatial data. User interaction with the dashboard is carried out through the Nginx web server and the
Gunicorn WSGI server. The source code and data files are publicly available in the project reposi- tory on GitHub 18.
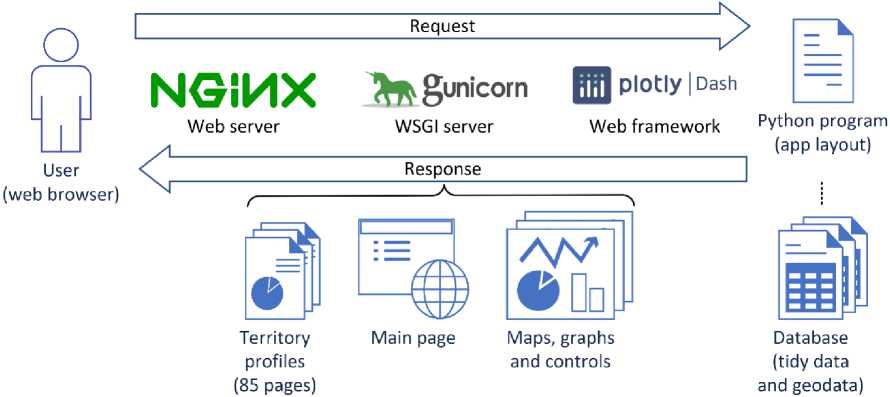
Fig. 1. Architecture of the dashboard “Digital twin of the Arctic population”.
Application of the “Digital twin of the Arctic population”
Let us consider some of the problems that can be solved using the developed toolkit. The dashboard allows us to determine the spatial boundaries of socio-demographic problems at a certain point in time, that is, to perform problem zoning of the Arctic [19, Lazhentsev, V.N., p. 40]. Table 1 presents the most and least prosperous territories according to some socio-demographic indicators for 2019–2021. For most indicators (fertility, mortality, migration, demographic burden, wages, production volume), the best values are demonstrated by the territories of new development in the Asian part of the Arctic. The situation is not so clear with the worst values. In terms of some indicators, the outsiders are rural areas and cities of old development of the European part of the Arctic (birth rate, gender and age composition, wages), and in others — some Asian territories (mortality, migration within the region). The COVID-19 pandemic had the least impact on mortality in remote and isolated areas. The only indicator in which the largest cities of the European part of the Arctic (Arkhangelsk and Murmansk) are leading is the share of students in the population.
Table 1
Leading and outsider territories by socio-demographic indicators, 2019–2021 19
|
Index |
Best values |
Worst values |
|
Special fertility rate |
MD Yamalskiy, MA Olenekskiy, MA Chukotskiy |
CD Inta, CD Arkhangelsk, CD Anadyr |
|
Standardized mortality rate |
CD Gubkinskiy, MO Nadymskiy, CD Novyy Urengoy |
MA Chukotskiy, MA Zhiganskiy, CD Providenskiy |
18 Digital Arctic. GitHub. URL: (accessed 01 March 2023).
19 Source: Digital Twin of the Arctic Population. URL: (accessed 01 March 2023).
|
Excess mortality during the pandemic |
CATU Ostrovnoy, MA Krasnoselkupskiy, MA Ust-Tsilemskiy |
MA Abyyskiy, MA Belomorskiy, MA Kemskiy |
|
Intraregional migration growth rate |
CD Egvekinot, MA Primorskiy, CD Naryan-Mar |
MA Chukotskiy, MA Srednekolymskiy, MA Krasnoselkupskiy |
|
Interregional migration growth rate |
CD Pevek, MA Anadyrskiy, MD Nadymskiy |
CD Anadyr, CD Vorkuta, CD Usinsk |
|
International migration growth rate |
CD Pevek, MA Bilibinskiy, MA Anadyrskiy |
CD Gubkinskiy, MD Priuralskiy, MA Lovozerskiy |
|
Sex ratio (population equality is considered optimal) |
MA Srednekolymskiy, MA Verkhoyanskiy, MA Anabarskiy |
CD Pevek, CD Novodvinsk, CD Arkhangelsk |
|
General demographic load |
CD Norilsk, CD Anadyr, CD Gubkinskiy |
MA Leshukonskiy, MA Mezenskiy, MA Loukhskiy |
|
Ratio of wages to the cost of a set of goods and services |
MD Nadymskiy, CD Norilsk, CD Novyy Urengoy |
MA Onezhskiy, MA Kalevalskiy, MA Lovozerskiy |
|
Goods shipped, work and services performed per person |
MD Yamalskiy, MD Tazovskiy, MA Turukhanskiy |
MA Leshukonskiy, MA Kalevalskiy, MA Ust-Tsilemskiy |
|
Number of students of universities and vocational education institutions per 1000 inhabitants |
CD Arkhangelsk CD Salekhard CD Murmansk |
33 municipalities have no HE and VE institutions |
A more detailed idea of the spatial differentiation of territories for each of the considered indicators can be obtained by constructing the corresponding cartograms (Fig. 2a). The dashboard automatically ranks all territories according to the selected indicator for the selected year. A multivariate analysis tool has been developed to identify patterns between various indicators. It allows, based on a bubble chart, to compare Arctic territories simultaneously by four variables: the value of the first is reflected along the X-axis, the second — along the Y-axis, the third — through the size of the circle, and the fourth — through its color (Fig. 2b). The tool allows identifying a variety of patterns by combining variables, using logarithmic scales and trend lines. For more detailed analysis by external tools, data files can be downloaded from the project repository.
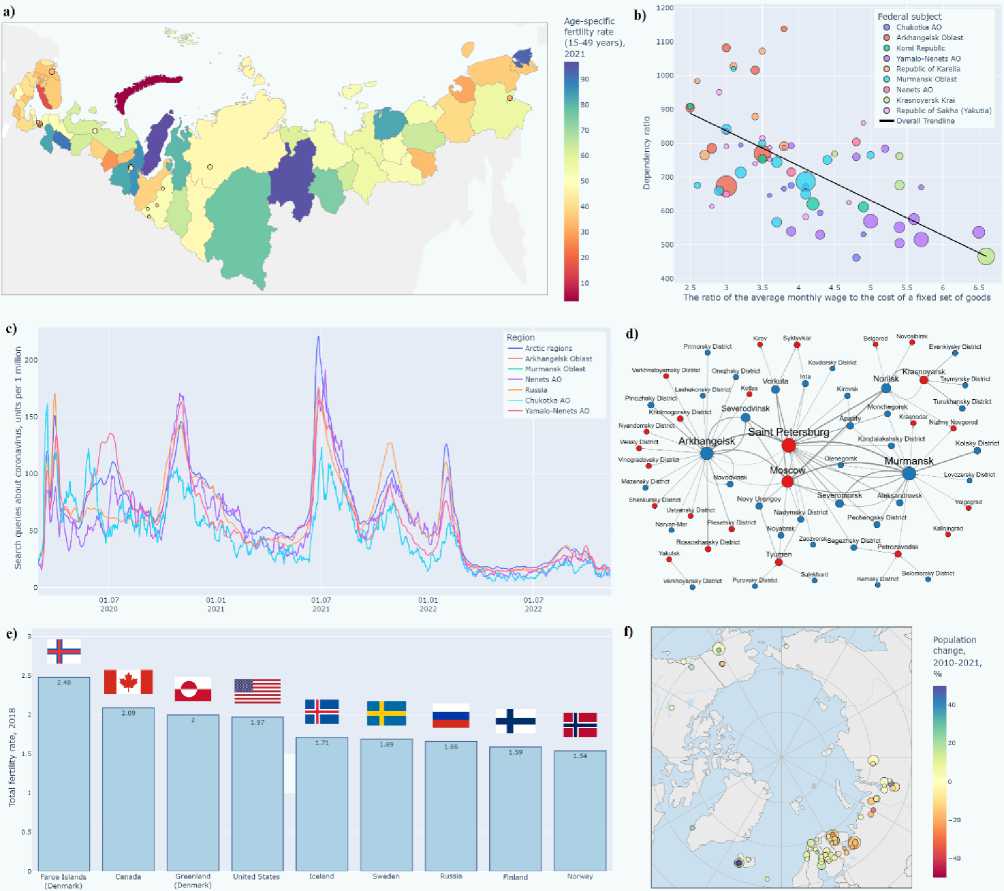
Fig. 2. Some elements of the dashboard: a) zoning by indicator; b) multivariate analysis; c) dynamics of search queries about the pandemic; d) the largest flows of the migration network; e) ranking of countries by birth rate; f) map of the global Arctic settlement 20.
The dashboard provides for clustering of territories, including multivariate clustering, using the k-means method; predicting indicator values; analyzing the settlement system, e.g., estimating the population size within a certain radius of a settlement; visualizing time series of pandemic indicators (Fig. 2c), including the dynamics of search queries and the self-isolation index [2, Smirnov A.V.]; study migration networks [20, Danchev V., Porter M.A.] (Fig. 2d) and transport passenger flows in the Arctic [16, Smirnov A.V.]; analyzing the indicators of scientific and educational organizations located within the Arctic zone. Special attention in the “digital twin” is paid to the global Arctic. A comparison of Arctic countries according to main demographic indicators has been implemented (Fig. 2e). An interactive population distribution map of the global Arctic is available (Fig. 2f) 21.
The “Digital twin of the Arctic population” contains demographic profiles of all 75 urban districts, municipal districts and areas, as well as 9 regions of the Arctic zone of the Russian Federation. The choice of territory is carried out in the menu in the upper right corner of the dashboard. The profile includes a brief description of the territory, graphs of the dynamics of demographic indicators with the possibility of comparison with other territories, information on the population of all cities and towns since 1939, an age pyramid for 2021, the educational composition of the population and the values of the main demographic indicators. As an example, Figure 3 shows a fragment of the profile of the urban district of Vorkuta — one of the fastest decreasing municipalities in the Russian Arctic [21,
Fauzer V.V., Lytkina T.S., Fauzer G.N., p. 47].
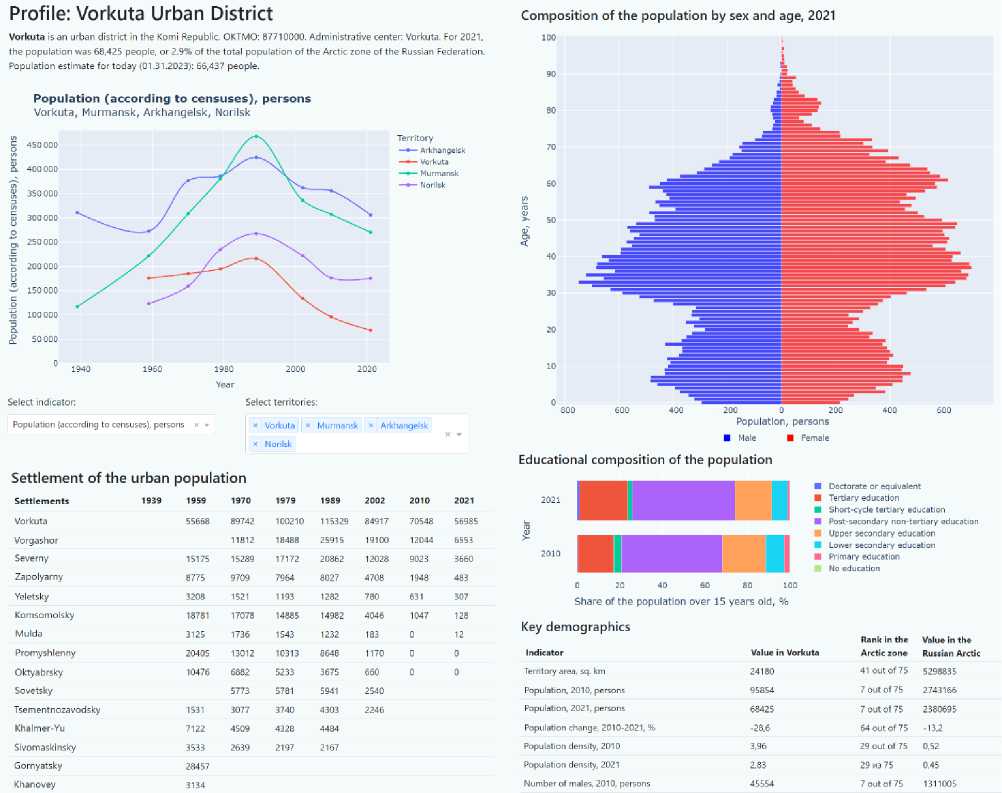
Fig. 3. Fragment of the demographic profile of Vorkuta: brief information, population dynamics in comparison with other territories, settlement in 1939–2021, age pyramid, educational composition, main indicators 22.
Conclusion
As part of the study, the “Digital twin of the Arctic population” dashboard was implemented — an interactive website containing detailed data on the Arctic population down to the municipal and settlement levels. The “digital twin” covers such issues as the size, dynamics and composition of the population, settlement, natural and migration movements, labor and employment,
-
22 UD Vorkuta — Digital twin of the Arctic population. URL: https://digital-arctic.ru/ГО%20Воркута (accessed 01
March 2023).
transport movements, science and education, and the impact of the pandemic. Tools for ranking, multivariate analysis, clustering and predicting indicator values have been implemented for researchers. From the perspective of state and municipal administration, as well as local businesses, the main interest is in demographic profiles of regions and territories, reflecting information about the existing demographic situation.
In the future, it is planned to improve the digital twin in several directions. Firstly, by adding new indicators and updating data. Secondly, based on the results of the 2021 population census, it is planned to develop a detailed demographic forecast, taking into account, among other things, the educational composition of the population, which will make it possible to predict the size and qualitative composition of the labor force in the Arctic territories.
References “Digital Twin” of the Arctic Population in Demographic Research and Territorial Development Management
- Lundgren A., Randall L., Norlén G. State of the Nordic Region 2020 – Wellbeing, Health and Digitali-sation Edition. Copenhagen, Nordic Council of Ministers, 2020, 71 p. DOI: 10.6027/nord2020-052
- Smirnov A.V. Vliyanie pandemii na demograficheskie protsessy v Rossiyskoy Arktike [The Impact of the Pandemic on Demographic Processes in the Russian Arctic]. Ekonomicheskie i sotsial'nye peremeny: fakty, tendentsii, prognoz [Economic and Social Changes: Facts, Trends, Forecast], 2021, vol. 14, no. 6, pp. 258–274. DOI: 10.15838/esc.2021.6.78.15
- Kitchin R. Setevoy urbanizm, osnovannyy na dannykh [Data-Driven, Networked Urbanism]. In: Seti goroda: Lyudi. Tekhnologii. Vlasti [City Networks. People. Technologies. Authorities]. Moscow, New Literary Observer Publ., 2021, pp. 58–80. (In Russ.)
- Dmitrieva T.E., Chuprova I.A. Informatsionnaya osnova sotsial'no-ekonomicheskogo razvitiya Ark-ticheskoy zony Rossiyskoy Federatsii [Information Basis for Socio-Economic Development of the Arctic Zone of Russian Federation]. In: Nauka v regional'nom prostranstve sovremennoy Rossii i za-rubezh'ya: sbornik nauchnykh statey [Science in the Regional Space of Modern Russia and Foreign Countries]. Syktyvkar, KSC UB RAS Publ., 2019, pp. 141–147. (In Russ.)
- Batty M., Milton R. A New Framework for Very Large-Scale Urban Modelling. Urban Studies, 2021, vol. 58 (15), pp. 3071–3094. DOI: 10.1177/0042098020982252
- Wickham H. Mastering Shiny: Build Interactive Apps, Reports, and Dashboards Powered by R. CA: O'Reilly, 2021. 369 p.
- Matheus R., Janssen M., Maheshwari D. Data Science Empowering the Public: Data-Driven Dash-boards for Transparent and Accountable Decision-Making in Smart Cities. Government Information Quarterly, 2018, vol. 37, iss. 3. 101284. DOI: 10.1016/j.giq.2018.01.006
- Nochta T., Wan L., Schooling J.M., Parlikad A.K. A Socio-Technical Perspective on Urban Analytics: The Case of City-Scale Digital Twins. Journal of Urban Technology, 2020, vol. 28 (4), pp. 263–287. DOI: 10.1080/10630732.2020.1798177
- Lutz W., Goujon A., Kc S., Stonawski M., Stilianakis N. Demographic and Human Capital Scenarios for the 21st Century: 2018 Assessment for 201 Countries. Luxembourg, Publications Office of the Euro-pean Union, 2018, 595 p. DOI: 10.2760/41776
- Zamyatina N.Yu., Yashunsky A.D. Virtual'naya geografiya virtual'nogo naseleniya [Virtual Geography of Virtual Population]. Monitoring obshchestvennogo mneniya: ekonomicheskie i sotsial'nye peremeny [Monitoring of Public Opinion: Economic and Social Changes], 2018, no. 1, pp. 117–137. DOI: 10.14515/monitoring.2018.1.07
- Petrov A.N., Golosov N., Degai T., Welford M., Degroote J., Devlin M., Savelyev A. The “second wave” of the COVID-19 pandemic in the Arctic: Regional and temporal dynamics. International Journal of Circumpolar Health, 2021, vol. 80 (1), pp. 1925446. DOI: 10.1080/22423982.2021.1925446
- Ahmad I., Flanagan R., Staller K. Increased Internet Search Interest for GI Symptoms May Predict COVID-19 Cases in US Hotspots. Clinical Gastroenterology and Hepatology, 2020, vol. 18, iss. 12, pp. 2833–2834. DOI: 10.1016/j.cgh.2020.06.058
- Zamyatina N.Yu., Pilyasov A.N. The New Theory of the Arctic and Northern Development: Multi-Scale Interdisciplinary Synthesis. Arktika i Sever [Arctic and North], 2018, no. 31, pp. 4–21. DOI: 10.17238/issn2221-2698.2018.31.5
- Jungsberg L., Turunen E., Heleniak T., Wang S., Ramage J., Roto J. Atlas of Population, Society and Economy in the Arctic. Stockholm, Nordregio, 2019, 78 p. DOI: 10.30689/WP2019:3.1403-2511
- Cesare N., Lee H., McCormick T., Spiro E., Zagheni E. Promises and Pitfalls of Using Digital Traces for Demographic Research. Demography, 2018, vol. 55 (5), pp. 1979–1999. DOI: 10.1007/s13524-018-0715-2
- Smirnov A.V. Tsifrovye sledy naseleniya kak istochnik dannykh o migratsionnykh potokakh v ros-siyskoy Arktike [Digital Traces of the Population as a Data Source on Migration Flows in the Russian Arctic]. Demograficheskoe obozrenie [Demographic Review], 2022, vol. 9, no. 2, pp. 42–64. DOI: 10.17323/demreview.v9i2.16205
- Wickham H. Tidy Data. Journal of Statistical Software, 2014, vol. 59 (10), pp. 1–23. DOI: 10.18637/jss.v059.i10
- Dabbas E. Interactive Dashboards and Data Apps with Plotly and Dash: Harness the power of a fully fledged frontend web framework in Python – no JavaScript required. Birmingham: Packt, 2021. 364 p.
- Lazhentsev V.N. Kontseptsiya programmnogo resheniya problem formirovaniya i razvitiya terri-torial'no-khozyaystvennykh system [A Concept for Program Solution to the Issues of Formation and Development of Territorial-Economic Systems]. Ekonomicheskie i sotsial'nye peremeny: fakty, ten-dentsii, prognoz [Economic and Social Changes: Facts, Trends, Forecast], 2017, vol. 10, no. 5, pp. 37–50. DOI: 10.15838/esc/2017.5.53.3
- Danchev V., Porter M.A. Migration Networks: Applications of Network Analysis to Macroscale Mi-gration Patterns. In: Research Handbook on International Migration and Digital Technology. Chel-tenham, Edward Elgar Publishing, 2021, pp. 70–90. DOI: 10.4337/9781839100611
- Fauzer V.V., Lytkina T.S., Fauzer G.N. Osobennosti rasseleniya naseleniya v Arkticheskoy zone Rossii [Features of Population Settlement in the Arctic Zone of Russia]. Arktika: ekologiya i ekonomika [Arctic: Ecology and Economy], 2016, no. 2 (22), pp. 40–50.
